
Market Overview
| Study Period | 2021 - 2031 |
|---|---|
| Forecast Data Period | 2026 - 2031 |
| Base Year Market Size (2025) | USD 89.54 Billion |
| Market Size (2026) | USD 96.81 Billion |
| Market Size (2031) | USD 142.86 Billion |
| Growth Rate (2026 - 2031) | 8.11 % |
| Market Concentration | Low |
Major Players *Disclaimer: Major Players sorted in no particular order Image © Mordor Intelligence. Reuse requires attribution under CC BY 4.0. | |
Asia-Pacific Snack Food Market Analysis by Mordor Intelligence
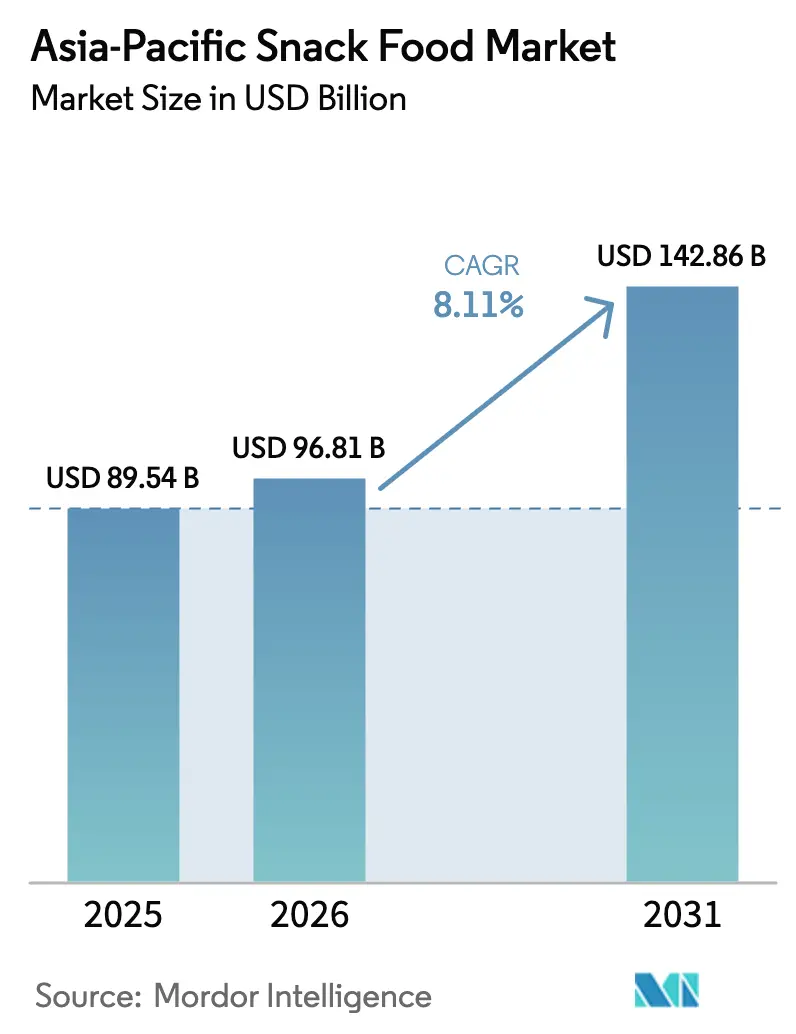
The Asia-Pacific snack food market size was valued at USD 89.54 billion in 2025 and estimated to grow from USD 96.81 billion in 2026 to reach USD 142.86 billion by 2031, at a CAGR of 8.11% during the forecast period (2026-2031). This growth is driven by changing consumer habits, particularly among Gen Z, who increasingly prefer snacks as meal replacements. Rising disposable incomes in developing countries and rapid urbanization, which reduces the time available for meal preparation, are contributing to the market's expansion. Global companies are adopting localization strategies, combining high-quality global standards with flavors tailored to regional preferences. Meanwhile, local brands are capitalizing on their cultural relevance and flexible supply chains to maintain their market positions. By product type, frozen snacks are becoming more mainstream. In terms of category, clean-label products, which emphasize natural and transparent ingredients, are gaining traction, challenging traditional snack options. For packaging, protective formats are thriving, especially with the growth of e-commerce, as they ensure product safety during delivery. Regarding distribution channels, the rise of online platforms is reshaping how snacks are marketed and sold, with digital channels offering a wider assortment of products. The Asia-Pacific snack food market remains fragmented, with the top 5 brands collectively holding a significant but not dominant share of the market.
Key Report Takeaways
- By product type, savory snacks led with 34.12% of the Asia-Pacific snack food market share in 2025, while frozen snacks are forecast to advance at a 9.16% CAGR to 2031.
- By category, conventional products accounted for 85.12% of the Asia-Pacific snack food market size in 2025; organic/clean-label snacks are projected to post an 8.76% CAGR through 2031.
- By packaging type, bags/pouches captured 66.55% revenue share in 2025, whereas cans are expected to expand at a 8.74% CAGR to 2031.
- By distribution channel, supermarkets/hypermarkets retained 47.62% share of the Asia-Pacific snack food market size in 2025, while online retail is rising fastest at a 9.08% CAGR through 2031.
- By country, China dominated with 35.12% market share in 2025; India is anticipated to register a 9.31% CAGR and emerge as the largest incremental contributor to regional growth by 2031.
Note: Market size and forecast figures in this report are generated using Mordor Intelligence’s proprietary estimation framework, updated with the latest available data and insights as of 2026.
Market Trends and Insights
Drivers Impact Analysis of Asia-Pacific Snack Food Market*
| DRIVER | (~) % IMPACT ON CAGR FORECAST | GEOGRAPHIC RELEVANCE | IMPACT TIMELINE |
|---|---|---|---|
| Growing demand for convenient and portable formats | +1.2% | Strongest in urban China, Japan, South Korea | Medium term (2-4 years) |
| Increasing consumer preference for healthy snack options | +1.5% | Asia-Pacific core, led by Australia, Singapore, urban India | Long term (≥ 4 years) |
| Innovation in flavors and the rise of gourmet premium products | +0.9% | Japan, South Korea, urban China, Australia | Short term (≤ 2 years) |
| Emergence of sustainability and ethical sourcing | +0.7% | Australia, Singapore, urban markets across Asia-Pacific | Long term (≥ 4 years) |
| Youth and Gen Z Consumption Patterns | +1.8% | China, India, Southeast Asia | Medium term (2-4 years) |
| Rising emotional and functional snacking | +1.1% | Particularly strong in China, India, Japan | Medium term (2-4 years) |
| Source: Mordor Intelligence | |||
Growing demand for convenient and portable formats
Urban lifestyles in the Asia-Pacific region are leaving people with less time for traditional meals, leading to a growing demand for snack foods that are easy to carry or require little to no preparation. This shift is largely driven by factors such as increasing urbanization, longer commuting times, and busier work schedules. For example, in Japan, the employment rate increased by 0.8% points to 62.3% by mid-2025, according to the Organisation for Economic Co-operation and Development (OECD)[1]. Convenience stores are expanding in emerging markets. In Vietnam, chains like Circle K and 7-Eleven operate many outlets, with 7-Eleven ranking 4th in terms of scale, operating over 120 stores exclusively in Ho Chi Minh City, as of June 2025, as per Vietnam Investment Review, showcasing the success of the "grab-and-go" retail model[2]. This growing network of convenience stores is making it easier for consumers to access snacks on the go.
Increasing consumer preference for healthy snack options
Consumer preferences in the Asia-Pacific region are increasingly shifting toward snacks with healthier ingredients, reduced sugar, and clean labels. More people are now willing to pay a premium for snacks that offer health benefits, as these products are becoming more mainstream. According to the India Brand Equity Foundation (2024), 72% of Indian consumers actively looked for snacks that provide functional benefits, such as boosting energy, improving mood, or offering higher protein content[3]. Brands that incorporate plant-based proteins, probiotics, and vitamin-enriched formulations are gaining popularity among health-conscious consumers who value transparency in ingredients. For instance, in 2024, Singapore-based supplements company Sainhall introduced its DeeFruit fruit snacks range. This product line highlights the growing demand for convenient and health-focused snack options, reflecting the evolving preferences of consumers across the Asia-Pacific region.
Innovation in flavors and the rise of gourmet premium products
The Asia-Pacific snack food market is experiencing growing demand for high-quality and premium snacks as consumers increasingly look for unique, indulgent, and culturally relevant flavors. For example, in 2024, South Korea’s CJ CheilJedang introduced O-Right Protein Tempeh Chips in Thailand, blending local ingredients with modern snack formats to attract health-conscious buyers. Similarly, in March 2025, India's JK Foods launched Fun Flips' Ghost Puffs, a spicy snack featuring the intense heat of Bhut Jolokia (Ghost Pepper), aimed at spice lovers seeking bold and adventurous flavors. These examples highlight a rising trend where consumers, especially younger generations, are drawn to snacks that offer exciting and innovative taste experiences. This shift in preferences is encouraging brands to focus on flavor innovation and unique offerings, helping them stand out in the competitive Asia-Pacific snack food market while building customer loyalty and driving sales growth.
Rising emotional and functional snacking
In the Asia-Pacific snack food market, snacks are increasingly being designed to combine functional benefits with emotional comfort to meet changing consumer preferences. For example, urban professionals often choose magnesium-infused chocolate to help relieve stress while also replenishing essential nutrients during late-night work sessions. Ingredients like ashwagandha and bacillus coagulans are gaining popularity as consumers increasingly trust snacks with scientifically backed benefits. A 2024 study published in the South Eastern European Journal of Public Health revealed that 9.6% of respondents experienced mild stress, 84.9% moderate stress, and 5.5% severe stress, highlighting the growing demand for snacks that support emotional well-being[4]. These snacks, which combine emotional and functional benefits, are becoming more relevant for various occasions, broadening their appeal and importance in the market.
Restraints Impact Analysis of Asia-Pacific Snack Food Market*
| RESTRAINT | (~) % IMPACT ON CAGR FORECAST | GEOGRAPHIC RELEVANCE | IMPACT TIMELINE |
|---|---|---|---|
| Health concerns around high salt and sugar content | -0.8% | Particularly Singapore, Australia with stricter regulations | Short term (≤ 2 years) |
| Taxation and import duties | -1.2% | Vietnam, potential Indonesia implementation, high-tariff markets | Medium term (2-4 years) |
| Strict regulations concerning additives, labeling, and nutritional information disclosure | -0.6% | India (FSSAI), Singapore, Malaysia, Australia | Long term (≥ 4 years) |
| Food safety scandals and trust issues | -0.9% | China, regional spillover effects | Medium term (2-4 years) |
| Source: Mordor Intelligence | |||
Health concerns around high salt and sugar content
Growing public-health awareness is creating challenges for traditional snack categories in the Asia-Pacific market. For instance, Singapore’s Nutri-Grade labeling system uses color-coded indicators to highlight high-sugar beverages. In response, manufacturers are making significant changes to their products and are introducing baked or air-popped alternatives and ensuring healthier options are more visible on store shelves. A 2023 study published in PubMed Central revealed that the average daily salt intake in India is around 11 grams, more than double the World Health Organization’s recommended limit. This has led to a national goal of reducing sodium intake by 30% by 2025 through measures such as reformulating products, introducing front-of-package labels, restricting marketing of high-sodium foods, and imposing taxes on such products[5]. These trends highlight the need for manufacturers to focus on creating healthier snack options, innovating new formulations to meet changing consumer expectations.
Strict regulations concerning additives, labeling, and nutritional information disclosure
Regulations on additives, labeling, and nutritional information are playing a significant role in shaping the Asia-Pacific snack food market. For instance, in India, the Food Safety and Standards Authority of India (FSSAI) requires front-of-pack warnings for products high in fat, sugar, and salt (HFSS). Manufacturers must self-declare nutritional details in all advertising, increasing compliance challenges. Ingredient approvals also vary across the region. For example, natural colorants allowed in Japan may be banned in Australia, forcing companies to create separate formulations for different markets, which adds complexity and costs to managing stock-keeping units (SKUs). Smaller companies often face difficulties meeting these regulatory demands due to limited resources and expertise. This can lead to their withdrawal from high-cost markets, reducing competition and giving larger players an advantage.
*Our forecasts treat driver/restraint impacts as directional, not additive. The impact forecasts reflect baseline growth, mix effects, and variable interactions.
Asia-Pacific Snack Food Market Segment Analysis
By Product Type:
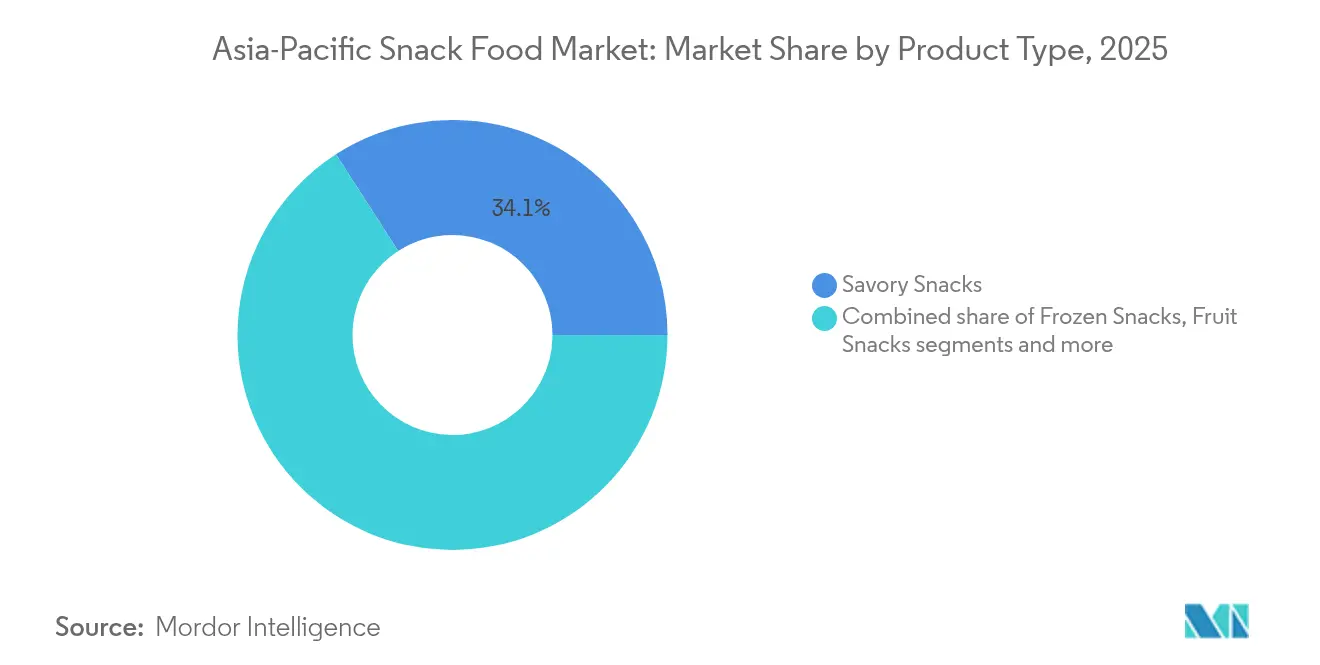
Frozen Snacks Edge Into Mainstream StatusIn 2025, savory snacks remained the leading category in the Asia-Pacific snack food market, holding a 34.12% share of the total market. This dominance is attributed to the wide variety of region-specific flavors and seasonings that cater to diverse consumer preferences. From spicy and tangy to umami-rich options, these snacks appeal to people across different age groups and cultural backgrounds. Their popularity is further supported by strong availability in both traditional retail outlets and modern trade channels. Continuous innovation in localized flavors has helped maintain their position as the most preferred snack category in the region.
Frozen snacks, on the other hand, are emerging as the fastest-growing segment, projected to achieve a CAGR of 9.16% through 2031. This growth is driven by increasing urbanization, busier lifestyles, and improved cold-chain infrastructure, which make these snacks more accessible and convenient. Consumers are increasingly opting for ready-to-eat or easy-to-prepare frozen options, prompting manufacturers to introduce new flavors, healthier alternatives, and premium products. As a result, frozen snacks are gradually reshaping the market landscape, creating significant opportunities for both local and global players to expand their presence in this evolving segment.

By Category:
Clean-Label Momentum Confronts Conventional ScaleIn 2025, conventional snacks, such as potato chips, sugar-coated biscuits, and other traditional options, held the largest share of the Asia-Pacific snack market, accounting for 85.12%. These snacks are popular due to their affordability, easy availability in retail stores, and alignment with local taste preferences. Their strong brand presence and well-established supply chains make them a reliable choice for consumers across both developed and developing markets. The familiarity and comfort associated with these snacks ensure they remain a key revenue generator in the region, appealing to a wide range of age groups and demographics.
On the other hand, organic and clean-label snacks are quickly gaining traction and are expected to grow at a CAGR of 8.76% through 2031, nearly double the growth rate of conventional snacks. This growth is fueled by increasing awareness of health and wellness, rising disposable incomes, and a growing preference for snacks made with natural and transparent ingredients. Manufacturers are introducing innovative products with healthier formulations, natural flavors, and added nutritional benefits to cater to this demand. These snacks are particularly popular among younger, health-conscious consumers, creating new opportunities for both niche brands and established players to expand their market presence.
By Packaging Type:
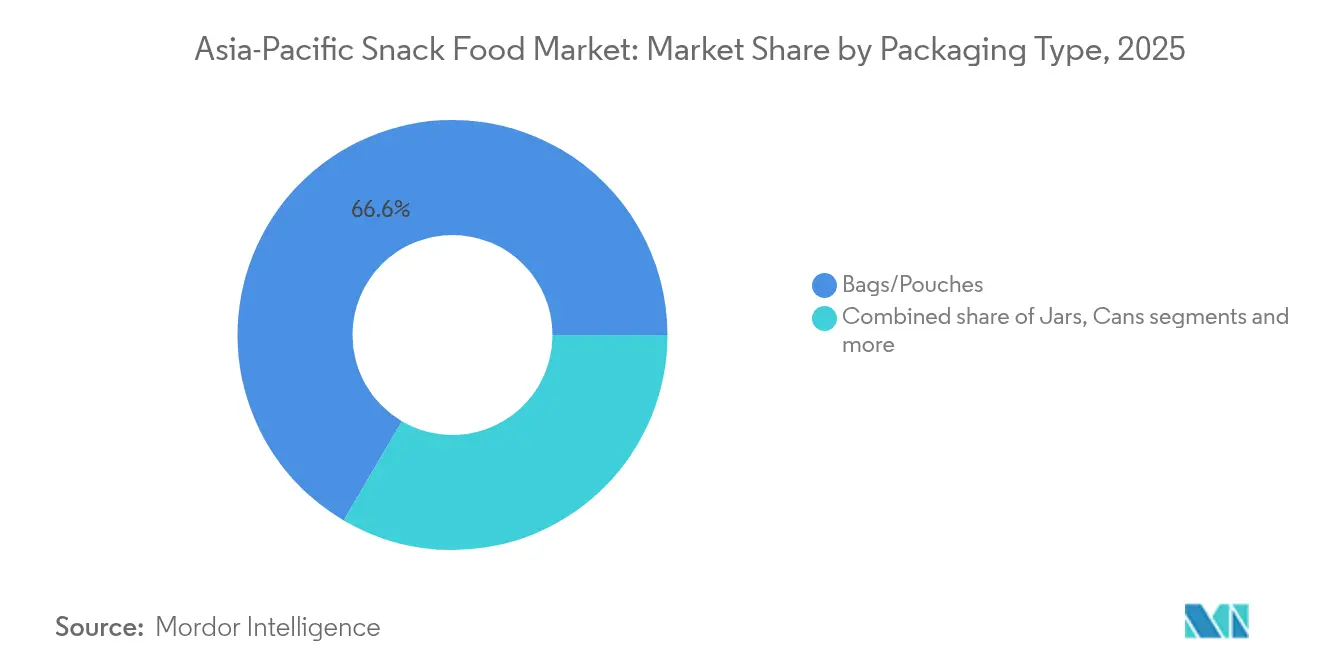
Protective Formats Thrive With E-commerceBags/pouches were the most widely used snack packaging formats in the Asia-Pacific region, making up 66.55% of retail units sold in 2025. Their popularity is due to their convenience, lightweight nature, and ability to store a variety of snacks like chips, crackers, and nuts. These packaging options are affordable and easy to carry, making them ideal for on-the-go consumption. Their flexibility allows for creative designs that attract consumers and improve shelf visibility. With their cost-effectiveness and widespread availability, bags and pouches continue to dominate the snack packaging market in the region.
On the contrary, cans are quickly becoming the fastest-growing packaging format, with a projected CAGR of 8.74% through 2031. This growth is largely driven by the rise of e-commerce, where durable and stackable packaging is essential for safe shipping. Cans are particularly popular for premium and bulk snack products, as they offer better protection and a longer shelf life. Consumers are increasingly drawn to the convenience and sturdiness of cans, making them a preferred choice for certain snack categories. As online shopping expands and consumer preferences evolve, cans are expected to play a more significant role in the snack packaging market.
By Distribution Channel:
Digital Sprawl Reshapes Assortment TacticsIn 2025, supermarkets/hypermarkets continued to lead as the primary distribution channel for snacks in the Asia-Pacific, contributing to 47.62% of total sales. These stores are popular because they offer a convenient shopping experience, allowing customers to find a wide variety of snacks in one place. Their strong presence in both urban and semi-urban areas ensures easy accessibility for consumers. Attractive discounts, promotions, and loyalty programs further encourage shoppers to choose these outlets for their snack purchases. Supermarkets and hypermarkets also cater to a broad audience, offering both affordable and premium snack options to meet diverse consumer preferences.
On the other hand, online channels are experiencing rapid growth, with a projected CAGR of 9.08% through 2031. This growth is driven by the increasing popularity of social-commerce platforms like TikTok Shop mini-programs, which provide engaging and personalized shopping experiences. Consumers are drawn to the convenience of home delivery, easy product discovery, and seamless digital payment options. These factors make online platforms particularly appealing to younger, tech-savvy consumers who value speed and convenience. As e-commerce continues to expand, it is becoming a significant driver of growth in the snack market.
Geography Analysis
China Snack Food Market
China accounted for 35.12% of the market value in 2025, but its growth has slowed to single digits, indicating a maturing market. In Tier-1 cities, consumers are shifting toward premium products like seaweed crisps and zero-sugar oat cookies, while lower-tier cities continue to prefer traditional puffed rice snacks. Stricter regulations on influencer advertising have led to more rigorous compliance checks before product launches. Despite these challenges, China remains a key player in the Asia-Pacific snack food market due to its well-established distribution networks and robust cold-chain infrastructure.
India Snack Food Market
India is expected to grow at a strong 9.31% CAGR, driven by rapid urbanization and a growing middle class that increasingly favors packaged foods. Between 2015 and 2025, urbanization in India is projected to rise by 67%, creating significant opportunities for snack manufacturers. The Food Safety and Standards Authority of India (FSSAI) has simplified licensing processes, while the rise in smartphone usage has fueled e-commerce growth in Tier-2 cities. Local brands are leveraging these trends to gain a competitive edge, while multinational companies are forming joint ventures, such as PepsiCo’s interest in Haldiram, to tap into culturally relevant products and avoid the challenges of entering the market independently.
ASEAN and Oceania Snack Food Market
Southeast Asia showcases diverse growth patterns across its markets. Indonesia has attracted significant investments, such as PepsiCo’s USD 200 million production facility in Cikarang, which benefits from tariff advantages. In Vietnam, the introduction of a sugar tax is likely to push manufacturers toward alternative sweeteners, while Circle K’s extensive store network provides a ready platform for new product launches. Thailand and the Philippines are seeing a rise in plant-based snacks, supported by consumers with adventurous tastes influenced by tourism. Meanwhile, Australia and New Zealand serve as testing grounds for clean-label products, offering valuable insights that can be applied across the broader Asia-Pacific snack food market.
Regulatory Landscape
Snack manufacturers in Asia-Pacific face a tightening mix of nutrition, labeling, and safety oversight that increasingly shapes formulation, claims, and go-to-market timelines. In India, the Food Safety and Standards Authority of India (FSSAI) continues to drive front-of-pack and advertising-related nutrition disclosures for HFSS products, pushing brands to substantiate claims and rework pack communication. In Singapore, the Singapore Food Agency (SFA) shifted food establishment oversight to the SAFE framework in January 2026, reinforcing compliance expectations across production and handling environments that also support snack supply chains.
Across Southeast Asia and developed markets, labeling harmonization remains limited, which keeps SKU complexity high for regional brands. Indonesia continues to enforce halal certification requirements under BPJPH supervision, and BPOM advanced a draft Nutri-Level front-of-pack labeling proposal in April 2026, raising expectations on nutrition transparency and potential reformulation. Australia and New Zealand also anchor ingredient and additive compliance through the Food Standards Code (including an October 2025 compilation). In addition, global food safety schemes used by large snack producers, such as FSSC 22000 Version 7, add newer operational expectations (including food loss and waste requirements), which can affect plant KPIs and supplier qualification.
Competitive Landscape
The Asia-Pacific snack food market is highly fragmented, with the top five brands holding less than 30% of the total market share. These major players face strong competition from smaller, agile local brands. Companies are actively pursuing acquisitions to expand their market presence. For instance, Mondelēz is working to acquire a majority stake in China’s Evirth cakes to strengthen its position in the chilled dessert segment. Similarly, private equity firms like Creador are investing in mid-sized brands, such as their 40% stake in Adilmart, to help these companies scale operations across borders.
Technology is playing a crucial role in shaping competition within the market. Companies like Nissin are using advanced sensory testing facilities, while Nestlé employs AI-driven demand forecasting to manage inventory efficiently across thousands of retail outlets in Asia. Marketing strategies are also evolving, with businesses allocating significant budgets to platforms like TikTok to engage younger audiences through short-form videos. Sustainability is becoming a key focus, as companies without clear environmental goals risk losing shelf space in major retail markets like Singapore and Australia. This shift is pushing brands to adopt greener practices to stay competitive.
Opportunities for growth in the market lie in areas such as functional snacks, eco-friendly packaging, and innovative flavor combinations. Local brands often excel in creating culturally relevant flavors, giving them an edge over global competitors. However, multinational companies leverage their financial resources to invest in advanced technologies like automation and product traceability. The diverse demographics and rapidly changing retail landscape in the Asia-Pacific region ensure that competition remains dynamic, encouraging continuous innovation and creating moderate barriers to entry for new players.
Asia-Pacific Snack Food Industry Leaders
-
PepsiCo Inc.
-
Nestlé SA
-
Mondelēz International Inc.
-
ITC Limited
-
Unilever PLC
- *Disclaimer: Major Players sorted in no particular order

Asia-Pacific Snack Food Market Companies Covered in this Report
- PepsiCo Inc.
- Calbee Inc.
- Nestlé SA
- Mondelēz International Inc.
- Mars Inc.
- ITC Limited
- Britannia Industries Limited
- Parle Products
- Lotte Corporation
- Meiji Holdings Co. Ltd.
- Orion Corp.
- General Mills Inc.
- Unilever PLC
- Haldiram Snacks Food Pvt. Ltd.
- McCain Foods Limited
- Prataap Snacks Limited
- Dabur India Ltd.
- Balaji Wafers Pvt. Ltd.
- Bikaji Foods International Limited
- Priniti Foods
Market Opportunities and Future Outlook
Opportunities are emerging where manufacturers can turn compliance pressure into differentiated propositions, particularly through reformulation, ingredient transparency, and functional or better-for-you positioning. Indonesia's halal requirements under BPJPH and the April 2026 draft Nutri-Level labeling direction from BPOM create space for products designed for faster certification and clearer front-of-pack communication, while encouraging regional players to build fewer, more compliant core formulations. At the same time, tighter safety and labeling norms in markets such as India (FSSAI) and Australia/New Zealand (Food Standards Code) increase demand for more centralized regulatory data management and tighter supplier documentation discipline, favoring scaled players and specialized co-manufacturers.
Capacity expansion, localization, and supply-chain modernization also remain practical routes to growth. PepsiCo India disclosed a manufacturing investment commitment of INR 5,700 crore for 2025-2030 across sites including Madhya Pradesh, Assam, and Tamil Nadu, reflecting continued emphasis on local production footprints for large-format categories that include snacks. PepsiCo's APAC Greenhouse Program (IMPACT Edition, 2026) further highlights deployable solutions across logistics, sustainable agriculture, and emissions reduction, which can support projects aimed at lowering distribution friction and improving ingredient resilience for snack portfolios. India also stands out for deal-led scaling, as multinational and investor attention has focused on large local snack platforms such as Haldiram and Balaji Wafers, pointing to an active route to expand distribution reach and local flavor credentials without building brands from scratch.
Recent Industry Developments in Asia-Pacific Snack Food Market
- July 2026: Nestlé: Thailand BOI approved Nestlé (Thai) Co., Ltd. USD 688 million investment for a new smart factory and distribution center in Samut Prakan scheduled to start 2028. The launch expands regional snack and beverage production capabilities and strengthens local distribution for Southeast Asia.
- July 2026: Suntory PepsiCo: Inaugurated a new 300 million plant in Tay Ninh, Vietnam with 1.24 billion liters annual capacity. The capacity expansion strengthens the regional manufacturing footprint and product availability for Southeast Asia snack and beverage portfolio, supporting local-market localization.
- May 2026: PepsiCo: PepsiCo India announced planned investment of Rs 5,700 crore (~$680 million) by 2030 to expand manufacturing capacity including food plants in Assam and Tamil Nadu. The expansion enhances snack and beverage manufacturing footprint in India and may ripple through regional supply chains and product availability.
Asia-Pacific Snack Food Market Report Scope and Research Methodology
Market Definition and Coverage
For this methodology, the Asia-Pacific snack food market is defined as the retail and on-trade value of packaged snack foods consumed between meals, measured at selling prices in the region and reported in USD.
Scope exclusions: We exclude fresh unpackaged foods and home-prepared snacks that do not pass through organized branded or private label channels.
Segments Covered in This Report
- By Product Type
- Frozen Snacks
- Savory Snacks
- Fruit Snacks
- Confectionery Snacks
- Bakery Snacks
- Meat Snacks
- Other Types
- By Category
- Conventional
- Organic/Clean-Label
- By Packaging Type
- Bags/Pouches
- Jars
- Cans
- Others
- By Distribution Channel
- Supermarkets/Hypermarkets
- Convenience Stores
- Online Retail Stores
- Other Distribution Channels
- By Country
- China
- India
- Japan
- South Korea
- Australia
- Indonesia
- Thailand
- Vietnam
- Philippines
- Malaysia
- Singapore
- New Zealand
- Rest of Asia-Pacific
Data Sources, Market Sizing, and Validation
Desk Research
We start with desk research to map the demand pool and the pricing environment across Asia-Pacific before the model is built. Public sources help us anchor population and income trends, packaged food consumption context, and trade flows that can move supply and pricing.
Common inputs include official statistics and cross-country data such as the World Bank, UN Comtrade, and national statistics offices in key markets, followed by food regulator and standards bodies where labeling and permissible ingredients affect category definitions. We also review peer-reviewed nutrition and food science journals for reformulation signals, and trade association releases that discuss packaged food volumes and channel shifts. Alongside this, we use company annual reports, investor presentations, and reputable business press, and we selectively reference paid subscriptions for company financials, news and financials, patent databases, and shipment-level import export checks where they help validate directional trends. This list is illustrative only, and many other sources were also used for data collection, cross-checks, and clarification.
Primary Interviews and Surveys
Primary work is used to validate what snack categories are counted consistently across countries, and to pressure-test pricing and channel assumptions that desk sources do not explain clearly. We speak with regional and country-level stakeholders across manufacturing, distribution, retail, and category management so gaps on volume mix, promotion intensity, and packaging shifts can be resolved.
To keep assumptions realistic, inputs are checked across major consumption hubs and fast-growing markets in Asia-Pacific, then reconciled back to what is visible in public financial disclosures and trade statistics.
Distribution of primary research fieldwork respondents
| Company type | Respondent position |
|---|---|
| Top tier: 27% | CXOs: 18% |
| Mid tier: 53% | Functional/Unit leaders: 22% |
| Smaller Players: 20% | Managers: 60% |
Market-Sizing & Forecasting
Sizing starts with a top-down build where country-level snack spending patterns are reconstructed from packaged food consumption context and channel development, then rolled up to the regional total. Once the demand pool is formed, we corroborate results with selective bottom-up approximations, such as sampled price points by pack size across major channels, supplier and distributor sense checks on category shares, and volume-to-value conversions for the most visible snack types.
Key inputs used in the model include category mix shifts between savory and sweet snacks, average pack size and multipack adoption, price per kilogram movement linked to ingredients and packaging, modern trade versus traditional trade share changes, and the pace of e-commerce penetration in snacks. Forecasts are built using scenario analysis so commodity cost spikes, major policy moves on sugar or salt, and currency swings can be reflected without forcing one straight-line outcome. Where direct bottom-up signals are thin for smaller countries, we bridge gaps using per-capita spend ranges and channel maturity proxies that were validated in interviews, then re-check the resulting totals for plausibility.
Data Validation & Update Cycle
We validate outputs by triangulating the model against independent signals, such as category growth reported by large retailers, public company revenue trends, and trade movement for snack-linked inputs where relevant. When results show sharp jumps, we revisit the assumptions behind pricing, mix, or channel weights, followed by another review pass so the story and the math stay aligned.
Before sign-off, the work is reviewed in multiple steps, including variance checks across countries and a reasonableness scan versus prior years. Reports are refreshed annually, and interim updates are made when material events change demand, pricing, or channel access. Right before delivery, an analyst completes a final update sweep so clients receive the latest view available.
Mordor Intelligence's Asia Pacific Snack Food Market Size Measured Against Other Published Estimates
Published market sizes for Asia-Pacific snack foods often do not match because groups define what counts as a snack differently, and they may not use the same selling-price level or channel coverage. Differences also show up when base years shift, when currency conversion timing is not aligned, and when inflation is treated as a simple uplift rather than tied to pack size and promotion behavior.
In this study, a major driver is whether adjacent categories like confectionery-heavy "snacking" baskets are blended into the total, and whether values are taken at retail selling prices versus ex-factory revenue. Another source of spread is the way price growth is modeled, since using a single regional inflation rate can miss the reality of pack downtrading and higher promotional intensity in some countries. We address this through country-level checks and interview validation before numbers are finalized, which is applied by Mordor Intelligence.
Benchmark comparison
| Source | Market Size | Gaps in Research Methodology |
|---|---|---|
| Mordor Intelligence | USD 89.54 B (2025) | |
| Trade Journal A | USD 160.00 B (2024) | Uses a broader "snacking" basket that can fold in confectionery and ice cream, and it is typically stated as retail value for a different base year without a clear country roll-up logic. |
| Regional Consultancy B | USD 224.52 B (2025) | Appears to apply wide product inclusion and a smoother regional price progression, which can overstate value when pack-size downtrading and promotion intensity differ sharply by country. |
The comparison shows that the gap is mainly explained by category boundaries and by how retail values are converted and forecast across many currencies and channels. By keeping inclusions tight to snack foods and by checking price and mix assumptions at the country level, the final number stays traceable to inputs that can be repeated and re-validated each year.
Key Questions Answered in the Report
What is the current size of the Asia-Pacific snack food market?
The market is valued at USD 96.81 billion in 2026 and is on track to hit USD 142.86 billion by 2031.
Which product segment is growing fastest across the region?
Frozen snacks lead with a projected 9.16% CAGR, supported by better cold-chain capacity and meal-replacement demand.
How significant is online retail for snack sales?
Online channels account for a rising share, expanding at a 9.08% CAGR due to social commerce platforms like TikTok Shop.
Which country offers the highest growth potential?
India is forecast to expand at 9.31% CAGR, driven by rising incomes, urbanization, and digital commerce adoption.