
Market Overview
| Study Period | 2020 - 2031 |
|---|---|
| Forecast Data Period | 2026 - 2031 |
| Base Year Market Size (2025) | USD 15.54 Billion |
| Market Size (2026) | USD 18.15 Billion |
| Market Size (2031) | USD 39.43 Billion |
| Growth Rate (2026 - 2031) | 16.78 % |
| Market Concentration | Medium |
Major Players *Disclaimer: Major Players sorted in no particular order Image © Mordor Intelligence. Reuse requires attribution under CC BY 4.0. | |
Asia-Pacific Service Robots Market Analysis by Mordor Intelligence
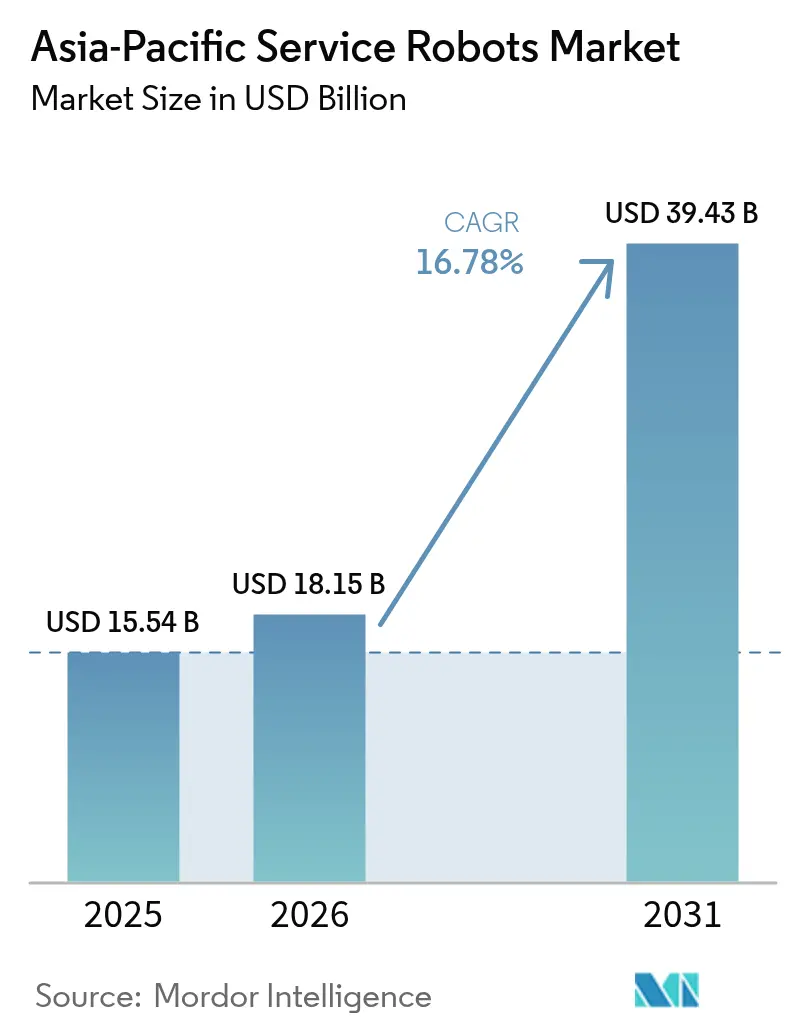
Asia Pacific Service Robots Market size market size in 2026 is estimated at USD 18.15 billion, growing from 2025 value of USD 15.54 billion with 2031 projections showing USD 39.43 billion, growing at 16.78% CAGR over 2026-2031. A surge in automation programs across China, Japan and South Korea is redefining workforce strategies, while e-commerce, healthcare modernization and government-backed digital agendas accelerate adoption. Logistics automation is no longer an efficiency playit has become an operational necessity as tight labor markets and last-mile delivery pressures intensify. Healthcare providers now treat robots as core clinical assets that improve patient outcomes and relieve staff shortages. Convergence of 5G and on-board AI is enabling real-time remote control and data analytics, broadening deployment options into public services and critical infrastructure inspection. Although high integration costs and fragmented safety standards still temper uptake among SMEs, Robotics-as-a-Service models are starting to close the affordability gap.
Key Report Takeaways
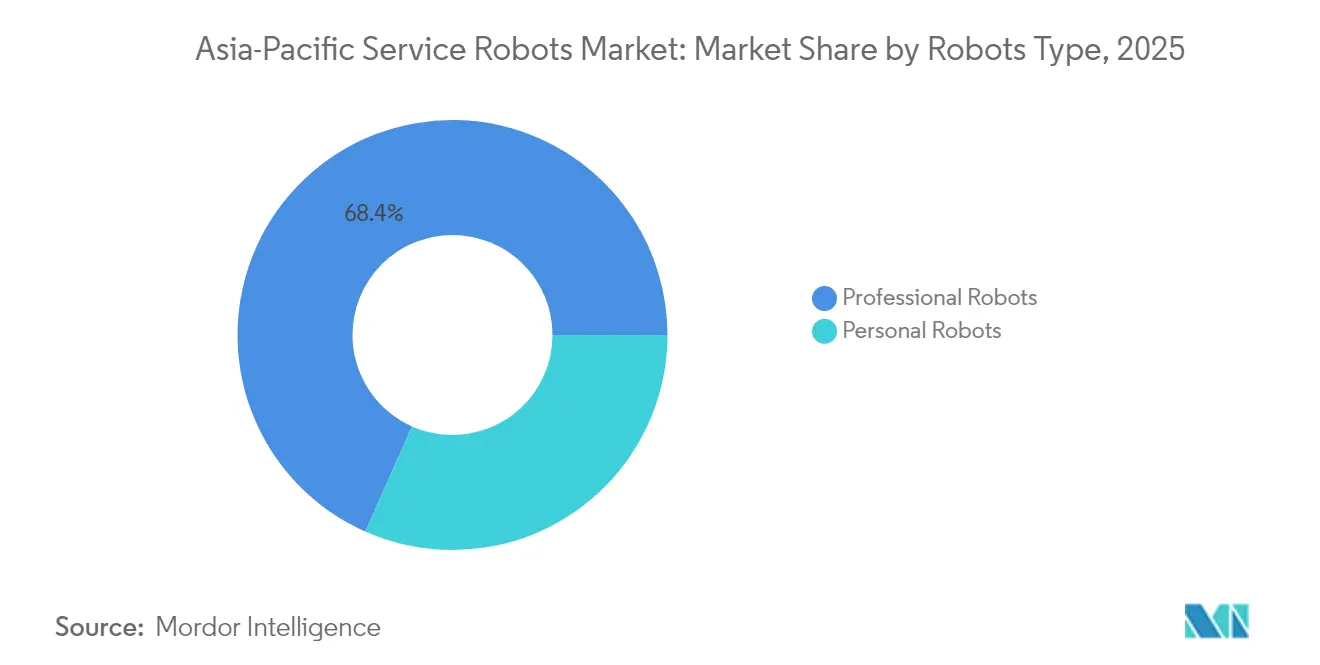
- By robots type, professional robots led with 68.35% of Asia Pacific Service Robots market share in 2025, while personal robots are projected to rise at a 18.02% CAGR through 2031.
- By application, transportation and logistics held 37.40% revenue share in 2025; healthcare is expected to grow at a 22.10% CAGR to 2031.
- By component, hardware accounted for 63.20% share of the Asia Pacific Service Robots market size in 2025, but software is poised to expand at 18.70% CAGR through 2031.
- By operating environment, ground robots dominated with 71.30% share in 2025, whereas aerial platforms are set to register 18.95% CAGR to 2031.
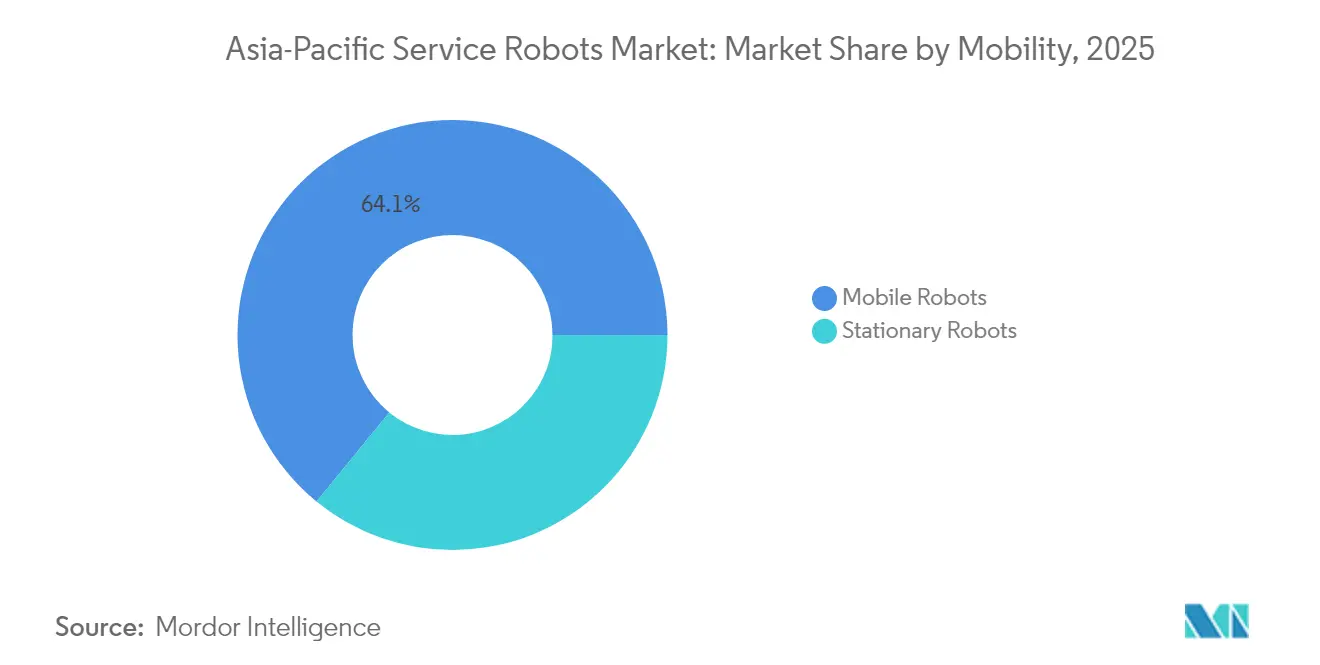
- By mobility, mobile robots captured 64.10% share of the Asia Pacific Service Robots market size in 2025 and remain the fastest-growing mobility class at 16.95% CAGR to 2031.
- By geography, China contributed 53.40% share in 2025; India is forecast to grow at 18.20% CAGR through 2031.
Note: Market size and forecast figures in this report are generated using Mordor Intelligence’s proprietary estimation framework, updated with the latest available data and insights as of 2026.
Asia-Pacific Service Robots Market Trends and Insights
Drivers Impact Analysis*
| Driver | (~) % Impact on CAGR Forecast | Geographic Relevance | Impact Timeline |
|---|---|---|---|
| E-commerce boom driving logistics AMRs | +3.2% | China, Japan, South Korea with spillover to Southeast Asia | Short term (≤ 2 years) |
| Aging-population healthcare demand | +2.8% | Japan, South Korea, China, with emerging impact in Singapore | Medium term (2-4 years) |
| Government incentives and Made-in-APAC programs | +1.9% | China, South Korea, Japan with policy coordination across APAC | Medium term (2-4 years) |
| 5G/AI convergence enabling remote autonomy | +1.5% | South Korea, China, Japan with infrastructure-dependent rollout | Long term (≥ 4 years) |
| Humanoid robots for EV-battery lines | +1.2% | China, South Korea with automotive manufacturing concentration | Medium term (2-4 years) |
| Infrastructure-inspection robots for aging assets | +0.8% | Japan, South Korea with expansion to mature APAC economies | Long term (≥ 4 years) |
| Source: Mordor Intelligence | |||
E-commerce boom driving logistics AMRs
Rising online retail volumes across Asia have pushed warehouse operators toward autonomous mobile robots (AMRs) that shrink fulfillment times and mitigate labor shortages. Chinese vendor Syrius Robotics plans to ship 3,000 AMRs annually to Japanese sites—10 times its current run-rate—as local overtime caps restrict driver availability.[1] Localized manufacturing by Libiao Robotics further illustrates how near-shore production sidesteps supply-chain friction and import duties. Payback periods now average under 2.5 years, making AMRs a viable option for mid-sized distributors. Regulatory changes therefore act as a demand catalyst, turning AMRs into essential infrastructure within the Asia Pacific Service Robots Market.
Aging-population healthcare demand
Japan’s share of citizens aged 65+ reached 27.3% in 2025, prompting hospitals and care homes to deploy robots for patient lifting, diaper changing and medication logistics. The AIREC caregiving robot from Waseda University showcases advanced physical assistance that surpasses basic monitoring.[2] Robot integration has cut staff turnover and freed personnel for empathy-intensive tasks, while automated meal transport yields EUR 9,596 (USD 10,356) in annual savings per clinic.[3] China’s new international standard for elderly-care robots positions domestic suppliers for leadership in global applications, accelerating the Asia-Pacific service robots market toward healthcare value creation.
Government incentives and Made-in-Asia Pacific programs
Beijing’s CNY 1 trillion (USD 138 billion) state fund and MIIT’s humanoid-robot guidelines target mass production by 2025. Parallel initiatives in South Korea, such as the USD 2.53 billion Super Gap Industry Program, offer low-interest financing to robotics start-ups. These capital injections shorten development cycles, encourage local sourcing and expand the overall Asia-Pacific Service Robots Market.
5G/AI convergence enabling remote autonomy
China Mobile and Huawei’s Kuafu humanoid leverages 5G-Advanced for centimeter-level positioning and edge AI, illustrating how ultra-low latency unlocks true tele-operation. NTT DATA’s factory-inspection trials using the IOWN All-Photonics Network showed real-time video analytics without degradation, achieving latency targets impossible on legacy Wi-Fi. As networks mature, remote inspection, maintenance and public-service deployments are expected to proliferate across the Asia Pacific Service Robots Market.
Restraints Impact Analysis*
| Restraint | (~) % Impact on CAGR Forecast | Geographic Relevance | Impact Timeline |
|---|---|---|---|
| High installation and integration cost | -2.1% | APAC-wide with acute impact on SMEs in emerging markets | Short term (≤ 2 years) |
| Fragmented safety/certification regimes | -1.4% | Cross-border operations across APAC regulatory jurisdictions | Medium term (2-4 years) |
| Data-privacy and cyber-security concerns | -0.9% | China, South Korea, Japan with consumer-facing applications | Medium term (2-4 years) |
| Import dependence on precision actuators and sensors | -0.7% | China, India, Southeast Asia with supply chain vulnerabilities | Long term (≥ 4 years) |
| Source: Mordor Intelligence | |||
High installation and integration cost
Although hardware prices keep falling—the average humanoid is projected to reach USD 20,000-30,000 in 2025—total integration outlays often run two to three times the purchase cost due to site retrofits and staff training. For many SMEs, capital constraints delay adoption in the Asia Pacific Service Robots market. RaaS vendors now offer subscription models covering maintenance and updates, helping customers bypass large upfront expense.
Fragmented safety/certification regimes
Inconsistent rules raise compliance costs and time-to-market. South Korea’s privacy probe into Roborock vacuums points to divergent data-protection standards that force manufacturers into country-by-country redesigns. Shanghai’s humanoid-robot emergency-response guidelines may conflict with Japan’s ISO draft revisions, complicating cross-border scaling in the Asia Pacific Service Robots Market.
*Our forecasts treat driver/restraint impacts as directional, not additive. The impact forecasts reflect baseline growth, mix effects, and variable interactions.
Segment Analysis
By Robots Type: Professional Robots Drive Industrial Transformation
Professional robots generated the bulk of 2025 revenues, holding 68.35% of Asia Pacific Service Robots market share. Their leadership rests on tangible ROI: AMR fleets cut picking time by 50% while powered exoskeletons reduce workplace injuries. Logistics systems remain the highest-revenue subsegment, propelled by omnichannel retail and same-day delivery obligations. Medical robots command premium prices for surgical precision and hospital logistics, whereas exoskeletons address lifting and fatigue issues on assembly lines. Public-relation robots offer concierge services in hospitality but adoption is moderated by cultural acceptance and language nuance.
Personal robots are scaling quickly, posting a 18.02% CAGR forecast through 2031. Domestic cleaning units lead shipments, illustrated by Ecovacs hitting RMB 16.54 billion (USD 2.3 billion) in 2024 revenue despite margin pressure. Elderly-care companions and wearable assistance devices promise the next leg of growth as aging societies drive demand. Entertainment models—pet-inspired bots and STEM education kits—round out the segment, enhancing long-tail sales across the Asia Pacific Service Robots Market.

By Component: Software Drives Intelligence Revolution
Hardware captured 63.20% of 2025 revenue. Actuators remain the costliest element as torque density advances, and sensor fusion raises ASPs for LiDAR and depth cameras. Johnson Electric reported double-digit Asian growth in motion systems linked to robotics demand.
Software is cementing its role as the value engine, set to post 18.70% CAGR to 2031. Cloud-connected orchestration, perception algorithms and fleet-management dashboards convert raw hardware into adaptable solutions. OMRON intends to surpass JPY 100 billion (USD 682 million) in data-solution sales by 2027, symbolizing the transition from product vendor to platform orchestrator. Services—maintenance, analytics, training—unlock recurring revenue in the Asia Pacific Service Robots market.
By Operating Environment: Ground Operations Dominate
Ground robots held 71.30% of 2025 revenue, buoyed by decades-old navigation algorithms and safety frameworks that assure reliable indoor mobility. Factories, hospitals and malls offer structured terrain, and battery swaps can be integrated into workflow.
Aerial robots are climbing at 18.95% CAGR. Drones equipped with AI vision survey aging bridges, reducing manual inspections by up to 60%. Delivery pilots in dense urban corridors are gaining regulatory backing as civil-aviation bodies issue flight corridors. Marine robots, though smaller in value, show promise for offshore wind inspection and aquaculture monitoring, expanding the scope of the Asia Pacific Service Robots Market.
By Mobility: Mobile Robots Enable Flexible Operations
Mobile systems accounted for 64.10% of 2025 sales, reflecting growing customer preference for flexible automation. UBTech’s 500-unit Walker S1 order highlights demand for humanoids that can traverse multiple stations, thereby boosting utilization. Mobile fleets help SMB factories amortize costs across varied tasks.
Stationary robots remain critical for micro-precision or high-payload tasks such as lab processing or semiconductor handling. Nevertheless, mobile platforms are forecast to grow at a 16.95% CAGR, aided by improved energy density and swappable batteries that extend duty cycles in the Asia Pacific Service Robots Market.
By Application: Healthcare Leads Growth Transformation
Transportation and logistics retained a 37.40% share of the 2025 Asia Pacific Service Robots market size, supported by rising e-commerce parcels and stricter delivery windows. Warehouse AMRs improve throughput and mitigate overtime restrictions, while cross-docking robots streamline pallet movement. Defense, agriculture, and mining uses remain steady but specialized.
Healthcare is set to expand at a 22.10% CAGR to 2031. Robots now assist with surgical procedures, manage ward logistics, and interact with patients. Singapore’s Changi General Hospital operates a national lab that explores precision-medicine robots and autonomous pharmacy dispensing. Payback is measurable: one hospital saved EUR 9,596 (USD 10,356) annually on meal logistics alone. As reimbursement models shift toward outcome-based metrics, stakeholders view robots as strategic levers for quality and efficiency within the Asia Pacific Service Robots Market.
Geography Analysis
China secured 53.40% of 2025 revenues in the Asia Pacific Service Robots Market, underpinned by more than 190,000 valid patents and vertically integrated supply chains. The 14th Five-Year Plan and a nearly CNY 1 trillion (USD 138 billion) investment pool assure sustained leadership to 2030. City-level clusters in Shenzhen and Hangzhou offer subsidies for AI algorithms and sensor fabs, thereby keeping BOM costs low and speeding up the time-to-market.
India is projected to be the fastest-growing geography at 18.20% CAGR. Smart-factory incentives, healthcare modernization, and digital-public-infrastructure roll-outs create greenfield opportunities for service robots. Strong software talent allows local firms to specialize in autonomy stacks while importing hardware, accelerating time-to-deployment within the Asia Pacific Service Robots Market.
Japan and South Korea maintain robust positions. Japan’s USD 300 million care-robot program ensures continuous demand, as its rapidly aging society prioritizes eldercare solutions. South Korea’s Fourth Intelligent Robot Basic Plan allocates USD 2.24 billion to push service-robot adoption in manufacturing and daily life. Elsewhere, Singapore’s smart-hospital pilots and Southeast Asia’s manufacturing diversification offer incremental volume growth as cost curves fall.
Regulatory Landscape
Across Asia-Pacific, service-robot compliance is increasingly shaped by cybersecurity, data governance, and device-level certification, which is tightening guardrails while also creating cross-border friction. In China, the State Administration for Market Regulation (SAMR) issued GB/T 45502-2025 on information security requirements for service robots, with an implementation date of October 1, 2025, reinforcing security-by-design for connected robots used in homes, hospitals, and public facilities. India added regulatory momentum in July 2026 when MeitY released a draft framework for humanoid robot deployment that references Bureau of Indian Standards (BIS) certification and local data-storage requirements for sensor-rich systems. South Korea also raised expectations for high-impact AI systems used in healthcare and public infrastructure as the AI Basic Act became effective in March 2026.
Market access is further affected by communications and safety conformity requirements that vary by country. Thailand’s NBTC issued a May 2026 notification requiring standards inspection and certification for radio communication equipment used in multipurpose mobile robots, increasing the value of pre-certified modules and local testing partners for multi-market deployments. South Korea’s Act on the Development and Supply of Intelligent Robots (with KIRIA-authorized safety testing bodies) highlights how national conformity assessment pathways can speed domestic rollouts, while Singapore’s IMDA continues to push practical AI governance through the AI Verify toolkit, which supports buyers that need structured risk and assurance processes for customer-facing robots.
Value Chain Analysis
The Asia-Pacific service-robot value chain runs from upstream electromechanical components (actuators, reducers, motors, sensors, batteries, and compute) to midstream robot OEMs and software platforms (navigation, perception, fleet orchestration, and cybersecurity), and then to downstream integrators and operators in logistics, healthcare, hospitality, and public services. Component availability and qualification cycles remain decisive. Premium motion-control and drivetrain parts, including reducers, servo drives, and precision actuation, can extend integration timelines, and the market continues to rely on established suppliers for high-precision elements used in mobile and humanoid form factors.
Regional supply dynamics reflect both manufacturing centrality and localization gaps. China remains a central base for many robot builders and subcomponents, while South Korea has highlighted dependencies for core materials and imported drive components, pushing OEMs and conglomerates toward localization and second-sourcing strategies. Downstream, value capture is shifting toward software-defined capabilities (fleet management, analytics, and remote operations) and lifecycle services, which also aligns with Robotics-as-a-Service models that bundle deployment, maintenance, and updates to reduce upfront integration hurdles for enterprises.
Competitive Landscape
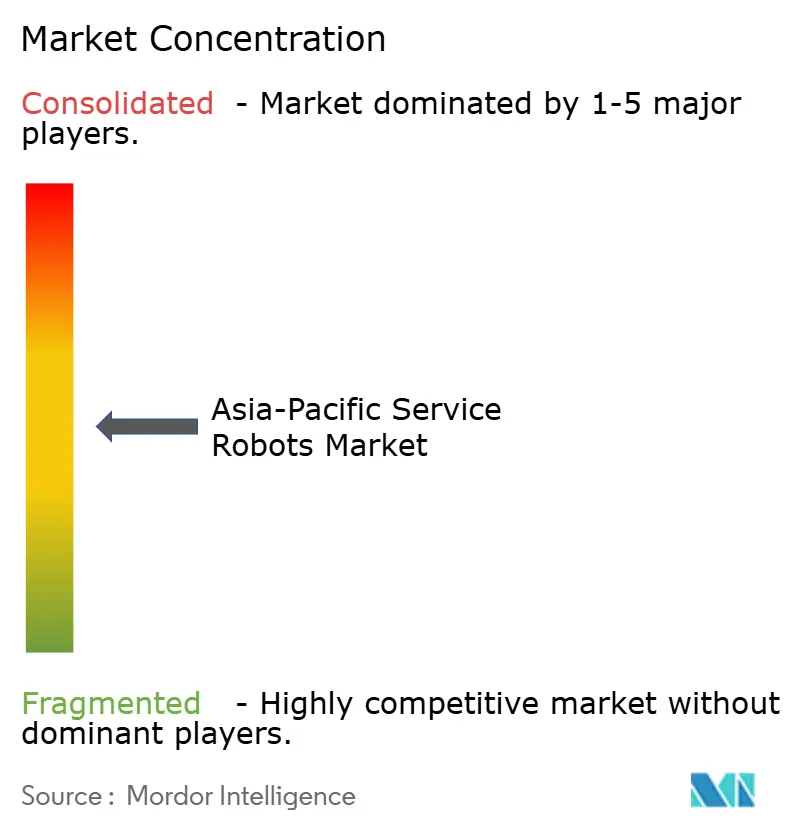
Competition is moderating yet gradually concentrating around end-to-end platforms. Chinese leaders such as UBTech, Ecovacs and SIASUN exploit supply-chain depth to release frequent model updates at competitive price points. Japanese and South Korean incumbents focus on precision mechatronics and human-robot interaction, while multinationals such as Panasonic and Omron bundle robots with legacy factory automation suites.
Strategically, vendors pursue vertical integration—combining hardware, AI software and cloud services—to lock users into ecosystems and capture lifecycle revenue. Robotics-as-a-Service subscriptions are widening addressable markets by converting capex to opex, particularly appealing to SMEs wary of high upfront costs in the Asia Pacific Service Robots Market.
Patent activity centers on vision-based grasping and edge-AI optimization. UBTech filed 59 U.S. patents over a five-year period, mapping out intellectual property defenses for its Walker platform. Companies without deep IP portfolios partner for sensor or AI modules, accelerating time-to-market but risking margin erosion.
Asia-Pacific Service Robots Industry Leaders
-
LG Electronics Inc.
-
UBTECH Robotics Inc.
-
Milagrow HumanTech
-
Hyundai Robotics Co. Ltd.
-
Hanwha Robotics
- *Disclaimer: Major Players sorted in no particular order
Market Opportunities and Future Outlook
Named, government-led programs are expanding near-term commercial pathways for service robots in multi-tenant environments where interoperability, safety, and operational governance are required. In Singapore, IMDA launched a multi-operator robot testbed at Punggol Digital District in May 2026, with participants including Certis, DHL, Grab, and QuikBot, creating a venue for validating mixed-vendor deployments across security, delivery, and facilities operations. IMDA also initiated a program in November 2025 to support 500 enterprises adopting autonomous robots across manufacturing, logistics, hospitality, and food services, creating a pipeline from pilots to scaled procurement and providing a reference base for vendors and integrators.
Another opportunity area is the shift from task-specific automation toward Physical AI programs that depend on data infrastructure, component sovereignty, and deployable humanoid or mobile platforms in unstructured settings. South Korea elevated Physical AI and AI robots as a national strategic industry under its June 2026 mega-project agenda, and in July 2026 it highlighted nationwide data factories for robot training data alongside dedicated R&D to localize actuators and sensors. That direction tends to favor suppliers that can provide compliant data pipelines and locally sourced critical parts. Taiwan’s March 2026 four-year smart service robot roadmap, focused on environment-aware systems to address labor shortages, also creates whitespace for vendors that package perception, safety, and operations tooling into deployable solutions for public services, healthcare, and logistics operators.
Recent Industry Developments
- June 2026: UBTECH launched the UWORLD U1 series of full-size ultra-bionic humanoid robots and disclosed cumulative orders as of launch day. The launch reinforces a shift from prototypes to scalable, order-backed production, supporting deployments that require standardized platforms and repeatable supply for enterprise buyers in Asia-Pacific.
- July 2025: Foxconn and Kawasaki began trials of a medical-service robot in Taiwan hospitals, pairing Foxconn manufacturing scale with Kawasaki robotics know-how. Hospital trials help validate workflows, safety, and integration requirements that can shorten procurement cycles for healthcare logistics and patient-facing service robots.
- April 2025: Dongfeng Motor partnered with UBTech to deploy Walker S humanoid robots for seat-belt inspection and door-lock testing in final quality checks. The deployment expands humanoids from demonstrations into repetitive inspection tasks, strengthening the business case for multi-station mobile robots in discrete manufacturing environments.
Research Methodology Framework and Report Scope
Market Definition and Coverage
For this study, the Asia-Pacific service robots market is defined as revenue generated from robots used to perform services for people or organizations, covering both professional and personal use, across Asia-Pacific countries.
Scope exclusions: We exclude industrial factory automation robots and count only service-oriented robot systems and related components sold into end-use applications within Asia-Pacific.
Segmentation Overview
- By Robots Type
- Professional Robots
- Logistic Systems
- Medical Robots
- Powered Human Exoskeletons
- Public-Relation Robots
- Personal Robots
- Domestic
- Entertainment
- Elderly and Handicap Assistance
- Professional Robots
- By Application
- Military and Defense
- Agriculture, Construction and Mining
- Transportation and Logistics
- Healthcare
- Government
- Other Applications
- By Component
- Hardware
- Actuators
- Sensors
- Controllers
- Software
- Services
- Hardware
- By Operating Environment
- Ground
- Aerial
- Marine
- By Mobility
- Mobile Robots
- Stationary Robots
- By Country
- China
- India
- Japan
- South Korea
- Rest of Asia-Pacific
Data Sources, Market Sizing, and Validation
Desk Research
Desk research was used to build the starting structure of the market and to anchor basic inputs that are harder to validate through interviews alone. We relied on public, non-paywalled references such as the International Federation of Robotics (IFR) releases, World Bank macro indicators, UN Comtrade trade statistics, national statistics offices in major Asia-Pacific economies, and published procurement or regulatory notices where relevant.
In parallel, we reviewed company filings and investor presentations, association websites, and credible press coverage to track product launches, pricing signals, and adoption timelines. Where public reporting was thin for private participants, paid database subscriptions for company financials and intelligence, patents, and shipment-level trade tracking were used selectively to cross-check directional trends. These desk sources are illustrative and not exhaustive, and other references were added for data collection, validation, and research clarification.
Primary Interviews and Surveys
Primary interviews and surveys were run to pressure-test the desk assumptions and to fill gaps on average selling prices, mix shifts, and country-level demand patterns. We spoke with robot OEM channels, component suppliers, system integrators, large end users, and domain specialists across Asia-Pacific so model inputs could be reconciled to what is actually being bought and deployed.
The fieldwork also clarified which applications are expanding fastest and how buying cycles differ across markets, which then informed the forecast assumptions used in the model.
Distribution of primary research fieldwork respondents
| Company type | Respondent position |
|---|---|
| Top tier: 31% | CXOs: 16% |
| Mid tier: 53% | Functional/Unit leaders: 24% |
| Smaller Players: 16% | Managers: 60% |
Market-Sizing & Forecasting
The market was sized using a top-down and bottom-up approach, where the demand pool is reconstructed from application adoption in Asia-Pacific and then translated into value through price and mix assumptions. The top-down side was built by mapping service robot penetration across key applications (such as logistics, healthcare, defense, and agriculture) and then linking it to country activity indicators that explain deployment trajectories.
To keep totals realistic, we used selective bottom-up approximations as cross-checks, including sampled ASP multiplied by implied unit volumes for major application clusters, and supplier and channel checks to sanity-test the scale. When a country or sub-application had limited visibility, we used proxy indicators (for example, related equipment spending, trade flows for relevant robot components, and observed adoption in peer markets) and then adjusted after expert feedback.
Key model inputs included application-level adoption rates, country industrial and services activity, import and export signals for robot-related equipment, typical ASP ranges by robot type, and the mix shift between professional and personal robots. Forecasting relied on scenario analysis supported by simple time-series smoothing, with ASP progression, deployment intensity, and mix validated with primary respondents before the final run.
Data Validation & Update Cycle
Outputs were validated through multiple checks so unusual jumps could be challenged before sign-off. We compared calculated market values against independent signals such as adoption commentary from end users, country demand indicators, and trade and shipment directionality, then reviewed large variances at the country and application level.
A second analyst review was used to confirm that assumptions stay consistent across the model, and follow-up outreach was triggered when price, mix, or growth rates moved outside expected ranges. Reports are refreshed annually, and interim updates are made when material events occur that can change pricing, supply availability, or adoption. Before delivery, a final review pass is completed so clients receive the most current view available.
Mordor Intelligence's Asia Pacific Service Robots Market Market Sizing Compared With Other Published Estimates
Published market sizes for service robots in Asia-Pacific often differ because each publisher uses a different cut of robot types, a different pricing basis, and a different year and currency timing for converting local revenues into USD. Variations also come from whether the study counts broader service categories or only hardware units, which changes value even when deployment volumes appear similar.
In refresh-led comparisons, the main gap typically comes from how ASPs are updated and validated across fast-moving robot categories, and whether price erosion or feature-driven upgrades are reflected year by year. Currency conversion month, and the way professional versus personal robot mix is treated, can further widen the spread, especially when country growth rates are uneven. This is why the refresh cadence and variance checks built into Mordor Intelligence help keep the estimate aligned with recent pricing signals and validated adoption patterns.
Benchmark comparison
| Source | Market Size | Gaps in Research Methodology |
|---|---|---|
| Mordor Intelligence | USD 15.54 B (2025) | |
| Regional Consultancy A | USD 24.29 B (2024) | Uses an earlier base year and a broader service robotics framing that can pull in adjacent categories and different price points, and the USD conversion timing may not match a single standardized refresh window. |
| Global Consultancy B | USD 23.25 B (2025) | Often relies on long-horizon regional splits from a global model, where Asia-Pacific is allocated using high-level shares and longer-cycle ASP assumptions, which can overstate near-term value when mix and pricing are changing quickly. |
Across the three figures, the spread is mainly explained by timing and price mechanics rather than a single demand driver. When scope boundaries are kept consistent, and the ASP and currency assumptions are refreshed and cross-checked against application adoption signals, the resulting market size becomes easier to trace and repeat for planning purposes.
Key Questions Answered in the Report
What is the current value of the APAC Service Robots Market?
It stands at USD 18.15 billion in 2026 with a forecast to reach USD 39.43 billion by 2031.
Which segment grows fastest within the market?
Healthcare applications are projected to expand at a 22.10% CAGR during 2026-2031.
How significant are mobile robots?
Mobile platforms hold 64.10% of 2025 revenue and are expected to grow 16.95% CAGR during 2026-2031 as factories seek flexible automation.
Why is India a focus geography?
India’s 18.20% CAGR stems from smart-factory incentives, healthcare modernization and strong software capabilities during 2026-2031.
What is driving software revenues?
Fleet-management, perception AI and cloud orchestration are pushing software growth at 18.70% CAGR during 2026-2031, overtaking hardware as the key value layer.
How do 5G networks affect robot deployment?
5G-Advanced provides ultra-low latency, enabling real-time remote operation and expanding use cases in inspection and public services.