
Market Overview
| Study Period | 2020 - 2031 |
|---|---|
| Forecast Data Period | 2026 - 2031 |
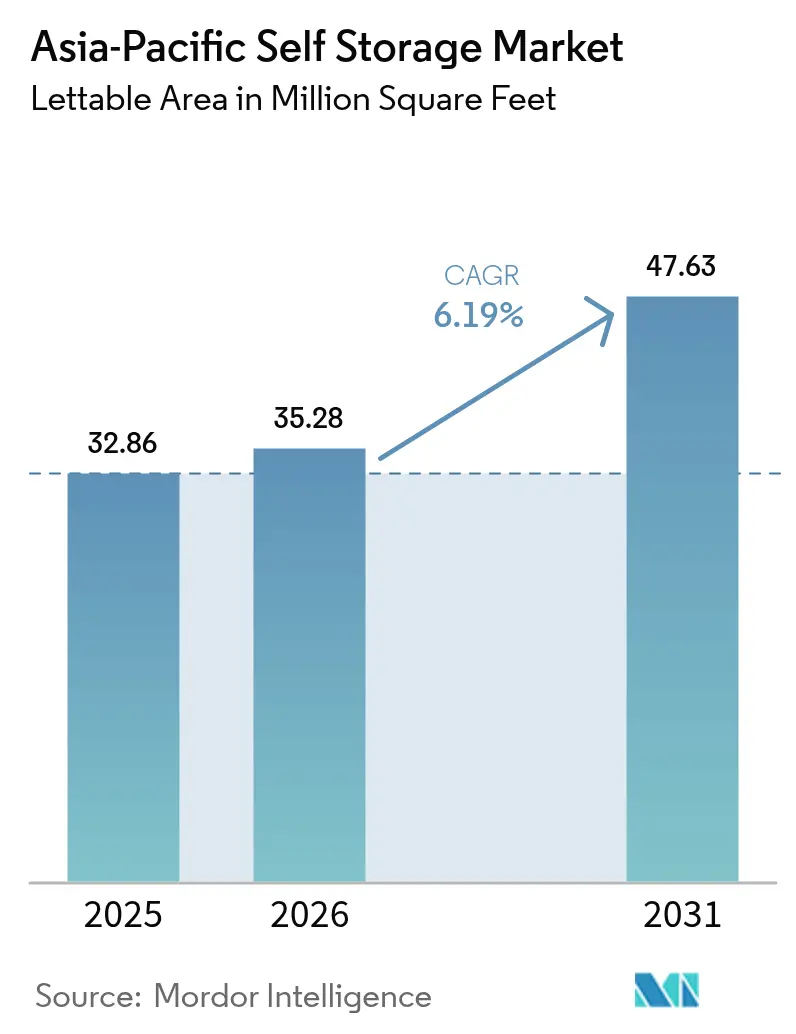
| Base Year Market Size (2025) | 32.86 Million square feet |
| Market Volume (2026) | 35.28 Million square feet |
| Market Volume (2031) | 47.63 Million square feet |
| Growth Rate (2026 - 2031) | 6.19 % |
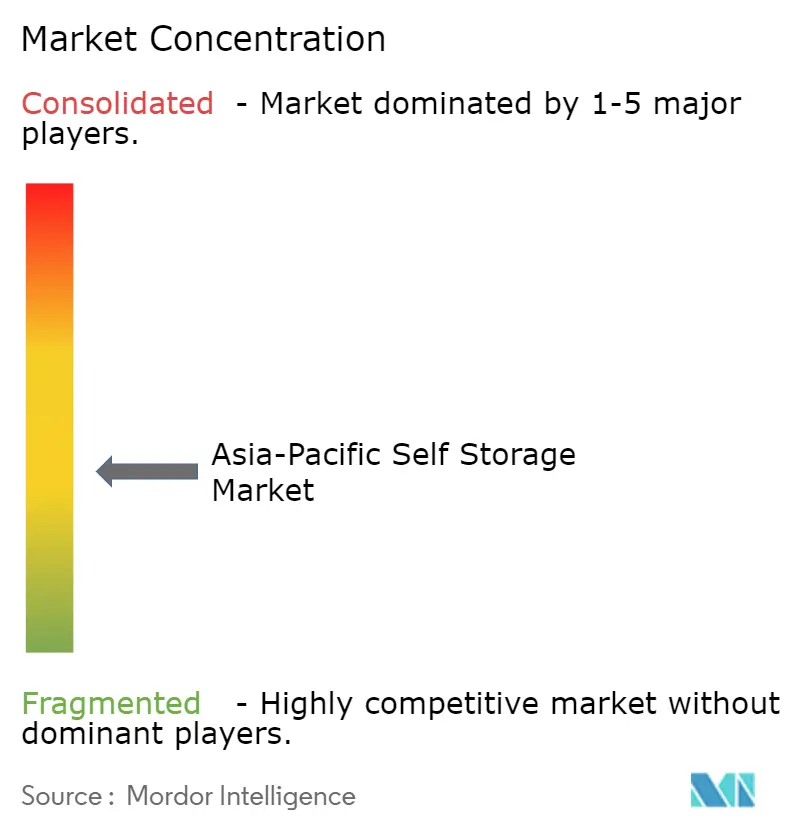
| Market Concentration | Medium |
Major Players *Disclaimer: Major Players sorted in no particular order Image © Mordor Intelligence. Reuse requires attribution under CC BY 4.0. | |
Asia-Pacific Self Storage Market Analysis by Mordor Intelligence
The Asia-Pacific self storage market size is expected to grow from 32.86 million square feet in 2025 to 35.28 million square feet in 2026 and is forecast to reach 47.63 million square feet by 2031 at 6.19% CAGR over 2026-2031. Urban households are paying record premiums for ever-smaller apartments, so they divert seasonal items, hobby equipment, and heirloom furniture into external lockers. Small-to-medium enterprises, especially cross-border online sellers, now view storage nodes near last-mile hubs as an operating expense comparable to cloud computing. Deep-pocketed investors are reshaping the competitive field by converting vacant industrial floors into managed storage suites, compressing build-times and standardizing fire-safety features. Technology adoption, from smart locks to dynamic pricing, lets operators lift revenue per square foot while trimming labor cost, a combination that attracts both household and business tenants. Structural demand combined with disciplined new supply supports resilient occupancy across gateway cities despite elevated land prices.
Key Report Takeaways
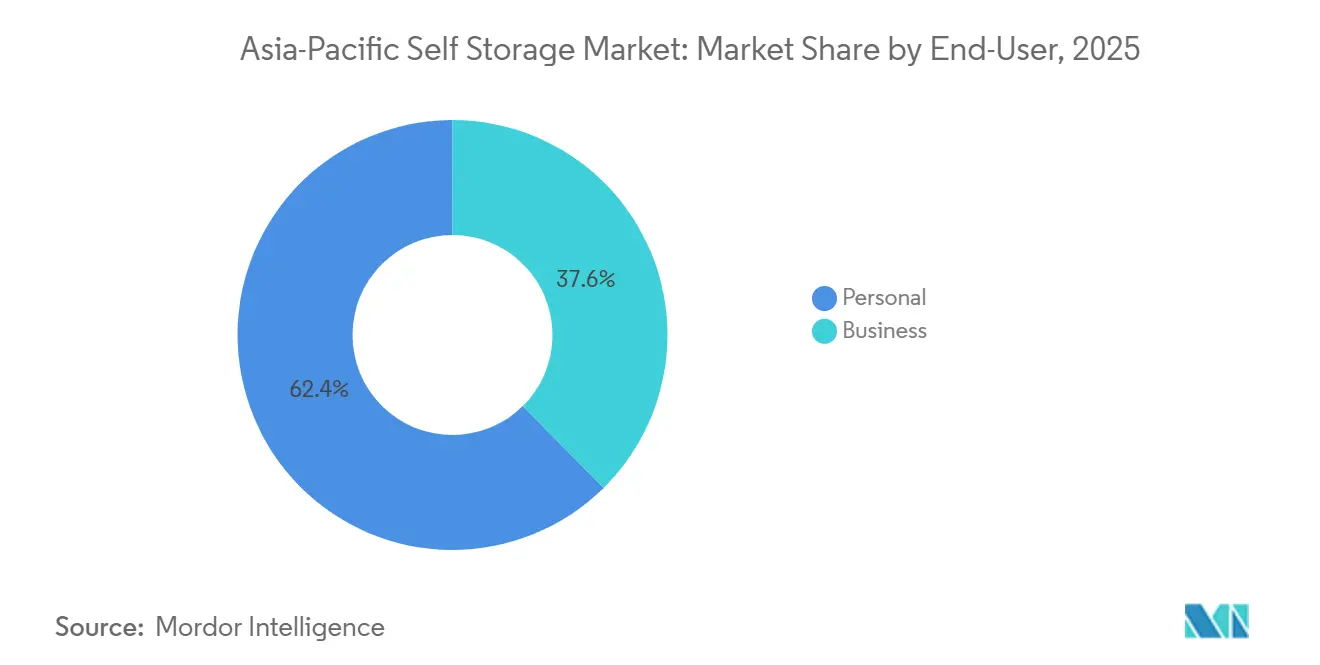
- By end user, personal customers led with 62.41% share in 2025, while the business segment is projected to expand at a 6.72% CAGR to 2031.
- By storage size, large units above 40 square feet captured 48.37% of the Asia-Pacific self storage market share in 2025, whereas small and medium units are advancing at 6.43% through 2031.
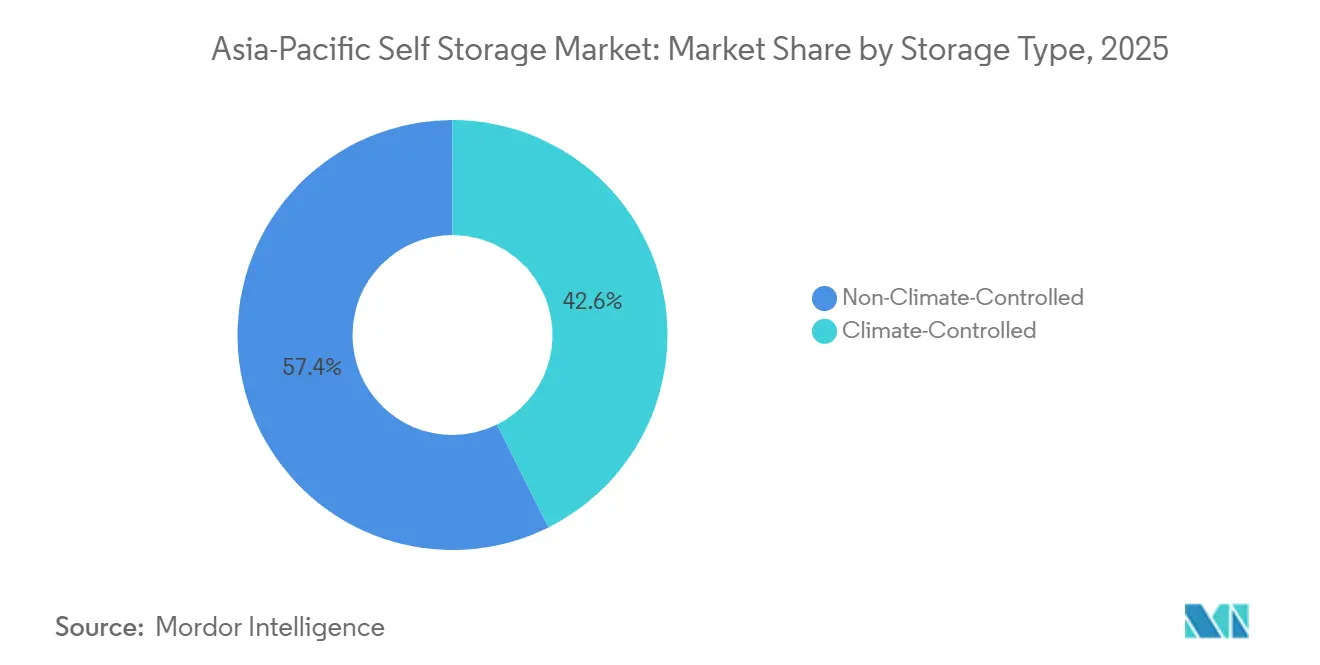
- By storage type, non-climate-controlled space held 57.36% of the Asia-Pacific self storage market size in 2025, yet climate-controlled units are forecast to grow at 7.02% CAGR between 2026-2031.
- By ownership pattern, owned facilities accounted for 55.13% of the Asia-Pacific self storage market size in 2025, but leased properties register the higher growth trajectory at 7.11% through 2031.
- By geography, Japan commanded 27.39% share in 2025, while China records the fastest forecast CAGR of 6.54% to 2031.
Note: Market size and forecast figures in this report are generated using Mordor Intelligence’s proprietary estimation framework, updated with the latest available data and insights as of 2026.
Market Trends and Insights
Drivers Impact Analysis of Asia-Pacific Self Storage Market*
| Driver | (~) % Impact on CAGR Forecast | Geographic Relevance | Impact Timeline |
|---|---|---|---|
| Densifying Urban Housing and Shrinking Apartment Sizes | +1.8% | Hong Kong, Singapore, Tokyo, Seoul, Shanghai | Long Term (≥ 4 Years) |
| Explosive Growth of SME Cross-Border E-Commerce Fulfillment | +1.5% | Singapore, Malaysia, Thailand, Vietnam, Indonesia, Philippines | Medium Term (2-4 Years) |
| Institutional Capital Flooding into Industrial-to-Storage Conversions | +1.2% | Japan, Singapore, Australia, China Tier-1 | Medium Term (2-4 Years) |
| Rise of Flexible Work and Hybrid Home-Office Setups | +0.9% | Singapore, Hong Kong, Sydney, Tokyo | Short Term (≤ 2 Years) |
| Government Incentives for Adaptive Reuse of Aging Industrial Stock | +0.7% | Singapore, Japan, China Pilot Cities | Long Term (≥ 4 Years) |
| Growing Demand for Climate-Controlled Specialty Storage | +0.6% | Singapore, Hong Kong, Japan, China, Malaysia | Medium Term (2-4 Years) |
| Source: Mordor Intelligence | |||


Densifying Urban Housing and Shrinking Apartment Sizes
Median floor areas in major Asia-Pacific cities have fallen by 10-15% over the past decade, while price-to-income multiples reached 25 in Hong Kong and 32 in Shenzhen in 2024, leaving residents with little choice but to rent off-site lockers to regain livable space.[1]JLL Research Team, “Home Attainability Index,” JLL, jll.com.sg Planning agencies continue to favor high-density towers that maximize unit counts rather than unit sizes, locking in a long-run mismatch between household belongings and apartment capacity. Developers in Tokyo and Singapore now integrate storage basements into new condominiums, banking on higher sale prices for units with bundled storage rights. As personal living quarters shrink further, demand for external lockers scales almost one-for-one, which keeps occupancy high even as new facilities open. This structural trend contributes the single largest uplift to long-term growth in the Asia-Pacific self storage market.
Explosive Growth of SME Cross-Border E-Commerce Fulfillment
Southeast Asia’s online sales reached USD 300 billion in 2025, and merchants using localized fulfillment sold up to 14 times more during flash-sales because one-day delivery boosts conversion rates. Small enterprises cannot justify multi-year warehouse leases, so they choose modular storage units with 24-hour access that scale with promotional cycles. In Vietnam, 40% of business tenants in premium facilities are cross-border sellers holding buffer stock to manage upstream volatility. Operators respond with loading docks, parcel pick-and-pack zones, and business-hour concierge services, deepening wallet share from these clients. The segment’s outperformance adds meaningful lift to the Asia-Pacific self storage market during the medium term.
Institutional Capital Flooding into Industrial-to-Storage Conversions
Brookfield Asset Management and GIC paid AUD 6.7 billion (USD 4.4 billion) for National Storage REIT in 2025, the region’s largest self-storage deal to date, proving that pension funds now view the asset class as infrastructure-like with inflation-indexed cash flows.[2]Savills Asia-Pacific Capital Markets, “Self Storage and Cold Storage Investment Report,” Savills, savills.com.sg CapitaLand Investment formed a three-party venture the same year to convert aging industrial floors in Singapore and Japan, attracted by yields that exceed new-build returns by 200-300 basis points.[3]CapitaLand Investment Relations, “Extra Space Asia Partnership Announcement,” CapitaLand, capitaland.com Singapore’s regulators lifted a moratorium on new self-storage permits in Business 1 zones, unlocking 400 000 square meters for conversion. Institutional discipline introduces uniform safety standards and enterprise-grade technology, raising entry barriers for smaller rivals and accelerating market consolidation. As more brownfield assets convert, new capacity can enter prime submarkets faster than ground-up projects, smoothing supply in the Asia-Pacific self storage market.
Rise of Flexible Work and Hybrid Home-Office Setups
Three out of four employees in Asia-Pacific still prefer hybrid arrangements, compelling households to allocate permanent desk space at home. With rooms already constrained, residents relocate seldom-used items to external lockers so that living areas double as offices. Operators now fit climate-controlled units with electrical outlets and Wi-Fi to serve freelancers who need quiet work pods. Work+Store’s Singapore facilities market premium wine vaults alongside document-secure units for legal professionals, monetizing dual-use demand. Ancillary services such as mail handling and parcel acceptance increase attachment rates, lifting revenue per square foot. Although the growth pulse is front-loaded, the hybrid model permanently lifts business-tenant penetration in the Asia-Pacific self storage market.
Restraints Impact Analysis of Asia-Pacific Self Storage Market*
| Restraint | (~) % Impact on CAGR Forecast | Geographic Relevance | Impact Timeline |
|---|---|---|---|
| Scarcity and Escalating Price of Suitable Urban Land Parcels | -1.1% | Hong Kong, Singapore, Tokyo, Sydney, Shanghai | Long Term (≥ 4 Years) |
| Patchwork Zoning, Fire-Safety and Hazardous Goods Regulations | -0.8% | Singapore, Hong Kong, Japan, China | Medium Term (2-4 Years) |
| Low Consumer Awareness and Cultural Reluctance in Emerging Markets | -0.5% | Indonesia, Philippines, Malaysia, Vietnam, Thailand (Outside Bangkok) | Long Term (≥ 4 Years) |
| Increasing Competition from On-Demand Mobile Storage and Home-Organization Tech | -0.3% | Singapore, Hong Kong, Japan, China Tier-1 Cities | Short Term (≤ 2 Years) |
| Source: Mordor Intelligence | |||
Scarcity and Escalating Price of Suitable Urban Land Parcels
Singapore’s industrial space ran 89% full in 2024, leaving bidders to pay record premiums for the few blocks that can still convert to storage, a reality that compresses rental yields below institutional return targets. Hong Kong mirrors the squeeze: three storage-suitable plots came to auction in 2024, and the winning price exceeded HKD 15,000 (USD 1,920) per square foot, a level that only breakevens when facilities hold more than 95% occupancy at rents 30% above today’s averages. Tokyo’s inner wards ban most new self-storage on residential lots, so operators chase secondary cities, but longer drive times undercut the convenience premium that anchors the Asia-Pacific self storage market. China offers larger land banks yet local planners grant priority to manufacturing parks, leaving self-storage applicants waiting months for discretionary approvals. Tighter site supply slows unit roll-outs in the priciest metros, subtracting 1.1 percentage points from baseline growth even while demand remains firm.
Patchwork Zoning, Fire-Safety and Hazardous Goods Regulations
Singapore’s Civil Defence Force Fire Code 2023 forces retrofit sprinklers, two-hour fire walls and emergency lighting, inflating build costs by roughly 20-25% over pre-2023 norms.[4]Singapore Civil Defence Force, “Fire Code 2023,” SCDF, scdf.gov.sg Hong Kong imposed similar compartment limits after the 2016 Ngau Tau Kok blaze and closed 15% of non-compliant sites, consolidating capacity yet saddling new entrants with heftier capital budgets. Japan layers national building statutes on top of prefectural rules for hazardous items, so chains that span multiple regions juggle divergent approval pathways and paperwork timelines. China fragments oversight even further, because each provincial fire bureau sets its own sprinkler density and egress standards, forcing design teams to customise blueprints city by city. These overlapping codes raise entry barriers and slow project pipelines, removing 0.8 percentage points from the Asia-Pacific self storage market’s forecast CAGR.
*Our forecasts treat driver/restraint impacts as directional, not additive. The impact forecasts reflect baseline growth, mix effects, and variable interactions.
Asia-Pacific Self Storage Market Segment Analysis
By End-User:
Business Demand Accelerates Past HouseholdsThe segment captured 62.41% of total square footage from personal users in 2025, yet business tenants are expanding at a 6.72% compound clip to 2031, outpacing households. This pivot lifts the Asia-Pacific self storage market size because cross-border sellers, field-service contractors and micro-brands now treat storage nodes as variable logistics rather than capital expenditure. Small enterprises in Vietnam cut last-mile costs by up to 20% after shifting buffer inventory into multiple lockers located within urban delivery zones. Operators segment facilities accordingly, reserving loading-dock floors for businesses and upper levels for personal users, a mix that supports stable occupancy even during retail down-cycles.
Personal customers are also evolving. Retirees moving from suburban homes into smaller condominiums now sign multi-year contracts, lengthening average tenancy and reducing churn. Younger professionals, meanwhile, treat storage as episodic capacity during job relocations or overseas study, so operators offer discount bundles that combine moving services with three-month locker rentals. Dynamic pricing tools let chains nudge tariffs higher for business users during festival-driven sales peaks while softening rates for households in lull periods. This dual-track strategy deepens revenue per square foot, sustaining the Asia-Pacific self storage market share of operators that balance both demand pools.

By Storage Size:
Modular Units Widen the Addressable BaseLarge rooms above 40 square feet commanded 48.37% of 2025 take-up, yet small and medium modules are growing faster at 6.43% a year as e-commerce merchants and gig workers favour agile footprints. Small lockers yield 40-50% higher rent per square foot than jumbo rooms, so operators subdivide legacy facilities to amplify revenue density. Box-in-box retrofits inside Hong Kong warehouses can raise total unit count by 25% without altering the external shell, an attractive tactic where land prices eclipse USD 1,900 per square foot.
E-retailers in Manila and Ho Chi Minh City report that 60% of stock turns inside 30 days, so they prefer several 20-square-foot lockers scattered near courier depots instead of one big central store. Work+Store’s 5-square-foot option in Singapore, priced at SGD 80 (USD 60) a month, now runs 90% full among downtown finance professionals who store compliance files off-site. The granular mix tempers vacancy risk because tenants can scale space up or down without total move-outs, locking in stickier cash flows that reinforce the Asia-Pacific self storage market.
By Storage Type:
Climate Control Becomes Mainstream PremiumNon-climate rooms retained 57.36% of the Asia-Pacific self storage market share in 2025, yet climate-controlled formats will grow 7.02% through 2031 as wine collectors, pharma distributors and archival firms seek stable humidity and temperature. Work+Store’s wine vaults, kept between 12-14 °C, leased 80% of capacity within three months despite a 60% rent premium, proving that affluent niches absorb higher tariffs. Singapore’s revised fire code insists on mechanical ventilation for conditioned zones, which inflates capex but also locks out under-capitalised rivals, concentrating premium demand among compliant chains.
Energy-efficient HVAC kits and solar arrays narrow the operating-cost gap between cold and ambient rooms, encouraging operators in Kuala Lumpur and Bangkok to retrofit older blocks into multi-temperature facilities. Pharmaceutical wholesalers in India use 100-square-foot conditioned cells as overflow when central cold-stores run at 70-75% saturation, a spill-over that lifts occupancy for self-storage providers. As conditioned penetration climbs, blended revenue per square foot rises, underpinning growth in the Asia-Pacific self storage industry even if ambient tariffs stay flat.
By Ownership Pattern:
Leasing Models ExpandOwned blocks still represented 55.13% of inventory in 2025, a legacy of earlier cycles when land was cheaper. Yet leased properties are scaling 7.11% annually because capital-light models help operators span multiple metros quickly, boosting the Asia-Pacific self storage market size without locking equity into dirt. CapitaLand Investment and Extra Space Asia deploy 10-15-year master leases across Singapore and Japan, converting brownfield floors into revenue within six months and capturing conversion yields 200-300 basis points richer than ground-up builds.
Leased models also hedge regulatory shifts; if zoning clamps tighten, chains can exit at term expiry rather than sit on stranded assets. In Hong Kong, early movers who bought land before 2020 now book unrealised gains near 40%, giving them cheap refinance firepower for expansion into Shenzhen or Guangzhou. Japan’s Quraz still owns two-thirds of its 67-site estate, a buffer that steadied cash flows during the 2024 slowdown, but it now experiments with leasehold conversions in regional cities to test demand before committing capital. The coexistence of both models creates portfolio optionality, enhancing resilience across the Asia-Pacific self storage market.
Geography Analysis
Japan Self Storage Market
Japan held 27.39% of the Asia-Pacific self storage market in 2025, buoyed by two decades of consumer familiarity with trunk-room concepts and zoning that allows mixed-use retrofits inside dense urban cores. Quraz’s 3 000-unit Yokohama Tsurumi facility opened in January 2025 and pushed the chain above 90% nationwide occupancy while adding fresh capacity outside saturated Tokyo wards. The Ministry of Economy, Trade and Industry backs adaptive-reuse projects that convert idle factories into storage, offering policy cover that helps operators penetrate regional cities where retirees downsize yet still need space for long-held belongings. Combined, these factors give Japan both scale and pricing power, anchoring regional revenue even as new supply filters in.
China Self Storage Market
China is the fastest-growing territory, advancing 6.54% a year to 2031 as tier-1 households trade square footage for prime locations and externalize possessions accordingly. Beijing, Shanghai and Shenzhen post price-to-income multiples above 30, a structural squeeze that funnels demand into off-site lockers. E-commerce merchants here cut delivery windows under 24 hours by staging inventory in city-edge facilities, a practice that reduces logistics costs 15-20% and fuels business-tenant take-up. Regulatory fragmentation tempers roll-out pace because fire-safety codes vary by province, yet experienced chains treat this as a moat that blocks thin-capital rivals, preserving attractive yields as the Asia-Pacific self storage market size expands.
Singapore, Hong Kong and ASEAN Self Storage Market
Singapore logged 82% occupancy in December 2024 despite tight land supply, and the April 2025 lifting of a permit moratorium opened Business 1 zones for fresh facilities, unlocking 400 000 m² of potential conversions. Civil Defence Force Fire Code 2023 requirements added 20-25% to build cost but simultaneously eliminated non-compliant operators, consolidating share among well-funded chains. Hong Kong sustains >80% occupancy because 2016-era safety crackdowns closed marginal sites, letting survivors push rents despite HKD 15,000 (USD 1,920) psf land auctions that challenge expansion economics. Emerging clusters in Vietnam, Thailand and Indonesia post lower penetration but sharper adoption curves; My Storage Vietnam’s private-equity round funds five sites totalling 50 000 ft² that will test hub-and-spoke models in Ho Chi Minh City and Hanoi. As secondary metros mature, their incremental demand layers on top of gateway-city stability to widen the Asia-Pacific self storage industry footprint.
Regulatory Landscape
Regulation for self storage in Asia-Pacific continues to be shaped by local land-use controls and fire safety rules, with an expanding layer of requirements for operating practices and digital processes. In Singapore, compliance with Singapore Civil Defence Force Fire Code 2023 (sprinklers, compartmentation, emergency systems) remains a key cost and design driver for both greenfield and conversion projects, while JTC Corporation's April 2025 lifting of the self-storage permit moratorium in Business 1 zones added 400,000 m2 of conversion headroom, within tightly managed industrial land policies.
China added a more formal operating anchor in 2026 through GB/T 47529-2026, a national standard covering the operation and management of self-storage facilities. Cross-market operators also manage jurisdiction-by-jurisdiction differences in fire approvals and hazardous goods rules, and as self storage becomes more technology-led (online booking, remote access, digital identity and payment flows), customer data handling requirements increasingly factor into compliance, including in India where the Digital Personal Data Protection Act (DPDPA) 2023 moved forward with rules notified in November 2025.
Value Chain Analysis
The value chain begins with site sourcing and facility development, where operators increasingly rely on adaptive reuse of industrial floors, master leases, and management contracts to shorten time-to-revenue in high-density cities. Development and fit-out typically bundle building works (partitioning, fire compartmentation, sprinklers and ventilation), security and surveillance, and specialized mechanical systems for climate-controlled units, which elevates the role of compliance consultants and MEP contractors, particularly in Singapore and Hong Kong where fire-safety upgrades have driven consolidation.
Go-to-market and operations are now tightly linked to technology vendors and integrated software stacks, including online acquisition, automated billing, remote access control, and IoT monitoring. This layer is being localized in the region as vendors expand support and inventory footprints, while operators pursue partnerships that widen demand funnels, including storage packaged with flexible workspace offerings and the use of underutilized corporate real estate (for example, post office locations in Japan). On the capital side, institutional investors and newer financing structures influence how portfolios are scaled and optimized, reinforcing standardized operating playbooks and multi-site analytics as core capabilities.
Competitive Landscape
The sector shows moderate concentration; the five largest operators control roughly 35-40% of regional square footage, leaving material white space for national specialists and local independents. Brookfield Asset Management and GIC’s AUD 6.7 billion (USD 4.4 billion) buyout of National Storage REIT in 2025 underlined institutional appetite for inflation-linked cash flows, valuing the portfolio at a 4.5% capitalization rate. CapitaLand Investment’s venture with Extra Space Asia and Ambitious chases similar conversions across Singapore and Japan, targeting yields that beat new-build returns by 200-300 bps.
Technology is the new battleground. Storefriendly rolled out an IoT-driven access and pricing platform in July 2025 that trims labor outlays 15% and lifts occupancy via real-time tariff tweaks. Quraz continues to automate call centers and deploy online reservation funnels, supporting 90%+ occupancy without proportional head-count growth. Niche players defend share with specialization: Work+Store’s 12-14 °C wine vaults attract affluent collectors, while Boxful provides on-demand pickup for apartment dwellers who lack transport, both models that justify premium pricing and curb churn.
Midsize operators in secondary cities remain prime consolidation targets. Private-equity infusions, such as the October 2025 round into My Storage Vietnam, finance rapid site roll-out before eventual sale to pan-regional chains. Compliance costs tied to upgraded fire codes in Singapore and Hong Kong also encourage smaller owners to exit rather than recapitalize. As acquisition pipelines accelerate, combined top-five share could crest near 45% by 2028, nudging the Asia-Pacific self storage market toward higher concentration but still short of oligopolistic levels.
Asia-Pacific Self Storage Industry Leaders
Mandarin Self-storage Pte Ltd
Store Friendly Self-storage Group Ltd (GSC)
Boxful Holdings Limited
Quraz Co., Ltd.
Okinawa Self Storage Co., Ltd.
- *Disclaimer: Major Players sorted in no particular order
Asia-Pacific Self Storage Market Companies Covered in this Report
- StorHub Group Pte. Ltd.
- Extra Space Asia Management Pte. Ltd.
- Boxful Holdings Limited
- Mandarin Self Storage Pte. Ltd.
- Storage King Pty Ltd
- Quraz Co., Ltd.
- Okinawa Self Storage Co., Ltd.
- UD Self Storage Co., Ltd.
- Far East Organization - Store-Y Self Storage
- Store Friendly Self Storage Group Limited
- National Storage Holdings Ltd. (REIT)
- Kennards Self Storage Pty Limited
- Keep-It-Safe Self Storage Sdn. Bhd.
- Cube Self Storage Limited
- SC Storage (Holdings) Limited
- Lock+Store Pte. Ltd.
- UrbanSpace Self Storage Ltd.
- Spacebox Self Storage Co., Ltd.
- My Storage Vietnam Co., Ltd.

Market Opportunities and Future Outlook
The strongest opportunity is extracting higher-yield revenue from constrained urban footprints through micro-units, specialty storage (wine, documents, pharma overflow), and technology-enabled operations that lower staffing intensity. Market behavior already reflects this shift: Storefriendly introduced an IoT-driven self-service storage system in 2025, and technology adoption has reached a point where smart access and automation tools are deployed across operators, supporting remote onboarding, dynamic pricing, and more consistent customer journeys across multi-city portfolios.
A second opportunity is accelerating supply through asset-light expansion and adaptive reuse partnerships that help bypass scarce land parcels, especially in Singapore, Japan, and Hong Kong. Portfolio actions in 2024-2026 show multiple pathways, including CapitaLand Investment-managed Extra Space Asia scaling beyond 100 facilities (as of October 2025) through alliances and conversions, and Japan-based collaborations that repurpose post office assets into storage points. New capital channels also broaden the investable universe for storage real estate, as shown by Storage Asia's April 2026 real-world asset tokenization transaction for its Thonglor 9 project, which adds funding diversification alongside traditional equity and debt for facility upgrades and network expansion.
Recent Industry Developments in Asia-Pacific Self Storage Market
- April 2026: Storage Asia partnered with Int X and Asia Plus to close the IST9 real-world asset (RWA) tokenization deal linked to its Thonglor 9 project. The transaction highlighted an alternative funding route for self storage-linked real estate projects, supporting capital formation beyond conventional bank debt and sponsor equity.
- October 2025: My Storage Vietnam secured private-equity funding to build five new facilities totaling 50,000 ft2, targeting completion by mid-2026. The raise underwrote a multi-site rollout in Vietnam and increased competitive pressure on independent operators that rely on slower, site-by-site development.
- December 2024: CapitaLand Investment-managed Extra Space Asia entered into a strategic alliance with Ambitious Co. Ltd. (Syuno-Pit) to expand self storage supply via conversions and asset-light structures. The partnership strengthened access to suitable properties in dense Japanese and Singaporean submarkets, where new-build options face tighter land and permitting constraints.


Asia-Pacific Self Storage Market Report Scope and Research Methodology
Market Definition and Coverage
In this methodology, the Asia-Pacific self storage market is defined as the total supply of purpose-built self storage space that is available for rent, measured as net rentable lettable area (square feet) across the region.
Scope exclusions: We exclude non-self-storage warehousing, general logistics storage, and informal peer-to-peer storage that is not operated as a dedicated self storage facility.
Segments Covered in This Report
- By End-User
- Personal
- Business
- By Storage Size
- Small and Medium Units (Less Than 40 Sq Ft)
- Large Units (Above 40 Sq Ft)
- Other Storage Sizes (Lockers / Double-Stacked)
- By Storage Type
- Climate-Controlled
- Non-Climate-Controlled
- By Ownership Pattern
- Owned
- Leased
- By Geography
- Japan
- Hong Kong
- Taiwan
- Singapore
- China
- Malaysia
- Rest of Asia Pacific
Data Sources, Market Sizing, and Validation
Desk Research
Desk research starts by mapping the existing self storage footprint and planned additions in key APAC cities, and then checks that story against basic demand signals. Public sources such as national statistics offices for population and household formation, central bank and government housing affordability releases, planning and building approval portals, and customs or trade statistics for portable storage and related fittings are used to ground the assumptions.
We also refer to company annual reports, investor presentations, and credible press coverage to track facility openings, expansions, and pricing moves. For supporting checks, we use paid subscriptions for company financials and intelligence, and a patent database to track trends in access control and space optimization features that can affect facility design and effective capacity. These examples are illustrative only, and many other public sources were reviewed for collection, cross-checking, and clarification.
Primary Interviews and Surveys
Primary work is used to validate how the square footage numbers translate into operating outcomes, especially around occupancy, achieved rent per square foot, and how quickly new space is absorbed in different cities. We speak with facility operators, property managers, real estate advisors, and customers, then reconcile differences across major APAC sub-regions so the final model reflects operating conditions rather than a single-country pattern.
Distribution of primary research fieldwork respondents
| Company type | Respondent position |
|---|---|
| Top tier: 28% | CXOs: 13% |
| Mid tier: 50% | Functional/Unit leaders: 34% |
| Smaller Players: 22% | Managers: 53% |
Market-Sizing & Forecasting
The sizing model is built using a top-down demand-pool reconstruction where urban population, renter share, housing stock constraints, and small business density are translated into expected self storage adoption, and then converted into required rentable area per user cohort. Once that demand-led total is formed, it is tested with selective bottom-up checks using facility counts, advertised unit mix, sampled price cards, and observed occupancy ranges from interviews, which helps adjust for city-level under or over-supply.
Key inputs include net rentable area additions from planned facility pipelines, prevailing occupancy rates by mature versus emerging cities, rent per square foot trends (including the premium for climate-controlled space where relevant), typical unit size mix, and move-in and move-out seasonality tied to relocations and leasing cycles. When a variable is not consistently available for a smaller market, we apply a transparent proxy based on comparable cities and then re-check it with local operators before finalizing.
For forecasting, we use scenario analysis supported by an ARIMA-style trend fit on historical supply growth, then overlay expert-informed adjustments for new builds, conversion projects, and expected stabilization periods for new facilities. This keeps the projection repeatable and practical, even when city-level time series are uneven.
Data Validation & Update Cycle
Validation is done through multiple passes that compare modeled square footage against independent signals such as known facility inventories, announced openings, and the implied occupancy that would be needed to justify observed pricing. Outliers are reviewed one by one, and if a variance cannot be explained by a clear local factor, we re-contact participants to confirm what changed.
Before sign-off, the work is reviewed by another analyst who checks formulas, unit consistency, and reasonableness of key assumptions across countries. Reports are refreshed annually, and interim updates are made when there are material events such as large facility launches, policy shifts that affect urban real estate, or sharp currency and inflation moves. Right before delivery, we do a final pass so clients receive the latest updated view.
Mordor Intelligence's Asia Pacific Self Storage Market Size Measured Against Other Published Estimates
Published market sizes can differ a lot in this space because some sources measure revenue and others measure capacity, and because geography and facility definitions vary by country. Differences also come from how pricing is treated, how new supply is timed into the model, and whether figures are refreshed after major openings.
Some external estimates present Asia-Pacific self storage as a USD revenue number that blends facility rents with related services and applies broad growth rates to a regional total. In Mordor Intelligence, the market is counted in lettable area (square feet) and it is limited to purpose-built self storage space, which prevents price inflation, currency timing, and service bundling from distorting the size.
Benchmark comparison
| Source | Market Size | Gaps in Research Methodology |
|---|---|---|
| Mordor Intelligence | USD 32.86 M (2025) | |
| Global Consultancy A | USD 12.01 B (2024) | Uses revenue in USD and a 2024 base year, so pricing, service add-ons, and currency conversion timing can move the total even if physical capacity changes only slightly. |
| Industry Publisher B | USD 13.10 B (2025) | Reports a regional revenue total with limited visibility on rentable area and unit-mix differences, which can overstate comparable market size when occupancy and achieved rents vary widely across cities. |
The table shows that the largest gaps are caused by mixing unit types (revenue versus square feet) and by how pricing and currency effects are handled across countries. By keeping the model tied to measurable capacity additions and validated occupancy patterns, the final estimate stays easier to trace back to real supply and demand steps, and it can be rechecked as new facilities come online.


Key Questions Answered in the Report
How big will Asia-Pacific self storage demand get by 2031?
It is projected to reach 47.63 million ft² by 2031, expanding at a 6.19% CAGR from 2026.
Which country now leads regional share?
Japan commanded 27.39% of occupied space in 2025, supported by mature consumer acceptance.
Where is growth fastest?
China shows the quickest expansion at a 6.54% CAGR through 2031 as tier-1 households and e-commerce sellers drive uptake.
Why are business tenants growing quicker than households?
Cross-border SMEs use lockers as flexible micro-warehouses that cut delivery costs 15-20%, so their demand rises 6.72% annually.
What makes climate-controlled units attractive?
Pharmaceutical, wine and archival users pay 60% rent premiums for stable conditions, pushing this segment to a 7.02% CAGR.
How are investors entering the sector?
Deals such as Brookfield and GIC's USD 4.4 billion acquisition of National Storage REIT show institutional capital treating self storage like infrastructure.
Page last updated on:


 Your data is secure and never sold or shared.


