
Market Overview
| Study Period | 2020 - 2031 |
|---|---|
| Forecast Data Period | 2026 - 2031 |
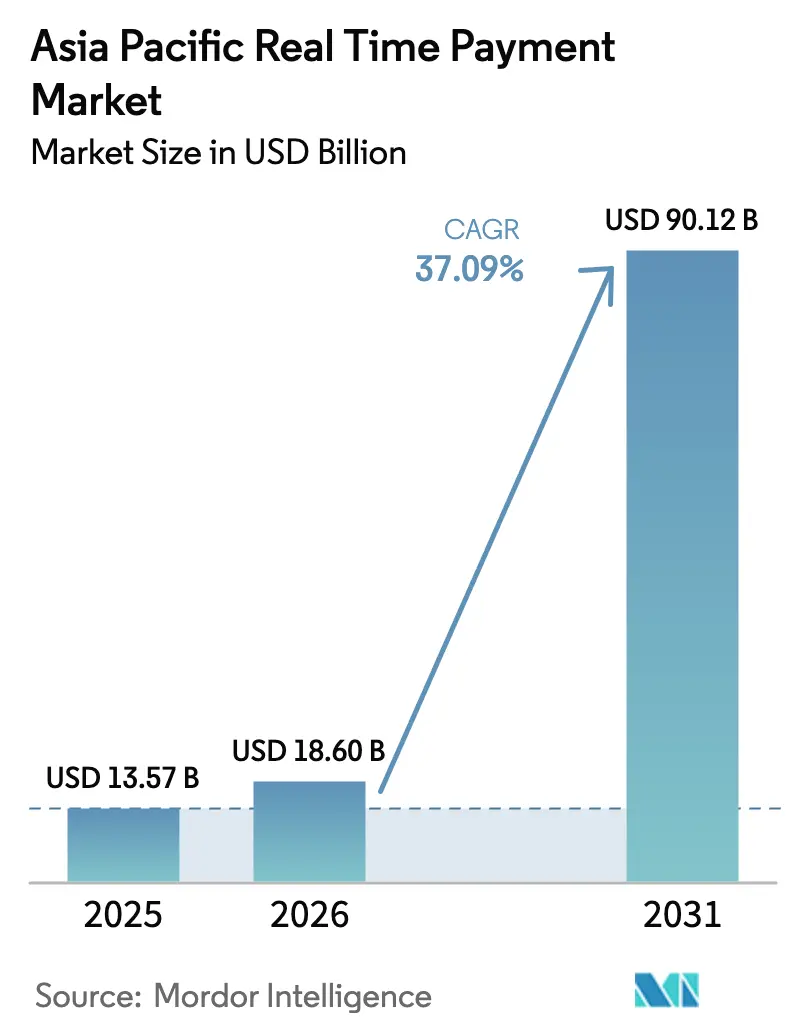
| Base Year Market Size (2025) | USD 13.57 Billion |
| Market Size (2026) | USD 18.60 Billion |
| Market Size (2031) | USD 90.12 Billion |
| Growth Rate (2026 - 2031) | 37.09 % |
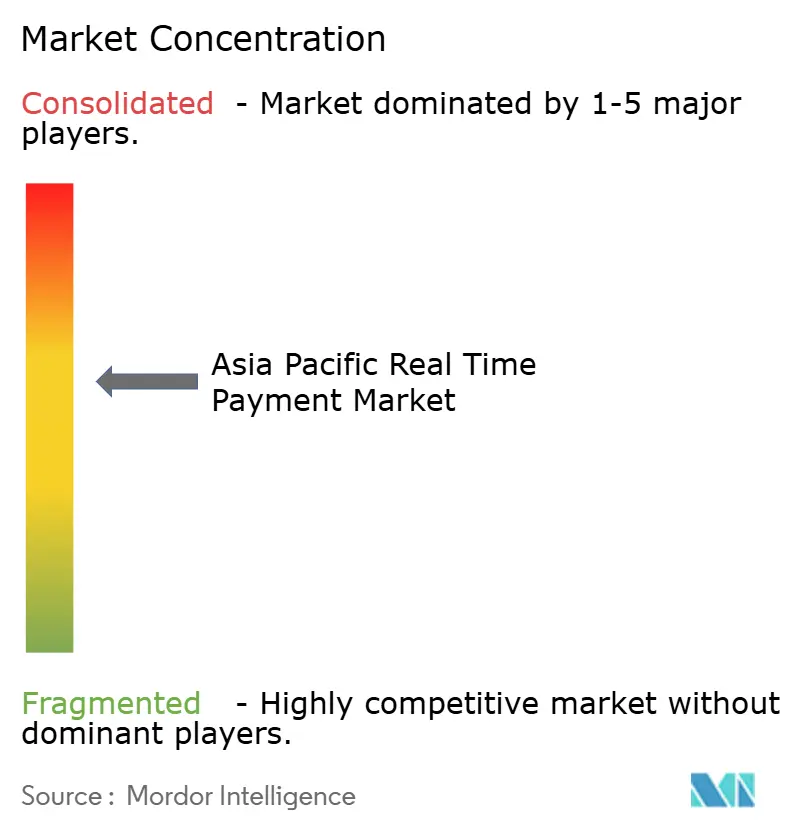
| Market Concentration | Medium |
Major Players *Disclaimer: Major Players sorted in no particular order Image © Mordor Intelligence. Reuse requires attribution under CC BY 4.0. | |
Asia Pacific Real Time Payment Market Analysis by Mordor Intelligence
The Asia Pacific real time payment market size is expected to grow from USD 13.57 billion in 2025 to USD 18.6 billion in 2026 and is forecast to reach USD 90.12 billion by 2031 at 37.09% CAGR over 2026-2031. Robust transaction growth-185.8 billion real-time transfers processed in 2023-confirms that the region has become the global epicenter of instant-payment innovation.[1] Expansion is catalyzed by public-sector infrastructure programs, widespread smartphone adoption, and the proliferation of QR-code standards that make account-to-account payments intuitive for consumers and cost-effective for merchants. Government incentives that remove merchant-discount fees, the rollout of ISO 20022 messaging, and the rise of cross-border corridors such as ASEAN Regional Payment Connectivity are accelerating commercial uptake, especially among small businesses and e-commerce sellers. Competitive dynamics vary by country: China maintains scale leadership through Alipay and WeChat Pay, whereas India’s open UPI architecture sustains multi-provider competition and delivers the fastest volume growth.
Key Report Takeaways
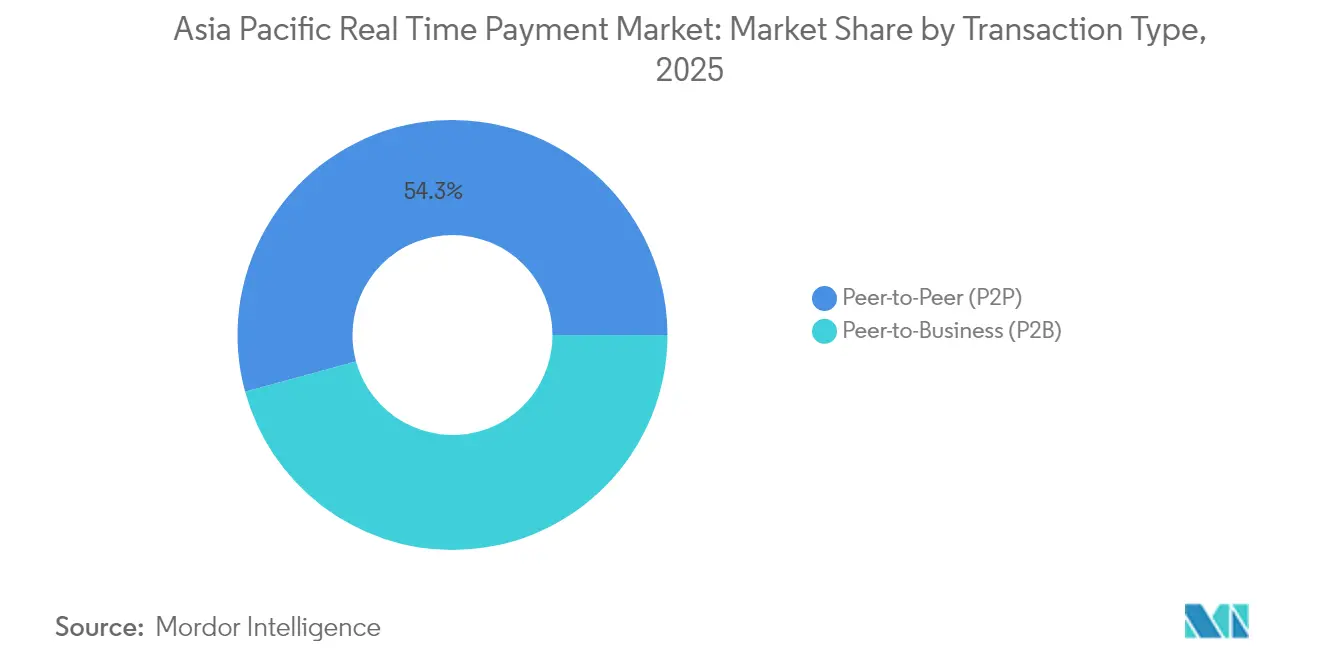
- By transaction type, peer-to‐business transactions posted the quickest expansion at a 44.32% CAGR between 2026-2031 while peer-to-peer transfers held 54.25% of the Asia Pacific real time payment market share in 2025.
- By component, platforms and solutions commanded 67.15% revenue in 2025, whereas services are forecast to grow at 41.05% CAGR on mounting demand for API integration and fraud-mitigation consulting.
- By deployment mode, cloud installations captured 59.45% of the Asia Pacific real time payment market size in 2025 and are expected to register 40.7% CAGR through 2031.
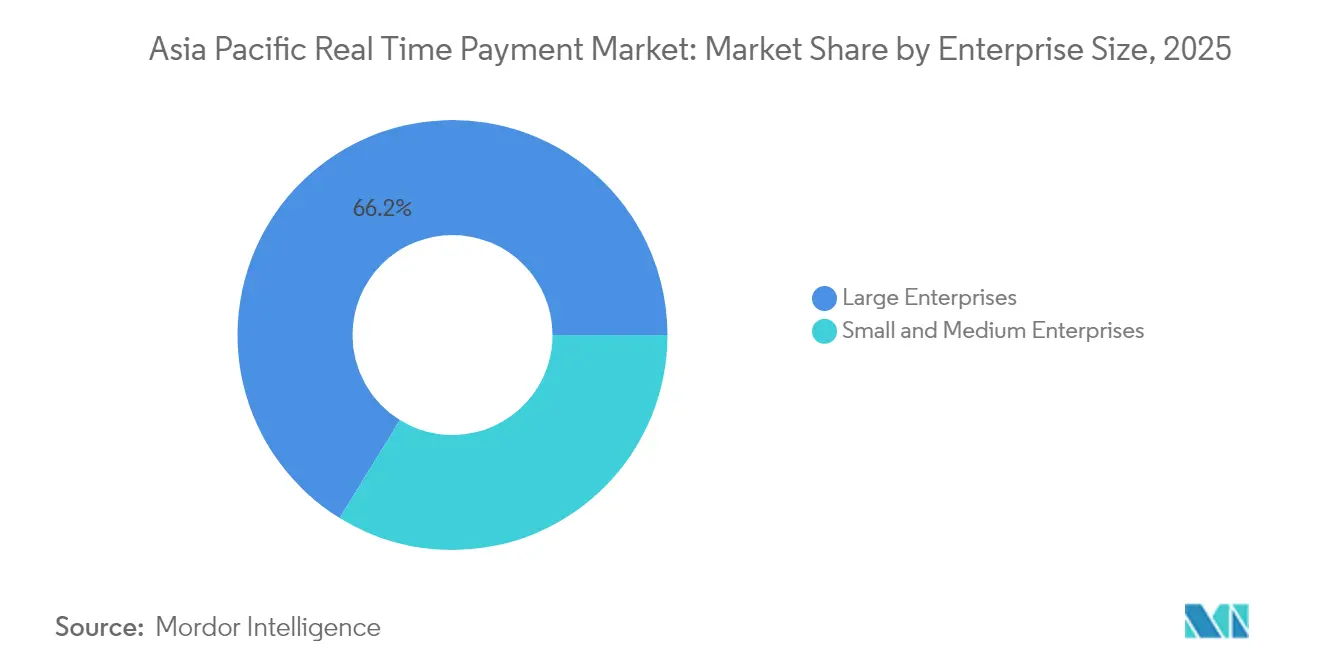
- By enterprise size, small and medium enterprises are projected to expand at 42.95% CAGR, outpacing the large-enterprise segment while still accounting for a smaller revenue base.
- By end-user industry, retail and e-commerce is advancing at the highest 39.95% CAGR, while banking, financial services, and insurance retained 37.40% of 2025 revenue.
- By geography, China contributed 40.65% of 2025 revenue and India is growing at 41.62% CAGR, the strongest pace among major economies.
Note: Market size and forecast figures in this report are generated using Mordor Intelligence’s proprietary estimation framework, updated with the latest available data and insights as of 2026.
Market Trends and Insights
Drivers Impact Analysis of Asia Pacific Real Time Payment Market*
| Driver | (~) % Impact on CAGR Forecast | Geographic Relevance | Impact Timeline |
|---|---|---|---|
| Accelerated Adoption of National Instant-Payment Rails in Developing APAC Economies | +12.5% | India, Indonesia, Philippines, Thailand, Malaysia | Medium term (2-4 years) |
| Mobile-First Consumer Base Enabling QR-Code and App-Based RTP Ecosystems | +8.7% | China, India, Southeast Asia core markets | Short term (≤ 2 years) |
| Government-Led Cashless Initiatives such as India's Digital Public Infrastructure | +7.2% | India, China, Singapore, Thailand | Long term (≥ 4 years) |
| Cross-Border RTP Corridors Driving Merchant Acceptance in E-commerce | +5.1% | ASEAN+3, Australia-New Zealand corridor | Medium term (2-4 years) |
| API-Driven Open-Banking Frameworks Lowering Integration Barriers for RTP | +3.8% | Singapore, Australia, Hong Kong, Japan | Short term (≤ 2 years) |
| Rising Demand from Gig-Economy and Salary-On-Demand Platforms | +2.1% | Urban centers across APAC, particularly China and India | Short term (≤ 2 years) |
| Source: Mordor Intelligence | |||
Accelerated Adoption of National Instant-Payment Rails in Developing APAC Economies
National instant-payment schemes are transforming financial inclusion across emerging Asia. Indonesia’s BI-FAST, the Philippines’ InstaPay, and Malaysia’s RTP platform illustrate how central banks use 24/7 rails to bypass correspondent networks, shrink settlement from days to seconds, and stimulate GDP through improved cash-flow velocity.[2] Thailand’s PromptPay now accounts for 43.2% of domestic payments, demonstrating that low-cost merchant onboarding can unlock mass acceptance. Pakistan’s Raast projects 63.5 million new banked citizens by 2028, reinforcing the link between real-time rails and social-equity outcomes. Across India, Brazil, China, Thailand, and Mexico, instant payments lifted USD 99.6 billion in incremental GDP during 2023, validating the macroeconomic multiplier that accompanies real-time settlement. [3]
Mobile-First Consumer Base Enabling QR-Code and App-Based RTP Ecosystems
Smartphones are ubiquitous and affordable across Asia, and standard QR specifications make them powerful payment instruments. In China, mobile wallets expanded from 3.5% share in 2011 to 83% in 2018, giving app-based payments near-universal consumer reach. Indonesia’s QRIS framework harmonizes previously fragmented codes, enabling over 26 million merchants to accept domestic and cross-border QR payments on low-cost handsets. Surveys reveal that 72% of Southeast Asian consumers attempted cashless payments in 2023, with 79% using mobile wallets; cross-border QR interoperability, such as the Cambodia–Japan Bakong-JPQR link, further reduces remittance costs by 80% while shrinking settlement times to 10 seconds.
Government-Led Cashless Initiatives
Fiscal and regulatory interventions have accelerated digital adoption. India’s USD 180 million incentive pool for FY 2024-25 reimburses merchants for low-value UPI transactions, eliminating MDR fees and sustaining volume in the long tail of micro-retail. Japan’s cashless ratio touched 39.3% in 2023, nearing the 40% milestone the Cabinet set for June 2025. China’s digital yuan pilot-with 1.8 billion wallets and programmable money features-expands use cases such as prepayment escrow and smart-contract-linked subsidies, aligning monetary policy with digital-economy targets. Singapore’s Payment Services Act delivers regulatory clarity that attracts fintech-driven unattended payment models, including EV-charging micro-kiosks and automated dining installations.
Cross-Border RTP Corridors Driving Merchant Acceptance in E-Commerce
Region-wide settlement corridors are dismantling the cost and latency barriers that once constrained small exporters. The ASEAN Regional Payment Connectivity framework links Indonesia, Malaysia, the Philippines, Singapore, and Thailand, covering trade flows equal to 38% of global commerce when fully operational. The live PayNow-PromptPay bridge already allows Singaporean and Thai consumers to send money in real time using only a mobile number proxy, cutting fees by up to 70% compared with SWIFT-based transfers. India’s UPI became the first non-ASEAN system invited to Project Nexus, positioning domestic wallets to reach new customers in four Southeast Asian markets.
Restraints Impact Analysis of Asia Pacific Real Time Payment Market*
| Restraint | (~) % Impact on CAGR Forecast | Geographic Relevance | Impact Timeline |
|---|---|---|---|
| High Fraud and Scam Incidence in Instant-Payment Channels Hinders the Market | -6.8% | India, Australia, China, developed APAC markets | Short term (≤ 2 years) |
| Fragmented Regulatory Standards Across APAC Jurisdictions | -4.2% | ASEAN, broader APAC cross-border corridors | Medium term (2-4 years) |
| Legacy Core Banking Systems Limiting Real-Time Settlement by Tier-2 Banks | -3.1% | Indonesia, Philippines, Thailand, smaller banks across APAC | Long term (≥ 4 years) |
| Capex Constraints Among SMEs for RTP API Integration | -2.4% | Rural and semi-urban areas, developing APAC economies | Medium term (2-4 years) |
| Source: Mordor Intelligence | |||
Fragmented Regulatory Standards Across APAC Jurisdictions
Diverging data-localization mandates, AML rules, and ISO 20022 adoption schedules complicate cross-border connections. Providers often duplicate compliance teams country-by-country, pushing up operating costs and slowing time-to-market. Absence of harmonized technical standards leaves each scheme running unique message formats, creating one-off integration projects that inflate capital budgets. Patchy central-bank digital-currency frameworks add another compliance layer, particularly for fintechs that lack legal resources. Smaller merchants may be deterred altogether, reinforcing digital divides among ASEAN economies.
High Fraud and Scam Incidence in Instant-Payment Channels
The irrevocable nature of real-time transfers compresses the window for manual fraud checks. India recorded USD 1.32 billion in scam-driven losses during 2024, while authorized-push-payment fraud climbs at 8.7% CAGR in Australia. Institutions invest in AI detection engines that score transactions in milliseconds, but false-positive rates remain a cost concern. Criminal rings exploit cross-border corridors, leveraging uneven enforcement to launder funds before detection. Consumer confidence can falter in the wake of viral “digital-arrest” scams, pushing regulators toward mandatory reimbursement regimes that may reshape liability models for banks and wallets.
*Our forecasts treat driver/restraint impacts as directional, not additive. The impact forecasts reflect baseline growth, mix effects, and variable interactions.
Asia Pacific Real Time Payment Market Segment Analysis
By Transaction Type:
P2B Drives Commercial TransformationPeer-to-peer transfers held 54.25% revenue in 2025, reflecting the consumer origins of the Asia Pacific real time payment market. Yet the peer-to-business segment shows superior momentum, growing 44.32% CAGR to 2031 as merchants embrace instant settlement to unlock working capital. Corporates in China alone could free USD 421 billion by optimizing payment timing, while 71% of Southeast Asian SMBs link digital payments to sales increases.
The P2B surge also rides government digitization of procurement and tax receipts, illustrated by India’s Bharat Bill Payment System registering 60% yearly value growth. Retailers showcase tangible benefits: Reliance Retail achieved 19.4% revenue growth with 40% digital payments; D-Mart lifted profitability as UPI captured a quarter of sales. Cross-border B2B instant transfers are forecast to reach 42% of USD 16 trillion in enterprise payments by 2028, signifying growing reliance on open-loop account-to-account rails that bypass card fees.

By Component:
Services Accelerate Through Integration ComplexityPlatforms and solutions controlled 67.15% of 2025 spend, yet professional services now expand at 41.05% CAGR, reflecting the technical and regulatory complexity of modern instant-payment ecosystems. Cloud migrations, ISO 20022 upgrades, and API security assessments require specialized knowledge that banks often outsource. Malaysia’s PayNet relied on consulting partners to adapt core systems for DuitNow QR and regional QR interoperability within nine months, underscoring services demand.
Legacy modernization is another driver; 14% of financial institutions still depend on outdated mainframes that need gradual conversion to avoid disruption. Service integrators deploy façade APIs, message converters, and hybrid cloud designs to maintain uptime during cutovers. Consequently, advisory and managed-service revenue outpaces traditional license fees, anchoring a recurring-revenue layer inside the Asia Pacific real time payment market.
By Deployment Mode:
Dominance AcceleratesCloud captured 59.45% of the Asia Pacific real time payment market share in 2025, boosted by elasticity, global distribution, and pay-as-you-grow economics. Instant-payment peaks around shopping festivals like Singles’ Day and 12-12 sales strain on-premise estates; cloud bursting mitigates risk without excessive idle capacity. Banks migrating non-core payment modules report up to 40% opex savings across five years, even after factoring data-sovereignty safeguards.
Not all regulators allow unfettered public-cloud hosting, so hybrid models persist. Institutions in India and Indonesia often process transactions in-country while leveraging cloud analytics for fraud scoring. Conversely, Singapore, Australia, and Japan increasingly endorse cloud-first directives, accelerating SaaS adoption among smaller fintechs that lack data-center budgets. The deployment mix will continue tilting toward cloud as harmonized encryption and sovereign-cloud offerings satisfy compliance officers.
By Enterprise Size:
SME Growth Outpaces Large EnterprisesLarge enterprises still held 66.20% of 2025 value because of their scale and complex integration needs, but SMEs exhibit a 42.95% CAGR through 2031, narrowing the gap each year. With 90% of Asia-Pacific businesses classified as MSMEs yet facing USD 2.7 trillion in financing gaps, real-time payments become vital for liquidity and market access. Tokenization-driven fraud reduction and higher authorization rates delivered USD 7.9 billion in collective SME benefits between 2019-2024.
Cloud-native payment gateways package compliance, settlement, and reconciliation into subscription models priced for small merchants. Government support is equally pivotal: India’s zero-MDR policy sustains margin for micro-retailers, and Japan’s DX Connect Gate streamlines invoice-to-payment workflows for regional suppliers. As adoption costs fall, SMEs will command a larger portion of the Asia Pacific real time payment market size over the forecast horizon.
By End-User Industry:
Retail Disrupts BFSI LeadershipBanking, financial services, and insurance provided 37.40% of revenue in 2025, reflecting their role as both network operators and early adopters. Yet retail and e-commerce, expanding at 39.95% CAGR, is poised to narrow that lead as instant checkout, embedded finance, and buy-now-pay-later options flourish. Mobile commerce is expected to represent 80% of Asia-Pacific e-commerce sales by 2028, and real-time settlement minimizes cart abandonment by reassuring consumers of immediate order confirmation.
Healthcare adoption grows through Insurtech platforms that settle claims in real time, improving patient experience and provider cash flow. Utilities and telecoms automate bill presentment with instant activation upon payment, shrinking collection lags. Public-sector agencies digitize tax, subsidy, and procurement flows, unlocking billions in cost savings. Collectively, these vertical expansions amplify addressable revenue for solution vendors across the Asia Pacific real time payment industry.
Geography Analysis
China Real Time Payment Market
China retained 40.65% revenue in 2025 thanks to its entrenched digital-wallet culture and cross-border ambitions. Alipay and WeChat Pay penetrate nearly every consumer touchpoint, while the digital renminbi pilot added programmable functions reaching 7.3 trillion yuan in transactions across 26 regions. CIPS processed 8.2 million cross-border transactions worth 175.49 trillion yuan in 2024, a 42.6% jump that highlights growing global relevance.
India Real Time Payment Market
India is the fastest riser with a 41.62% CAGR. UPI posted 18.3 billion transfers worth ₹24.77 lakh crore (USD 298 billion) in March 2025, proving the scalability of open APIs and multi-bank participation. International expansion into 27 countries positions UPI as a technology export, while the FY 2024-25 merchant incentive program keeps onboarding costs near zero for corner stores.
APAC Real Time Payment Market
Japan, South Korea, Australia, Singapore, Indonesia, and the rest of Asia-Pacific form a diverse growth bloc. Japan’s cashless ratio nears 40% as unified QR initiatives bridge municipal tax payments. South Korea’s KB Pay integrates AI fraud screening, anticipating generative-AI chat services by 2026. Australia’s New Payments Platform cooperates with New Zealand on e-invoicing, and Indonesia’s QRIS standardization connects MSMEs to digital commerce quickly. Collectively, these markets assure a balanced opportunity mix across mature and emerging economies, advancing the Asia Pacific real time payment market.
Regulatory Landscape
Regulation of real-time payments across Asia-Pacific is tightening around scheme oversight, risk management, and interoperability. In March 2026, the Bank of Thailand created a framework for Systemically Important Retail Payment Systems (SIRPS) and designated PromptPay as the first system under that regime, which raises resilience and governance requirements for operators and participants.
Cross-border and messaging alignment is also moving forward. In December 2025, Australia amended the Payment Systems (Regulation) Act 1998 to broaden coverage to additional payment systems and participants, and in June 2026 the Reserve Bank of Australia issued an issues paper for its payments regulation review with consultation scheduled for August-September 2026. Supervisors are converging toward ISO 20022 harmonisation (highlighted in a February 2026 BIS CPMI report) and stronger supervision of non-bank payment institutions, including the People's Bank of China revised categorization and rating measures finalized in March 2026.
Value Chain Analysis
The value chain centers on scheme owners and regulators (central banks and national payment operators) that define rules, proxies, and settlement models for 24/7 rails, followed by participant banks, licensed non-bank payment institutions, and wallet operators that originate transactions through apps, QR acceptance, and APIs. Technology enablers include core banking and payment hubs, ISO 20022 message translation, fraud and AML orchestration, cloud and hybrid infrastructure, and identity and directory services, while distribution runs through merchants, payment facilitators, gateways, and super-app ecosystems that embed instant pay into checkout, billing, and disbursements.
Interlinking layers are becoming more prominent as cross-border corridors and QR interoperability add routing, compliance screening, FX, and dispute-handling needs across schemes. In June 2026, the Monetary Authority of Singapore and the Association of Banks in Singapore advanced PayNow Generation 2 priorities covering customer experience, business payments, network coverage, and scheme-level enablers, while Malaysia's April 2026 launch of a 24/7 RTGS capability for large-value interbank transfers shows parallel modernization of high-value infrastructure that can support retail fast-payment ecosystems. Key bottlenecks remain uneven data-localization and AML/CFT requirements across jurisdictions, which increase compliance and integration costs for providers operating multi-country real-time payment connectivity.
Competitive Landscape
Global card networks, regional super-apps, domestic clearing houses, and fintech specialists compete in a moderately fragmented arena. Visa processed USD 16 trillion in 2024 payment volume, strengthening its real-time proposition through network-to-network links with PromptPay and PayNow. Mastercard’s Send and Click-to-Pay solutions position it for cross-border RTP, while PayPal’s Fastlane guest-checkout reduces friction for 450 million active users.
Chinese titans Ant Group and Tencent maintain a duopoly at home via Alipay and WeChat Pay, but are expanding regionally through joint QR-code standards and investment in logistics. India’s NPCI anchors an open ecosystem where PhonePe, Google Pay, and Paytm compete on loyalty programs and credit overlays. Australian Payments Plus merges eftpos, BPAY, and NPP to create scale efficiencies, demonstrating that government-backed utility models can co-exist with commercial networks.
Strategic differentiation centers on fraud analytics, ISO 20022 readiness, and API orchestration. Vendors allocate increasing R&D to AI models that flag mule activity within 100 milliseconds. White-space growth opportunities include SME cross-border invoices, instant wage disbursements, and government-to-citizen welfare payouts. Consequently, partnerships-such as Visa’s merchant-acceptance alliance with Grab or ACI Worldwide’s cloud tie-up with Microsoft Azure-are likely to proliferate as players pursue defensible niches inside the Asia Pacific real time payment market.
Asia Pacific Real Time Payment Industry Leaders
-
ACI Worldwide
-
FIS Global
-
Mastercard Inc.
-
PayPal Holdings Inc.
-
Fiserv Inc.
- *Disclaimer: Major Players sorted in no particular order
Asia Pacific Real Time Payment Market Companies Covered in this Report
- Fiserv Inc.
- PayPal Holdings Inc.
- Mastercard Inc.
- FIS Global
- Visa Inc.
- Ant Group Co. Ltd.
- Tencent Holdings Ltd.
- Paytm Payments Bank Ltd.
- ACI Worldwide Inc.
- Apple Inc.
- SIA SpA (Nexi Group)
- Finastra
- National Payments Corporation of India (NPCI)
- Australian Payments Plus
- Ripple Labs Inc.
- Temenos AG
- Huawei Technologies Co. Ltd.
- UnionPay International
- Nets Group
- Grab Holdings Ltd.
- Kakao Pay Corp.
- Gcash Inc.
Market Opportunities and Future Outlook
Cross-border and SME-focused use cases stand out as monetization whitespace, especially where domestic instant rails and QR standards are being linked directly across markets. Indonesia's work to connect QRIS with India's UPI by end-2026, together with the existing ASEAN Regional Payment Connectivity momentum, supports demand for scheme interlinking platforms, proxy-directory extensions, cross-border fraud controls, and merchant acceptance tools that reduce reliance on correspondent banking for small-ticket trade and tourism payments.
B2B and corporate treasury modernization is another opportunity as providers pair low-value real-time payments with higher-value and cross-border flows under ISO 20022. Malaysia's April 2026 rollout of a 24/7 RTGS capability points to demand for 24/7 liquidity, reconciliation, and straight-through processing beyond consumer P2P, while the July 2026 go-live of Siam Commercial Bank with Citi's 24/7 USD Clearing and Citi Token Services reflects pull for near real-time, round-the-clock cross-border USD payments for corporates. At the same time, intensified supervision of non-bank payment institutions, including the People's Bank of China revised categorization and rating measures, is increasing demand for compliance-by-design platforms, AML screening, and embedded risk-based controls across real-time payment stacks.
Recent Industry Developments in Asia Pacific Real Time Payment Market
- July 2026: Siam Commercial Bank went live with Citi 24/7 USD Clearing and Citi Token Services to enable near real-time, round-the-clock cross-border USD payments for corporate clients. The rollout supports always-on treasury and supplier payments and raises the bar for bank-led cross-border RTP experiences in the region.
- June 2025: Mastercard and National ITMX announced an extended multi-year collaboration to further develop PromptPay, Thailand's real-time payments platform. Continued investment in the national rail strengthens scheme capabilities for scale, security, and additional use cases that expand beyond consumer transfers.
- July 2024: AFFIN Group partnered with ACI Worldwide to modernize real-time payment capabilities in Malaysia, building on ACI solutions used in PayNet's real-time payments infrastructure. The program highlights banks prioritizing unified payment processing as ISO 20022 and multi-rail convergence become more central to regional RTP operations.
Asia Pacific Real Time Payment Market Report Scope and Research Methodology
Market Definition and Coverage
For this report, the Asia-Pacific real-time payment market refers to the value of instant electronic retail payments that clear and make funds available immediately, and that can be used 24/7/365 for everyday transactions.
Scope exclusions: Cross-border card network settlement, offline cash payments, and traditional batch bank transfers that do not provide immediate fund availability are excluded from this market sizing.
Segments Covered in This Report
- By Transaction Type
- Peer-to-Peer (P2P)
- Peer-to-Business (P2B)
- By Component
- Platform / Solution
- Services
- By Deployment Mode
- Cloud
- On-Premise
- By Enterprise Size
- Large Enterprises
- Small and Medium Enterprises
- By End-User Industry
- Retail and E-Commerce
- BFSI
- Utilities and Telecom
- Healthcare
- Government and Public Sector
- Other End-user Industries
- By Country
- China
- India
- Japan
- South Korea
- Australia
- Singapore
- Indonesia
- Rest of Asia-Pacific
Data Sources, Market Sizing, and Validation
Desk Research
Desk research was used to frame how real-time rails operate in Asia-Pacific and to map what is and is not counted as an instant payment in practice. We leaned on public sources such as central bank and payments regulator publications, national payment switch scheme websites, the BIS and IMF for macro and banking indicators, and World Bank Global Findex style adoption signals where available. We also reviewed payment statistics releases and policy notes that describe operating hours, settlement finality, and usage rules, which helps keep the definition consistent across countries.
In parallel, company annual reports, investor decks, and reputable press were reviewed to understand rollout timing, pricing direction, and major use cases like P2P and merchant payments. For countries where disclosure is uneven, we used paid subscriptions focused on company financials and intelligence, news and financials, patent databases, and public contracts and tenders to confirm product launches and ecosystem maturity without assuming volumes upfront. These desk sources are not exhaustive, and many additional public documents and datasets were referenced to collect, validate, and clarify inputs during the study.
Primary Interviews and Surveys
Primary work focused on interviews and short surveys with payment ecosystem participants across Asia-Pacific, including banks, payment infrastructure providers, processors, merchants, and sector specialists who track scheme rules and adoption. We used these discussions to confirm what drives value growth, how pricing is applied across transaction types, and what adoption constraints exist by country, then checked those points against what was seen in desk research.
Distribution of primary research fieldwork respondents
| Company type | Respondent position |
|---|---|
| Top tier: 38% | CXOs: 14% |
| Mid tier: 48% | Functional/Unit leaders: 29% |
| Smaller Players: 14% | Managers: 57% |
Market-Sizing & Forecasting
Sizing was built using a top-down structure where country-level payment rail maturity and published payment indicators were used to reconstruct the addressable real-time payment value pool, and then rolled up to Asia-Pacific totals. To keep the math grounded, we used market fingerprints such as real-time transaction volumes and growth trends, the share of electronic payments moving to instant rails, smartphone and internet penetration, merchant acceptance readiness (including QR and account-to-account acceptance), and the pace of new use cases like bill pay, disbursements, and government collections.
Those totals were then checked with selective bottom-up approximations so we could spot any overstatement early. Examples include sampling average transaction values by use case, applying plausible pricing and fee ranges discussed in interviews, and doing channel checks on adoption by large merchants and utilities, which helps adjust markets where public statistics lag. Where gaps existed, assumptions were anchored to comparable markets with similar scheme rules and banking participation, and they were further stress-tested with interview feedback.
For forecasting, we relied on scenario analysis tied to a small set of drivers that are easy to explain and refresh, including regulatory mandates, rollout timelines for scheme features, merchant acceptance expansion, and changes in consumer payment mix. The final forecast path was adjusted only after the driver trends and expert views aligned, so growth did not rely on a single aggressive variable.
Data Validation & Update Cycle
Validation was done by triangulating model outputs against independent signals, such as scheme-level statistics, central bank payment indicators, and visible adoption milestones across major Asia-Pacific countries. If a country estimate moved too far from what those signals suggested, we revisited the transaction value assumptions, the timing of feature rollouts, and the pace of merchant acceptance before sign-off.
Before publication, the build is reviewed in steps by another analyst to catch unit errors, currency conversion timing issues, and unusual year-to-year jumps. Interviews are re-opened when a key variable changes materially, such as a pricing revision, a scheme rule update, or a major interoperability linkage that shifts usage. Reports are refreshed annually, with interim updates for material events, and a final pre-delivery check is completed so clients receive the latest view available at that time.
Mordor Intelligence's Asia Pacific Real Time Payment Market Estimate Compared With Other Published Estimates
Published numbers for Asia-Pacific real-time payments can look far apart because the topic is easy to stretch, and not every source is clear about what is being measured. Differences usually come from how instant payments are defined, whether the estimate is based on transaction value versus transaction volume, and how aggressively adoption is projected across large markets.
The table points to a key split between studies that count end-to-end payment value and those that also fold in adjacent digital payment processing revenue or broader payments spend. In Mordor Intelligence's model, the value is tied to instant electronic retail payments with immediate settlement and fund availability, which avoids mixing in non-instant rails or unrelated fintech revenue lines.
Benchmark comparison
| Source | Market Size | Gaps in Research Methodology |
|---|---|---|
| Mordor Intelligence | USD 13.57 B (2025) | |
| Trade Journal A | USD 170.20 B (2029) | This figure appears to reflect instant payments as a value-of-payments flow across a selected set of APAC markets, and it is reported on a different year with a shorter forecast window, which can make it look larger or smaller depending on the included countries and the conversion timing. |
| Industry Report B | USD 427.00 B (2030) | This estimate is presented in the context of broad digital payments in APAC rather than only immediate-settlement rails, so it likely includes non-instant methods and wider electronic payment categories that inflate the addressable value compared with a strict real-time definition. |
Looking across the three figures, the spread is mainly explained by scope boundaries and the metric being sized, not by small arithmetic differences. Our approach stays traceable because the market is built from country payment signals, checked with realistic use case assumptions, and then reviewed for definition consistency before the regional total is finalized.
Key Questions Answered in the Report
What is the current size of the Asia Pacific real time payment market?
The market is valued at USD 18.6 billion in 2026 and is forecast to reach USD 90.12 billion by 2031 at a 37.09% CAGR.
Which country is growing fastest within the region?
India shows the highest growth, advancing at a 41.62% CAGR, driven by UPI’s record transaction volumes.
Why are peer-to-business payments important?
P2B transactions improve merchant cash flow, cut card fees, and are expanding at a 44.32% CAGR—the fastest among transaction types.
How does cloud deployment influence cost?
Banks migrating payment workloads to cloud environments report up to 40% operating-expense savings over five years while ensuring elastic scalability for peak events.
What are the main challenges facing providers?
Key challenges include fragmented regulatory frameworks that increase compliance costs and rising fraud scams that demand continual investment in AI-based security.