Market Overview
| Study Period | 2018 - 2030 |
|---|---|
| Base Year For Estimation | 2024 |
| Forecast Data Period | 2025 - 2030 |
| Market Size (2025) | USD 15.93 Billion |
| Market Size (2030) | USD 20.59 Billion |
| Growth Rate (2025 - 2030) | 5.26% CAGR |
| Market Concentration | Medium |
Major Players*Disclaimer: Major Players sorted in no particular order Image © Mordor Intelligence. Reuse requires attribution under CC BY 4.0. | |

Asia-Pacific Ready to Drink Coffee Market Analysis by Mordor Intelligence
The Asia-Pacific Ready to Drink Coffee Market size is estimated at 15.93 billion USD in 2025, and is expected to reach 20.59 billion USD by 2030, growing at a CAGR of 5.26% during the forecast period (2025-2030).
The Asia-Pacific RTD coffee market is experiencing a significant transformation driven by evolving consumer preferences and lifestyle changes. A notable shift is evident in South Korea, where approximately 70% of adults were daily coffee consumers in 2022, spending an average of USD 84 per month. This trend reflects the broader regional movement toward premium and convenient coffee beverage options. The market's evolution is further shaped by the increasing influence of international coffee chains, which are introducing innovative RTD coffee products and expanding their presence across the region. The convergence of traditional Asian beverage culture with modern coffee drinks consumption patterns has created a unique market dynamic, particularly appealing to urban consumers seeking convenient yet sophisticated drink options.
Health and wellness considerations are increasingly influencing consumer choices in the RTD coffee segment. In 2022, nearly 90% of consumers in Asia-Pacific expressed willingness to pay a premium for sustainable and healthy products, driving manufacturers to reformulate their offerings with reduced sugar content and additional functional benefits. Companies are responding by incorporating vitamins, minerals, antioxidants, and natural energy boosters into their products. This health-conscious trend has led to the emergence of sugar-free variants, plant-based options, and functional ready to drink coffee beverages that cater to specific dietary requirements and wellness goals.
Product innovation and sustainability initiatives are reshaping the competitive landscape. Major players are investing in eco-friendly packaging solutions and sustainable sourcing practices to appeal to environmentally conscious consumers. In 2023, Starbucks partnered with Nestlé to expand its RTD coffee portfolio in Southeast Asia, introducing new flavors and sustainable packaging options. Similarly, Costa Coffee's entry into Japan in August 2023 marked a significant development in the market, bringing new premium ready to drink coffee variants to one of the region's largest coffee-consuming nations. These strategic moves reflect the industry's focus on product differentiation and sustainable practices.
The market is witnessing a notable generational shift in consumption patterns, particularly among younger consumers. In Indonesia, approximately 45-50% of Gen Z consumers integrated cold brew coffee into their daily routines in 2022, indicating a strong preference for innovative coffee formats among younger demographics. This trend is complemented by the rising popularity of specialized coffee variants, including nitro cold brew coffee and functional coffee beverages. The industry is responding with targeted marketing campaigns and product innovations that appeal to younger consumers' preferences for unique flavors, sustainable packaging, and premium coffee experiences. Digital marketing and social media platforms are playing crucial roles in shaping these consumption patterns and building brand loyalty among younger consumers.
Asia-Pacific Ready to Drink Coffee Market Trends and Insights
Consumers are increasingly seeking convenient and portable beverage options to fit their busy lifestyles, thereby driving segment sales
- Majorly younger consumers in the region have demonstrated a love of coffee that has driven the industry’s growth in a region known to be dominated by tea culture.
- The RTD coffee market is dominated by industry giants, which possess strong brand awareness among young consumers. In 2022, Starbucks, in particular, stood out in terms of brand awareness followed by Nestle.
- Compared to other countries in the region, China is slowly becoming a coffee-drinking nation, as consumption is growing at an incredible 15% annually, as opposed to the global rate of 2.2%.
- The demand for RTD coffee products is gaining traction among consumers. Consumers in the Asia-Pacific region prefer coffee over tea as it appeals to young and urban consumers.
Understand The Key Trends Shaping This Market
Download PDF
OTHER KEY INDUSTRY TRENDS COVERED IN THE REPORT
- Key players are launching RTD coffee containing a variety of taste profiles and dairy-free varieties to cater to a broader audience
- Boss Coffee excels in blending quality coffee with convenience and innovation, providing consumers with a quality coffee experience
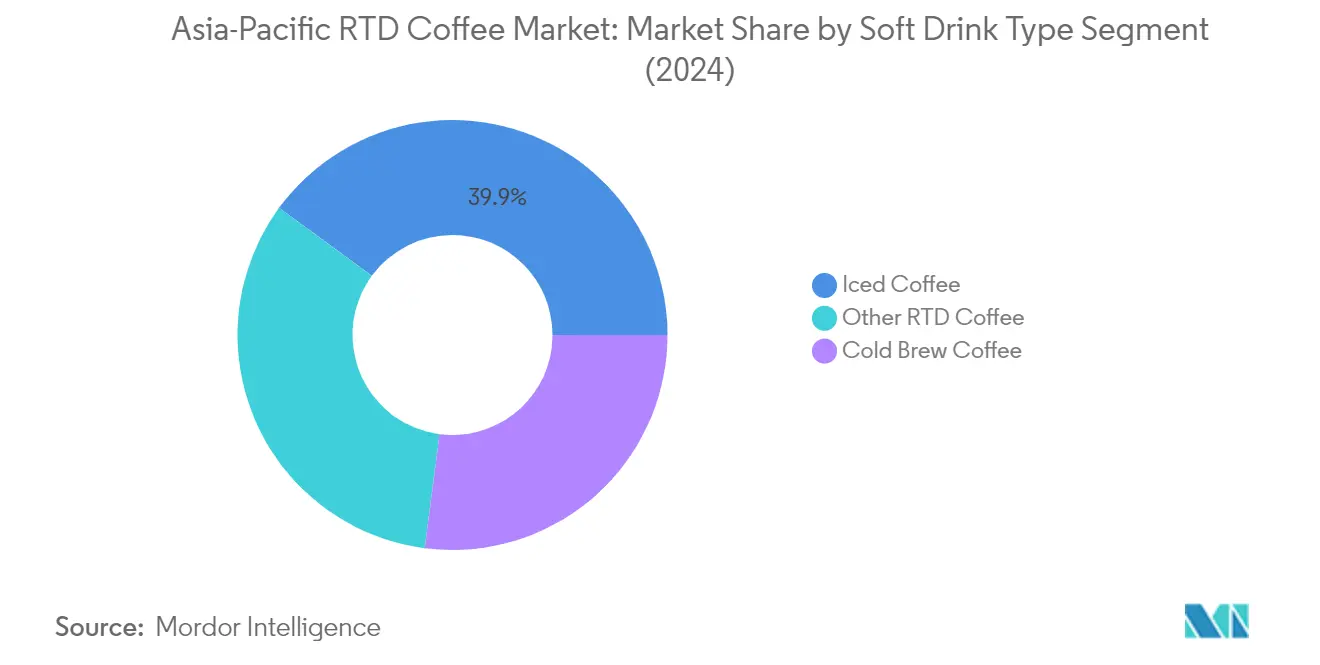
Segment Analysis: SOFT DRINK TYPE
Iced Coffee Segment in Asia-Pacific RTD Coffee Market
Iced coffee has emerged as the dominant force in the Asia-Pacific RTD coffee market, commanding approximately 40% of the market share in 2024. This significant market position can be attributed to several factors, including the segment's versatility in offering various flavors and formulations that cater to diverse consumer preferences. The segment's growth is particularly strong in countries like Japan, China, and South Korea, which collectively account for about 80% of iced coffee sales. Manufacturers are actively differentiating their offerings by infusing nutrients like vitamins, minerals, antioxidants, ginseng, and taurine, making iced coffee products more appealing to health-conscious consumers. The segment has also benefited from the rising demand for sugar-free variants, especially in markets like New Zealand, where obesity concerns are driving consumers toward healthier beverage options. Additionally, the segment's success is bolstered by strategic partnerships between manufacturers and retailers, ensuring widespread product availability across various distribution channels.
Cold Brew Coffee Segment in Asia-Pacific RTD Coffee Market
The cold brew coffee segment is demonstrating remarkable growth potential in the Asia-Pacific RTD coffee market. From 2024 to 2029, the segment is projected to maintain a steady growth trajectory of approximately 6% annually. This growth is primarily driven by increasing recognition of cold brew coffee's health benefits and its appeal to younger consumers, particularly millennials, who prefer it as a refreshing alternative to sugary beverages. The segment's expansion is further supported by its sustainability credentials, as the cold brew process requires less energy and water compared to traditional brewing methods. Leading RTD cold brew coffee brands are responding to market demands by introducing innovative products, including low-sugar, dairy-free, and plant-based offerings. The segment's growth is particularly notable in urban areas, where consumers are increasingly gravitating toward premium and functional cold brew RTD coffee products.
Remaining Segments in Soft Drink Type
Other RTD coffee variants, including cappuccino, espresso, and cafe mocha, continue to play a vital role in the market's diversification. These segments are particularly significant in markets where consumers seek traditional coffee experiences in convenient RTD formats. The category has seen considerable innovation in terms of flavoring and dairy-free alternatives, catering to consumers who prefer classic coffee experiences throughout the day. These variants are increasingly competing with traditional beverage choices like tea, alcohol, and sodas, particularly among health-conscious consumers. Manufacturers are enhancing these products by incorporating functional benefits like protein, electrolytes, and collagen, recognizing their potential beyond basic energy provision.
Segment Analysis: PACKAGING TYPE
Glass Bottles Segment in Asia-Pacific RTD Coffee Market
Glass bottles dominate the Asia-Pacific RTD bottled coffee packaging market, commanding approximately 40% market share in 2024. This dominance can be attributed to glass bottles' superior ability to preserve the distinct flavor profiles of RTD coffee drinks and their premium, sophisticated image that appeals to quality-conscious consumers. The segment's popularity is further bolstered by glass's infinite recyclability, making it an attractive choice for eco-conscious consumers. Glass bottles also excel in withstanding high temperatures, a crucial factor for certain types of RTD coffee drinks that require pasteurization or hot filling. Japanese manufacturers, in particular, show a strong preference for glass packaging, with the country accounting for nearly 52% of glass bottle consumption in the region.
PET Bottles Segment in Asia-Pacific RTD Coffee Market
The PET bottles segment is emerging as the most dynamic segment in the Asia-Pacific RTD coffee packaging market, projected to grow at approximately 6% CAGR from 2024 to 2029. This growth trajectory is driven by PET bottles' cost-effectiveness and superior logistics efficiency compared to glass alternatives. The segment's expansion is further supported by technological advancements in PET bottle manufacturing, enabling creative customization options and improved functionality. Manufacturers are increasingly favoring PET bottles due to their durability during transportation and lighter weight, which significantly reduces transportation costs. The segment's growth is particularly pronounced in Vietnam, where environmental regulations and recycling initiatives are driving the adoption of PET packaging solutions.
Remaining Segments in Packaging Type
Metal cans and aseptic packages constitute significant segments in the Asia-Pacific RTD coffee packaging market. Canned coffee is particularly valued for its excellent barrier properties against light and oxygen, ensuring optimal preservation of coffee flavor and quality. The segment benefits from the robust aluminum can recycling infrastructure, especially in countries like Japan. Aseptic packages, on the other hand, are gaining traction due to their ability to preserve beverages without refrigeration and their effectiveness in protecting products from external contamination. Both segments continue to innovate with features like tamper-evident seals and sustainable materials, contributing to the overall market dynamics.
Segment Analysis: DISTRIBUTION CHANNEL
Supermarket/Hypermarket Segment in Asia-Pacific RTD Coffee Market
Supermarkets and hypermarkets maintain their dominance in the Asia-Pacific ready to drink coffee market, commanding approximately 34% market share in 2024. This channel's prominence can be attributed to its ability to offer an extensive range of RTD coffee drinks catering to various age groups and preferences. Major supermarket chains like Woolworths, Coles Group, AEON, 7-Eleven, Carrefour, Big Bazaar, and Costco have established comprehensive networks across the region, effectively reaching potential consumers. The channel's success is further bolstered by its diverse selection of iced coffee options, accommodating various preferences and budgets, with prices ranging from USD 6 to USD 11 and above. This pricing flexibility empowers consumers to purchase RTD coffee drinks according to their preferences and affordability, making supermarkets and hypermarkets the preferred destination for RTD coffee purchases in the region.
Online Retail Segment in Asia-Pacific RTD Coffee Market
The online retail segment is experiencing remarkable growth in the Asia-Pacific RTD coffee market, projected to achieve approximately 8% CAGR from 2024 to 2029. This growth is primarily driven by the increasing internet user base across key markets like India, Japan, and China. Online retailers are capturing consumer attention through user-friendly website designs, mobile apps, and detailed product information, including flavor profiles, ingredients, and nutritional facts. These platforms leverage high-quality visuals and targeted email campaigns to highlight new products, exclusive discounts, and market trends. The convenience of home delivery services further enhances the appeal of online channels. Additionally, these retailers implement cross-selling strategies, suggesting complementary products like snacks or accessories with RTD coffee purchases, creating a comprehensive shopping experience for consumers.
Remaining Segments in Distribution Channel
The RTD coffee market in Asia-Pacific is further served through convenience stores, specialty stores, and on-trade channels, each playing a unique role in market development. Convenience stores focus on strategic locations and promotional displays to capture impulse purchases, while specialty stores differentiate themselves through product curation and expert knowledge. The on-trade segment, comprising cafes, restaurants, and other food service establishments, contributes significantly by offering premium RTD coffee experiences and fostering brand loyalty. These channels collectively create a diverse distribution network that caters to varying consumer preferences and consumption occasions, from quick grab-and-go purchases to sophisticated coffee experiences.
Asia-Pacific Ready to Drink Coffee Market Geography Segment Analysis
RTD Coffee Market in Japan
Japan continues to dominate the Asia-Pacific RTD coffee landscape, commanding approximately 59% of the regional market share. The country's sophisticated coffee culture, deeply embedded in daily routines, drives consistent demand for ready-to-drink coffee products. Japanese consumers demonstrate a strong preference for coffee over other non-alcoholic beverages, including fruit juices, tea, and sports drinks, with over 70% of consumers favoring coffee as their go-to beverage choice. The market's maturity is reflected in its diverse product offerings, ranging from traditional black coffee to innovative flavor combinations. The country's extensive network of vending machines and convenience stores ensures widespread accessibility of RTD coffee products. Japanese manufacturers are continuously innovating, introducing products with reduced sugar content and enhanced functional benefits to cater to health-conscious consumers. The market also benefits from the country's robust cold chain infrastructure, enabling efficient distribution and maintaining product quality.
RTD Coffee Market in Vietnam
Vietnam's RTD coffee market is experiencing remarkable growth, projected to expand at approximately 16% annually from 2024 to 2029. The country's transformation from a traditional coffee producer to a sophisticated coffee consumer market is evident in its rapidly evolving urban landscape. The emergence of premium coffee chains and increasing Western influence has significantly shaped consumer preferences for convenient, ready-to-drink coffee options. Cold brew coffee has gained particular traction among young urban consumers, who appreciate its smooth taste profile and perceived health benefits. Local manufacturers are actively innovating with unique flavor combinations that blend traditional Vietnamese coffee culture with modern consumption preferences. The market's expansion is further supported by the country's robust distribution networks and the increasing presence of international brands. Vietnamese consumers' growing disposable income and busy lifestyles continue to drive the demand for convenient coffee solutions, particularly in major metropolitan areas.
RTD Coffee Market in China
China's RTD coffee market demonstrates remarkable potential, driven by the country's rapidly evolving coffee culture, particularly in first-tier cities. The market's growth is primarily fueled by young urban professionals aged 20-40, who are increasingly embracing coffee as part of their daily routine. Strategic partnerships between retail operators and prominent coffee chains have significantly enhanced product accessibility and visibility. The market is characterized by innovative product launches that cater to local taste preferences while maintaining international quality standards. Chinese consumers show a strong inclination towards premium and innovative RTD coffee products, with a particular interest in unique flavors and functional benefits. The expansion of e-commerce platforms and delivery services has further accelerated market growth, making RTD coffee products more accessible to consumers across different city tiers.
RTD Coffee Market in Thailand
Thailand's RTD coffee market showcases strong growth potential, driven by its young and working-age demographics who increasingly favor ready-to-drink coffee options. The market is characterized by a strong preference for milk-based coffee beverages, with a significant portion of consumers favoring their coffee with milk or cream. Health consciousness is becoming a key factor influencing consumer choices, leading to increased demand for low-sugar and functional RTD coffee variants. The country's well-developed retail infrastructure, including convenience stores and supermarkets, facilitates widespread product availability. Thai consumers demonstrate sophisticated taste preferences, appreciating both local coffee flavors and international coffee trends. The market is witnessing continuous innovation in packaging and product formulations, with manufacturers focusing on premium positioning and health-oriented offerings.
RTD Coffee Market in Other Countries
The RTD coffee market in other Asia-Pacific countries, including Australia, India, Indonesia, Malaysia, and South Korea, exhibits diverse growth patterns influenced by local consumption habits and cultural preferences. These markets are characterized by increasing urbanization, rising disposable incomes, and growing awareness of coffee culture. Each country presents unique opportunities and challenges, with varying levels of market maturity and consumer preferences. The expansion of international coffee chains and local players continues to drive market development in these regions. Consumer preferences range from traditional coffee flavors to innovative fusion products that cater to local tastes. The growing influence of social media and increasing health consciousness among consumers are shaping product development and marketing strategies across these markets. Distribution channels are evolving, with a notable shift towards online retail platforms and convenience stores.
Get Analysis on Important Geographic Markets
Download PDF
Competitive Landscape
Top Companies in Asia-Pacific Ready to Drink Coffee Market
Leading companies in the market are demonstrating a strong commitment to product innovation, particularly focusing on healthier variants with reduced sugar content and functional benefits. Companies are actively expanding their RTD coffee portfolios through new flavor launches and format innovations, including cold brew varieties and dairy-free alternatives. Strategic partnerships, especially between retail operators and coffee chains, have become increasingly common to enhance distribution networks and market penetration. Operational agility is evident in the companies' responses to evolving consumer preferences, with many players investing in R&D facilities across the region to develop market-specific products. Manufacturing facility expansions and modernization initiatives are being undertaken to improve production capabilities and meet growing demand. Companies are also emphasizing sustainable sourcing practices, with many obtaining certifications like Rainforest Alliance and implementing environmentally friendly packaging solutions.
Market Structure Shows Regional Power Dynamics
The Asia-Pacific RTD coffee market exhibits a relatively fragmented structure, characterized by the presence of both global beverage conglomerates and regional specialists. Global players like The Coca-Cola Company, Nestlé, and Suntory Holdings maintain significant market positions through their established brands and extensive distribution networks. Japanese companies hold particularly strong positions in the market, leveraging their deep understanding of Asian consumer preferences and well-developed ready-to-drink coffee culture. These companies are increasingly expanding their presence in emerging markets like Vietnam, Thailand, and Indonesia through strategic partnerships and direct investments.
The market is witnessing ongoing consolidation through strategic acquisitions and partnerships, particularly in high-growth markets. Local players maintain competitive advantages in specific regions through their understanding of local taste preferences and established distribution networks. The competitive landscape is further shaped by the increasing presence of coffee shop chains entering the coffee beverage segment through branded products and retail partnerships. Manufacturing capabilities and distribution infrastructure have become key differentiating factors, with companies investing heavily in both areas to maintain competitive advantages.
Innovation and Distribution Drive Future Success
For incumbent players to maintain and expand their market share, focus on product innovation and distribution channel optimization will be crucial. Companies need to continuously develop new flavors and formats while maintaining strong relationships with retailers and distributors. Investment in sustainable packaging solutions and clean label products will become increasingly important as consumer awareness grows. The ability to quickly respond to changing consumer preferences and maintain operational efficiency across the supply chain will be critical success factors. Companies must also focus on building strong brand equity through effective marketing campaigns and digital engagement strategies.
New entrants and challenger brands can gain ground by focusing on niche market segments and innovative product offerings. Success will depend on developing unique value propositions that address specific consumer needs or preferences not fully served by existing players. Building strong partnerships with local distributors and leveraging e-commerce platforms will be essential for market penetration. Companies must also consider potential regulatory changes regarding sugar content and packaging sustainability, which could impact product formulations and packaging strategies. The ability to maintain product quality while managing costs will be crucial, particularly in price-sensitive markets where competition from traditional coffee formats remains strong.
Asia-Pacific Ready to Drink Coffee Industry Leaders
Kirin Holdings Company, Limited
Nestle S.A.
Suntory Holdings Limited
The Coca-Cola Company
UCC Holdings Co., Ltd.
- *Disclaimer: Major Players sorted in no particular order

Need More Details on Market Players and Competitors?
Download PDF
Recent Industry Developments
- July 2023: Nestlé Thailand has launched the new NESCAFÉ GOLD Creama Craft Latte and NESCAFÉ GOLD Creama Craft Americano in the RTD coffee category in Thailand.
- May 2023: Dare has expanded its range of iced coffees by adding a new miniature 300ml sized format of its popular Double Espresso and No Sugar Added Double Espresso.
- October 2022: Under its brand Dare, Bega Group launched a new limited edition flavor, Dare Intense Espresso RTD coffee. Dare Intense Espresso is available at Woolworths stores in Australia.
Asia-Pacific Ready to Drink Coffee Market Report Scope
Cold Brew Coffee, Iced coffee are covered as segments by Soft Drink Type. Aseptic packages, Glass Bottles, Metal Can, PET Bottles are covered as segments by Packaging Type. Off-trade, On-trade are covered as segments by Distribution Channel. Australia, China, India, Indonesia, Japan, Malaysia, South Korea, Thailand, Vietnam are covered as segments by Country.Soft Drink Type
| Cold Brew Coffee |
| Iced coffee |
| Other RTD Coffee |
Packaging Type
| Aseptic packages |
| Glass Bottles |
| Metal Can |
| PET Bottles |
Distribution Channel
| Off-trade | Convenience Stores |
| Online Retail | |
| Specialty Stores | |
| Supermarket/Hypermarket | |
| Others | |
| On-trade |
Country
| Australia |
| China |
| India |
| Indonesia |
| Japan |
| Malaysia |
| South Korea |
| Thailand |
| Vietnam |
| Rest of Asia-Pacific |
| Soft Drink Type | Cold Brew Coffee | |
| Iced coffee | ||
| Other RTD Coffee | ||
| Packaging Type | Aseptic packages | |
| Glass Bottles | ||
| Metal Can | ||
| PET Bottles | ||
| Distribution Channel | Off-trade | Convenience Stores |
| Online Retail | ||
| Specialty Stores | ||
| Supermarket/Hypermarket | ||
| Others | ||
| On-trade | ||
| Country | Australia | |
| China | ||
| India | ||
| Indonesia | ||
| Japan | ||
| Malaysia | ||
| South Korea | ||
| Thailand | ||
| Vietnam | ||
| Rest of Asia-Pacific | ||
Need A Different Region or Segment?
Customize Now
Market Definition
- Carbonated Soft Drinks (CSDs) - Carbonated soft drinks (CSDs) refer to non-alcoholic beverages that are carbonated and typically flavored, containing dissolved carbon dioxide to create effervescence. These beverages commonly include cola, lemon-lime, orange, and various fruit-flavored sodas. Marketed in cans, bottles, or fountain dispense.
- Juices - We have considered packaged juices which encompass non-alcoholic beverages derived from fruits, vegetables, or a combination thereof, processed and sealed in various packaging formats such as bottles, cartons, or pouches. Excluding fresh juices, this market segment involves commercially prepared and preserved juices, often with added preservatives and flavors.
- Ready-to-Drink (RTD) Tea and RTD Coffee - Ready-to-Drink (RTD) tea and RTD coffee are pre-packaged, non-alcoholic beverages that are brewed and prepared for consumption without further dilution. RTD tea typically includes various tea varieties, infused with flavors and sweeteners, and comes in bottles, cans, or cartons. Similarly, RTD coffee involves pre-brewed coffee formulations, often mixed with milk, sugar, or flavorings, and is conveniently packaged for on-the-go consumption.
- Energy Drinks - Energy drinks are non-alcoholic beverages formulated to provide a quick boost of energy and alertness. Whereas, sports drinks are beverages designed to hydrate and replenish electrolytes, particularly after physical exertion, exercise, or intense activity
| Keyword | Definition |
|---|---|
| Carbonated Soft Drinks | Carbonated soft drinks (CSDs) are a combination of carbonated water and flavouring, sweetened by sugar or a non-sugar sweeteners. |
| Standard Cola | Standard Cola is defined as the original flavor of cola soda. |
| Diet Cola | A cola-based soft drink containing no or low amounts of sugar |
| Fruit Flavored Carbonates | A carbonated beverage prepared from fruit juice/fruit flavor with carbonated water and containing sugar, dextrose, invert sugar or liquid glucose either singly or in combination. It may contain peel oil and fruit essences. |
| Juice | Juice is a drink made from the extraction or pressing of the natural liquid contained in fruit and vegetables. |
| 100% Juice | Fruit/vegetable juice made from fruit in the form of its juice with no water added to make up the volume. It is not permitted to add sugars, sweeteners, preservatives, flavourings or colourings to fruit juice. |
| Juice Drinks (up to 24% Juice) | Fruit/vegetable juice drinks with up to 24% fruits/vegetable extract. |
| Nectars (25-99% Juice) | Juices that can have between 25 and 99% of fruit, with the minimum legal limits defined depending on the type of fruit |
| Juice concentrates | Juice Concentrates are those form of juices when most of this liquid is removed resulting in a thick, syrupy product known as juice concentrate. |
| RTD Coffee | Packaged coffee beverages that are sold in a prepared form and are ready for consumption at the time of purchase. |
| Iced Coffee | An iced coffee is a cold version of coffee, usually a combination of hot espresso and milk with ice added to it. |
| Cold Brew Coffee | Cold brew also called cold water extraction or cold pressing is made by steeping ground coffee in room-temperature water for several hours. |
| RTD Tea | Ready-to-drink (RTD) tea is a packaged tea product ready for immediate consumption without brewing or preparation |
| Iced Tea | Ice tea or iced tea is a drink made from tea without milk but with sugar and sometimes fruit flavourings, drunk cold. |
| Green Tea | Green tea is a tea beverage which promotes mental alertness, relieving digestive symptoms and promoting weight loss. |
| Herbal Tea | Herbal tea beverages are made from the infusion or decoction of herbs, spices, or other plant material in hot water. |
| Energy Drink | A type of drink containing stimulant compounds, usually caffeine, which is marketed as providing mental and physical stimulation. They may or may not be carbonated and may also contain sugar, other sweeteners, or herbal extracts, among numerous possible ingredients. |
| Sugar-free or Low-calories Energy Drinks | Sugar-free or Low-calories Energy Drinks are sugar-free, artificially sweetened energy drinks with few or no calories. |
| Traditional Energy Drink | Traditional Energy Drinks are functional soft drinks containing ingredients designed to boost the consumer's energy. |
| Natural/Oraganic Energy Drinks | Natural/Organic energy drinks are energy drinks free of artificial sweeteners and synthetic colorings. Instead, they contain naturally derived ingredients such as green tea, yerba mate, and botanical extracts. |
| Energy Shots | A small but highly concentrated energy drink that contains large amounts of caffeine and/or other stimulants. The quantity is comparatively smaller compared to energy drinks. |
| Sports Drink | Sports drinks are beverages designed specifically for the rapid supply of fluid, carbohydrates, and electrolytes before, during or after exercise. |
| Isotonic | Isotonic drinks contain similar concentrations of salt and sugar as in the human body, and are designed to quickly replace fluids lost during exercise but with an increase of carbohydrate. |
| Hypertonic | Hypertonic drinks have a higher concentration of salt and sugar than the human body. They are best drunk after exercise as it is important to replace glycogen levels quickly after exercise. |
| Hypotonic | Hypotonic drinks are designed to quickly replace fluids lost during exercise. They have very low carbohydrate content and a lower concentration of salt and sugar than the human body. |
| Electrolyte-Enhanced Water | Electrolyte water is water infused with electrically-charged minerals, such as sodium, potassium, calcium, and magnesium. |
| Protein-based Sport Drinks | Protein-based sports drinks are those sports drinks which has added protein in it that will improve performance and reduce muscle protein breakdown. |
| On-Trade | The on-trade refers to places that sell beverages for immediate consumption on the premises like bars, restaurants, and pubs |
| Off-Trade | Off-trade usually means places like liquor stores, supermarkets and other places where you don't consume the beverage right away. |
| Convenience Store | A retail business that provides the public with a convenient location to quickly purchase a wide variety of consumable products and services, generally food and gasoline. |
| Specialty store | A specialty store is a shop/store that carries a deep assortment of brands, styles, or models within a relatively narrow category of goods |
| Online Retail | Online retail is a type of eCommerce whereby a business sells goods or services directly to consumers from a website. |
| Aseptic Packaging | Aseptic packaging refers to the filling of a cold, commercially sterile product under sterile conditions into a presterilized container and closure under sterile conditions to form a seal that effectively excludes microorganisms. These includes tetra packs, cartons, pouches etc. |
| PET Bottle | PET bottle means a bottle made of polyethylene terephthalate. |
| Metal Cans | Metal containers made of aluminum or tin- plated or zinc-plated steel, which are commonly used for packaging food, beverages or other products. |
| Disposable Cups | Disposable Cup means a cup or other container designed for single use to serve beverages, such as water, cold drinks, hot drinks and alcoholic beverages. |
| Gen Z | A way of referring to the group of people who were born in the late 1990s and early 2000s. |
| Millenial | Anyone born between 1981 and 1996 (ages 23 to 38 in 2019) is considered a Millennial |
| Taurine | Taurine is an amino acid that supports immune health and nervous system function. |
| Bars & Pubs | It is a drinking establishment licensed to serve alcoholic drinks for consumption on the premises. |
| Café | It is a foodservice establishment serving refreshments (mainly coffee) and light meals. |
| On the go | It means doing / dealing with while busily engaged with something and not diverting plans in order to accommodate. |
| Internet Penetration | The Internet Penetration Rate corresponds to the percentage of the total population of a given country or region that uses the Internet. |
| Vending Machine | A machine that dispenses small articles such as food, drinks, or cigarettes when a coin or token is inserted |
| Discount store | A discount store or discounter offers a retail format in which products are sold at prices that are in principle lower than an actual or supposed "full retail price". Discounters rely on bulk purchasing and efficient distribution to keep down costs. |
| Clean Label | Clean label on the beverage market are drinks that are made from few ingredients of natural origin and are not or only slightly processed. |
| Caffeine | An alkaloid compound which is a stimulant of the central nervous system. It is mainly used recreationally, as a mild cognitive enhancer to increase alertness and attentional performance. |
| Extreme sport | Action sports, adventure sports or extreme sports are activities perceived as involving a high degree of risk. |
| High-intensity interval training | It incorporates several rounds that alternate between several minutes of high intensity movements to significantly increase the heart rate to at least 80% of one's maximum heart rate, followed by short periods of lower intensity movements. |
| Shelf life | The length of time for which an item remains usable, fit for consumption, or saleable. |
| Cream Soda | Cream soda is a sweet soft drink. Generally flavored with vanilla and based on the taste of an ice cream float |
| Root Beer | Root beer is a sweet North American soft drink traditionally made using the root bark of the sassafras tree Sassafras albidum or the vine of Smilax ornata as the primary flavor. Root beer is typically, but not exclusively, non-alcoholic, caffeine-free, sweet, and carbonated. |
| Vanilla Soda | A carbonated soft drink flavoured with vanilla. |
| Dairy-Free | A product that does not contain any milk or milk products from cows, sheep or goats. |
| Caffeine-Free Energy Drinks | Caffeine-free energy drinks rely on other ingredients to boost the energy. Popular choices include amino acids, B vitamins, and electrolytes. |
Need More Details on Market Definition?
Ask a Question
Research Methodology
Mordor Intelligence follows a four-step methodology in all our reports.
- Step-1: IDENTIFY KEY VARIABLES: In order to build a robust forecasting methodology, the variables and factors identified in Step 1 are tested against available historical market numbers. Through an iterative process, the variables required for market forecast are set, and the model is built on the basis of these variables.
- Step-2: Build a Market Model: Market-size estimations for the forecast years are in nominal terms. Inflation is not a part of the pricing, and the average selling price (ASP) is kept constant throughout the forecast period for each country.
- Step-3: Validate and Finalize: In this important step, all market numbers, variables, and analyst calls are validated through an extensive network of primary research experts from the market studied. The respondents are selected across levels and functions to generate a holistic picture of the market studied.
- Step-4: Research Outputs: Syndicated reports, custom consulting assignments, databases & subscription platforms

Get More Details On Research Methodology
Download PDF


