
| Study Period | 2017 - 2030 |
| Base Year For Estimation | 2024 |
| Forecast Data Period | 2025 - 2030 |
| Market Size (2025) | USD 8.11 Billion |
| Market Size (2030) | USD 10.96 Billion |
| CAGR (2025 - 2030) | 6.21 % |
| Market Concentration | Low |
Major Players*Disclaimer: Major Players sorted in no particular order |


Asia-Pacific Protein Market Analysis
The Asia-Pacific Protein Market size is estimated at 8.11 billion USD in 2025, and is expected to reach 10.96 billion USD by 2030, growing at a CAGR of 6.21% during the forecast period (2025-2030).
The Asia-Pacific protein market is experiencing a significant transformation driven by changing consumer preferences and lifestyle choices. A notable shift towards plant protein is evident across the region, with China's vegetarian population reaching 2.5 million in 2022 and projected to exceed 3 million by 2024. This trend is particularly pronounced in countries like India, where 24% of the population identifies as strictly vegetarian and 9% as vegan, reflecting a broader regional movement towards protein-rich, plant-based diets. Major retail chains are responding to this shift, with companies like Starbucks, IKEA, and Burger King expanding their vegan protein food offerings across multiple markets.
The health and wellness movement continues to be a significant catalyst for market growth, with consumers increasingly prioritizing protein nutrition as part of their fitness routines. In India, approximately 54% of people engaged in regular exercise in 2021, with 30% incorporating advanced fitness applications and devices into their routines. This fitness trend has created a robust demand for protein supplements and fortified products, particularly among urban consumers. The market has seen a notable correlation between exercise habits and protein consumption, with over 50% of Chinese consumers purchasing protein-enriched snacks specifically for exercise recovery.
Innovation in protein formulation and application has become a key focus area for manufacturers across the region. Companies are developing novel alternative protein sources and improving existing ones to meet diverse consumer needs. The industry has witnessed significant advancement in protein extraction technologies, particularly in plant protein, leading to improved taste profiles and functionality. This innovation extends to the animal feed sector, where sophisticated protein formulations are being developed to support the region's substantial livestock population, currently maintaining approximately 307.42 million cattle heads.
Consumer awareness of sustainable and ethical food choices is reshaping market dynamics, particularly in Southeast Asian countries. In Thailand, a remarkable 67% of consumers expressed interest in reducing meat consumption and increasing sustainable protein intake in 2023, highlighting a growing regional consciousness about the environmental and health implications of dietary choices. This shift is driving investment in sustainable protein production methods and encouraging manufacturers to develop more environmentally responsible protein sources. The trend is particularly evident in the rapid expansion of alternative protein products across retail channels and the increasing integration of plant protein in traditional food products.
Asia-Pacific Protein Market Trends
The share of whey and milk protein is expected to increase in animal protein consumption
- The per capita consumption data given in the graph includes data from Afghanistan, Australia, China, India, Indonesia, Japan, Malaysia, New Zealand, Pakistan, Philippines, the Republic of Korea, Thailand, and Vietnam. Japan has become the main market of whey proteins in the Asian market. Consumers are opting for whey products due to sporting events that took place in the region, like the Olympic Tokyo Games in 2020 and the Rugby World Cup. The sports events and the growing older population in Japan are driving serum consumption as the main protein supplement in sports nutrition and elderly nutrition, respectively. The increasing awareness about the benefits of proteins among the Japanese military is also boosting the consumption of whey proteins. India is one of the fastest-growing countries in the world.
- Currently, the animal protein market in China is witnessing a steady development. With improved living standards in China, consumer safety requirements for food and drugs have improved. China has seen a decline in its pig herd of almost 40% due to the deficit created by African Swine Fever in the last two years and an increase in the importation of animal proteins during the past two years.
- Whey protein concentrates offer versatile benefits, including efficient and easy-to-digest processing and inexpensive applications, which are contributing to India's market growth. They have a wide range of applications in the sports nutrition category. Owing to the increased consumption of sports nutrition among young Indians, the demand for whey protein concentrate also increased. The per capita consumption of whey protein in the country increased to 17.2g in 2022 from 14g in 2017.

Understand The Key Trends Shaping This Market
Download PDF
Milk and meat production majorly contributes as raw material for animal protein ingredient manufacturers
- The raw materials used for animal protein production, such as meat from cattle, chickens, and pigs, along with bone raw milk of cattle and goats, skim milk of cows, and whey powder, are included in the graph given with data extracted from the whole of Asia-Pacific. India is the major milk-producing country in the region, followed by China. In 2021, India produced nearly 96 million tons of cow milk, while China produced around 35 million tons. Concentrated animal feeding operations (CAFOs) or factory farms for dairy production plants are being set up across Asia, many housing thousands of cows, by global and new national dairy corporations often working in partnership with governments. The strongest gains in milk production over the past decade have been registered in Southeast Asia.
- China's milk production in the region increased by 7.06% in 2021 due to improved productivity, as the COVID-19 disruption caused China's production and consumption of milk to grow rapidly. Imports are also showing positive growth due to consumer demand and requirements for the manufacturing industries in China. Skim milk powder, which is majorly used for milk protein production, has increased due to the Chinese food industry's dependence on imported skim milk powder.
- Animal protein from cattle, pigs, and chickens is used for collagen and gelatin production. Production is improving significantly in countries like India and China, and it is supported by government initiatives and the construction of new, modern slaughterhouses across the countries. Overall pig production declined in 2020 as African Swine Fever continued to impact China’s hog industry.

OTHER KEY INDUSTRY TRENDS COVERED IN THE REPORT
- Changing lifestyles, with an increasing number of working women, are boosting the market
- Market competitiveness is boosting the growth
- The sauces segment is expected to maintain the lion's share in the Asia-Pacific market
- Soaring demand for plant-based dairy products within Asia-Pacific countries
- The growing appetite for plant-based meats in Asia-Pacific is expected to boost demand
- Healthy snacking is likely to propel the market
- Increasing demand for ruminant feed, coupled with increasing government initiatives in the industry, is driving the segment
- The consumption growth of plant protein fuels opportunities for key players in the plant protein ingredients segment
- Rising consumption of bakery goods as a meal is driving the industry
- Increased consumer preference for convenient breakfast cereal products
- Premium confectionery is an ongoing market trend
- Increase in elderly population to drive demand
- Increasing developments spiking segmental sales
- Increasing number of health and fitness centers is driving the market
- The demand for natural/organic beauty products is boosting in the segment, owing to consumer shift toward sustainability
- Soy, wheat, and peas contribute majorly as raw materials for plant protein manufacturers
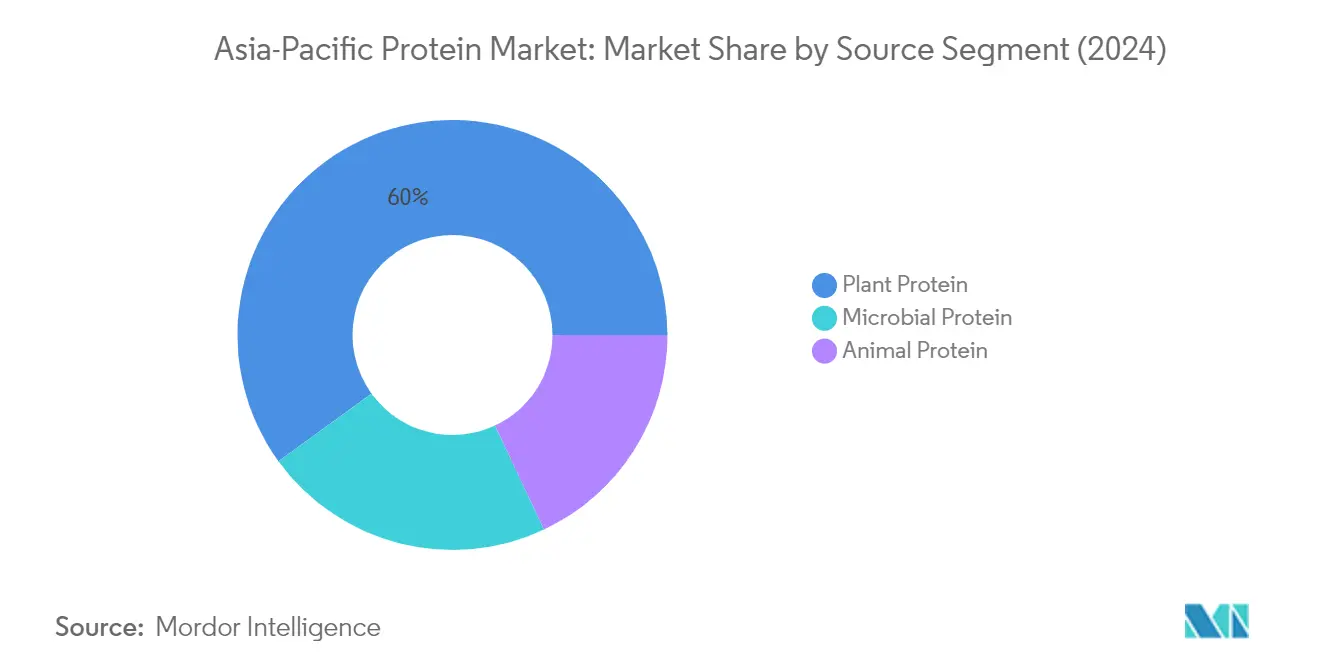
Segment Analysis: Source
Plant Protein Segment in Asia-Pacific Protein Market
The plant protein segment has emerged as the dominant force in the Asia-Pacific protein market, commanding approximately 60% of the total market share in 2024. This substantial market position is primarily driven by the abundant availability of raw materials, growing consumer preference for plant protein-based alternatives, and the segment's cost-effectiveness compared to other protein sources. The segment's growth is particularly notable in countries like China and India, where increasing awareness of sustainable protein nutrition sources and rising veganism have boosted demand. Soy protein leads the plant protein category, especially in the food and beverage sector, where it finds extensive applications in meat alternatives and dairy substitutes. The segment's strong performance is further supported by government initiatives promoting plant protein production and consumption, particularly in major markets like China, where investments in research and development have enhanced the quality and functionality of protein ingredients.
Microbial Protein Segment in Asia-Pacific Protein Market
The microbial protein segment is demonstrating remarkable growth potential in the Asia-Pacific protein market, with a projected growth rate of approximately 5% during 2024-2029. This growth is primarily driven by expanding research activities and increasing consumer acceptance of alternative protein ingredients. Mycoprotein, in particular, is gaining significant traction due to its superior nutritional profile and sustainability benefits. The segment's expansion is supported by technological advancements in fermentation processes and increasing investments in production facilities across the region. Growing concerns over food security and the need for sustainable protein sources have prompted both established companies and startups to explore microbial protein production. Additionally, the relatively lower production costs compared to traditional protein sources and the segment's ability to address environmental concerns are contributing to its accelerated growth trajectory in the region.
Remaining Segments in Source Segmentation
The animal protein segment continues to play a significant role in the Asia-Pacific protein market, particularly in specific applications such as sports protein nutrition and infant formula. This segment encompasses various protein types including whey, casein, collagen, and egg proteins, each serving distinct market needs. The segment's performance is notably influenced by the growing demand for premium animal protein products in the sports nutrition sector and the increasing preference for protein-fortified functional foods. The segment maintains its strong position in traditional markets while adapting to changing consumer preferences through product innovations and improved processing technologies. Despite facing competition from plant-based alternatives, animal proteins remain crucial in applications where specific functional and nutritional properties are required.
Segment Analysis: End User
Food and Beverages Segment in Asia-Pacific Protein Market
The Food and Beverages (F&B) segment dominates the Asia-Pacific protein market, commanding approximately 68% market share in 2024. This substantial market position is primarily driven by the increasing demand for functional protein functionalities and growing awareness about protein-rich diets in the region. The segment's dominance is particularly evident in the meat and dairy alternatives sub-segment, which together capture about 39% of F&B protein consumption. The rising adoption of plant-based food products, especially in countries like China and India, has significantly contributed to this segment's leadership position. Manufacturers are actively expanding their protein-based product portfolios in the retail space, with major companies making significant investments in innovative protein applications across various food and beverage categories.
Personal Care and Cosmetics Segment in Asia-Pacific Protein Market
The Personal Care and Cosmetics segment is emerging as the fastest-growing sector in the Asia-Pacific protein market, projected to expand at approximately 8% CAGR from 2024 to 2029. This remarkable growth is primarily driven by the increasing demand for protein-enriched skincare, body care, and hair care products across the region. The segment's expansion is further fueled by rising consumer awareness about the benefits of protein-based personal care products and the growing trend of clean beauty solutions. Manufacturers are increasingly incorporating various protein types, particularly collagen and other specialized protein ingredients, into their formulations to meet the sophisticated demands of consumers seeking advanced beauty and personal care solutions.
Remaining Segments in End User Segmentation
The Animal Feed and Supplements segments complete the market landscape, each serving distinct but crucial roles in the Asia-Pacific protein market. The Animal Feed segment maintains a significant presence, driven by the region's large livestock industry and increasing demand for high-quality protein feeds, particularly in countries with substantial cattle farming operations like China and India. The Supplements segment, encompassing sports nutrition, baby food, and elderly nutrition, continues to evolve with changing consumer preferences and increasing health consciousness. Both segments are characterized by ongoing innovations in protein formulations and growing demand for specialized protein solutions tailored to specific applications and consumer needs.
Asia-Pacific Protein Market Geography Segment Analysis
Asia-Pacific Protein Market in China
China dominates the Asia-Pacific protein market, holding approximately 33% market share in 2024. The country's protein market is primarily driven by the food and beverage segment, where manufacturers are making significant investments in innovative protein-based products. The increasing demand for protein functionalities and growing awareness about protein-rich diets are key factors stimulating market growth. Major global players like Cargill, Hoafood, and Eat Just have expanded their operations in China, particularly focusing on plant-based alternatives. The country has also witnessed a notable shift in consumer preferences, with a growing emphasis on sustainable and health-conscious protein options. The Chinese government's supportive initiatives and regulations have further strengthened the market's foundation, particularly in areas of food safety and quality standards. The market has also benefited from the rapid expansion of modern retail channels and e-commerce platforms, making protein products more accessible to consumers across different tiers of cities.
Asia-Pacific Protein Market in Thailand
Thailand has emerged as the fastest-growing protein market in the Asia-Pacific region, projected to grow at approximately 7% CAGR from 2024 to 2029. The market's robust growth is primarily driven by increasing health consciousness among Thai consumers, with a significant portion expressing interest in reducing meat consumption and incorporating more plant-based proteins into their diets. The country has witnessed a remarkable transformation in consumer preferences, particularly in urban areas where protein-enriched products are gaining significant traction. Local manufacturers are actively innovating with new protein formulations, especially in traditional Thai food products, to meet the evolving consumer demands. The market has also benefited from Thailand's strong food processing industry and its position as a major food export hub in Southeast Asia. International protein manufacturers are increasingly viewing Thailand as a strategic market, leading to increased investments in production facilities and distribution networks. The government's support for food innovation and healthy eating initiatives has further catalyzed market growth.
Asia-Pacific Protein Market in India
India's protein market has witnessed remarkable evolution, driven by the country's large young population and their increasing demand for high-protein meals. The market has benefited significantly from initiatives like the India Protein Score (IPS), which has boosted protein-related awareness among consumers. The rise of various forms of plant-based protein powders and supplements, including soy, pea, and brown rice proteins, has contributed significantly to market growth. India's position as one of the world's largest milk producers has also strengthened its protein market, particularly in the dairy protein segment. The country's robust agricultural sector, especially in pulse production, provides a strong foundation for plant protein manufacturing. The market has also seen significant innovations in protein-fortified traditional Indian foods, catering to local tastes while maintaining nutritional values. The rapid expansion of modern retail and e-commerce platforms has improved the accessibility of protein products across both urban and rural areas.
Asia-Pacific Protein Market in Japan
Japan's protein market is characterized by sophisticated consumer preferences and high-quality standards. The market has shown a strong inclination towards plant-based proteins, driven by increasing environmental awareness and health consciousness among Japanese consumers. The country's aging population has created unique opportunities in the protein market, particularly in the medical and elderly nutrition segments. Japanese manufacturers have been at the forefront of protein innovation, developing novel formulations that cater to local taste preferences while maintaining nutritional benefits. The market has also benefited from Japan's advanced food technology sector, which has enabled the development of innovative protein-based products. The country's strong focus on functional foods has led to the integration of proteins in various traditional Japanese food products. Additionally, the growing fitness and sports nutrition segments have created new avenues for protein product development, particularly in the ready-to-drink and convenience formats.
Asia-Pacific Protein Market in Other Countries
The protein market in other Asia-Pacific countries, including Malaysia, Vietnam, Indonesia, South Korea, New Zealand, and Australia, exhibits diverse growth patterns influenced by local dietary preferences and economic conditions. These markets are characterized by increasing health awareness and growing demand for protein-enriched products. The rise of modern retail channels and e-commerce platforms has improved product accessibility across these countries. Local manufacturers are focusing on developing protein products that cater to regional tastes and preferences. The markets have also benefited from increasing foreign investments and technological advancements in protein processing. Government initiatives promoting healthy eating habits and sustainable food production have further supported market development in these countries. The growing influence of Western dietary habits, combined with traditional Asian food preferences, has created unique opportunities for protein product innovations.
Get Analysis on Important Geographic Markets
Download PDF
Asia-Pacific Protein Industry Overview
Top Companies in Asia-Pacific Protein Market
The protein market in Asia-Pacific is characterized by continuous product innovations and strategic expansions by key players like Archer Daniels Midland, International Flavors & Fragrances, and Fonterra Co-operative Group. Companies are heavily investing in research and development to create novel protein solutions, particularly in plant-based alternatives and specialized nutritional products. Operational agility is demonstrated through the establishment of innovation centers and collaboration hubs across major markets, enabling rapid response to changing consumer preferences. Strategic moves predominantly focus on strengthening regional presence through local manufacturing facilities and distribution networks. Market leaders are expanding their portfolios through both organic growth and acquisitions, with particular emphasis on emerging segments like sports nutrition and plant-based proteins. The industry witnesses regular launches of new protein variants, formats, and applications, especially in the food and beverage sector.
Fragmented Market with Strong Regional Players
The Asia-Pacific protein market exhibits a fragmented structure with a mix of global conglomerates and regional specialists competing for market share. Global players leverage their extensive research capabilities and established distribution networks, while local companies capitalize on their understanding of regional preferences and established relationships with local suppliers. The market is characterized by the presence of both diversified food ingredient companies and protein specialists, with many players operating across multiple protein categories including plant, animal, and microbial sources. The competitive landscape is further enriched by the presence of innovative startups, particularly in the plant-based protein segment.
Merger and acquisition activities are prominent in the market as companies seek to expand their geographical presence and enhance their technological capabilities. Large companies are actively acquiring regional players to strengthen their market position and gain access to local distribution networks. Vertical integration strategies are being adopted by major players to ensure supply chain control and maintain quality standards. The market also witnesses strategic partnerships between ingredient companies and food manufacturers to develop innovative protein ingredients applications and expand market reach.
Innovation and Sustainability Drive Future Success
Success in the Asia-Pacific protein market increasingly depends on companies' ability to innovate while maintaining sustainable practices. Incumbent players must focus on developing novel protein sources and applications while optimizing their production processes to reduce environmental impact. Companies need to invest in research and development to create differentiated products that address specific nutritional needs and consumer preferences. Building strong relationships with local distributors and maintaining robust quality control systems are crucial for maintaining market position. The ability to adapt to changing regulatory requirements and consumer preferences while maintaining cost competitiveness will be critical for long-term success.
For contenders looking to gain market share, focusing on niche segments and underserved markets presents significant opportunities. New entrants should consider developing specialized protein ingredients solutions for specific applications or consumer groups. Building strong relationships with local agricultural producers and investing in sustainable sourcing practices will be crucial for long-term success. Companies must also prepare for potential regulatory changes, particularly regarding labeling requirements and safety standards for novel protein sources. The ability to offer competitive pricing while maintaining product quality will be essential for gaining market share in this competitive landscape.
Asia-Pacific Protein Market Leaders
-
Archer Daniels Midland Company
-
Darling Ingredients Inc.
-
Fonterra Co-operative Group Limited
-
International Flavors & Fragrances, Inc.
-
Kerry Group plc
- *Disclaimer: Major Players sorted in no particular order

Need More Details on Market Players and Competiters?
Download PDF
Asia-Pacific Protein Market News
- September 2024: Fonterra has opened its sixth application centre in china which enables the rapid launch of innovative product application in response to market trends and local customer's needs.
- August 2024: Global dairy co-operative Fonterra and natural ingredient manufacturer Superbrewed Food have teamed up to boost sustainable food production. The partnership combines Superbrewed’s biomass protein platform with Fonterra’s dairy processing, ingredients, and application expertise to develop additional nutrient-rich, functional biomass protein.
- May 2024: Nitta Gelatin India Limited (NGIL), a collaboration between Nitta Gelatin of Japan and the Kerala State Industrial Development Corporation, initiated its collagen peptide expansion project at its Kakkanad facility. The project involves an investment of INR 200 crore.
Free With This Report
We provide a comprehensive and exhaustive set of data pointers for global, regional, and country-level metrics that illustrate the fundamentals of the protein industry. With the help of 45+ free charts, clients can access in-depth market analysis based on per capita consumption of animal and plant protein, end-user market volume, and production data of raw materials for protein ingredients, through granular-level segmental information supported by a repository of market data, trends, and expert analysis. Data and analysis on protein sources, protein types, forms, end-user segments, etc., are available in the form of comprehensive reports as well as Excel-based data worksheets.


Asia-Pacific Protein Market Report - Table of Contents
1. EXECUTIVE SUMMARY & KEY FINDINGS
2. INTRODUCTION
- 2.1 Study Assumptions & Market Definition
- 2.2 Scope of the Study
- 2.3 Research Methodology
3. KEY INDUSTRY TRENDS
-
3.1 End User Market Volume
- 3.1.1 Baby Food and Infant Formula
- 3.1.2 Bakery
- 3.1.3 Beverages
- 3.1.4 Breakfast Cereals
- 3.1.5 Condiments/Sauces
- 3.1.6 Confectionery
- 3.1.7 Dairy and Dairy Alternative Products
- 3.1.8 Elderly Nutrition and Medical Nutrition
- 3.1.9 Meat/Poultry/Seafood and Meat Alternative Products
- 3.1.10 RTE/RTC Food Products
- 3.1.11 Snacks
- 3.1.12 Sport/Performance Nutrition
- 3.1.13 Animal Feed
- 3.1.14 Personal Care and Cosmetics
-
3.2 Protein Consumption Trends
- 3.2.1 Animal
- 3.2.2 Plant
-
3.3 Production Trends
- 3.3.1 Animal
- 3.3.2 Plant
-
3.4 Regulatory Framework
- 3.4.1 Australia
- 3.4.2 China
- 3.4.3 India
- 3.4.4 Japan
- 3.5 Value Chain & Distribution Channel Analysis
4. MARKET SEGMENTATION (includes market size in Value in USD and Volume, Forecasts up to 2030 and analysis of growth prospects)
-
4.1 Source
- 4.1.1 Animal
- 4.1.1.1 By Protein Type
- 4.1.1.1.1 Casein and Caseinates
- 4.1.1.1.2 Collagen
- 4.1.1.1.3 Egg Protein
- 4.1.1.1.4 Gelatin
- 4.1.1.1.5 Insect Protein
- 4.1.1.1.6 Milk Protein
- 4.1.1.1.7 Whey Protein
- 4.1.1.1.8 Other Animal Protein
- 4.1.2 Microbial
- 4.1.2.1 By Protein Type
- 4.1.2.1.1 Algae Protein
- 4.1.2.1.2 Mycoprotein
- 4.1.3 Plant
- 4.1.3.1 By Protein Type
- 4.1.3.1.1 Hemp Protein
- 4.1.3.1.2 Pea Protein
- 4.1.3.1.3 Potato Protein
- 4.1.3.1.4 Rice Protein
- 4.1.3.1.5 Soy Protein
- 4.1.3.1.6 Wheat Protein
- 4.1.3.1.7 Other Plant Protein
-
4.2 End User
- 4.2.1 Animal Feed
- 4.2.2 Food and Beverages
- 4.2.2.1 By Sub End User
- 4.2.2.1.1 Bakery
- 4.2.2.1.2 Beverages
- 4.2.2.1.3 Breakfast Cereals
- 4.2.2.1.4 Condiments/Sauces
- 4.2.2.1.5 Confectionery
- 4.2.2.1.6 Dairy and Dairy Alternative Products
- 4.2.2.1.7 Meat/Poultry/Seafood and Meat Alternative Products
- 4.2.2.1.8 RTE/RTC Food Products
- 4.2.2.1.9 Snacks
- 4.2.3 Personal Care and Cosmetics
- 4.2.4 Supplements
- 4.2.4.1 By Sub End User
- 4.2.4.1.1 Baby Food and Infant Formula
- 4.2.4.1.2 Elderly Nutrition and Medical Nutrition
- 4.2.4.1.3 Sport/Performance Nutrition
-
4.3 Country
- 4.3.1 Australia
- 4.3.2 China
- 4.3.3 India
- 4.3.4 Indonesia
- 4.3.5 Japan
- 4.3.6 Malaysia
- 4.3.7 New Zealand
- 4.3.8 South Korea
- 4.3.9 Thailand
- 4.3.10 Vietnam
- 4.3.11 Rest of Asia-Pacific
5. COMPETITIVE LANDSCAPE
- 5.1 Key Strategic Moves
- 5.2 Market Share Analysis
- 5.3 Company Landscape
-
5.4 Company Profiles (includes Global Level Overview, Market Level Overview, Core Business Segments, Financials, Headcount, Key Information, Market Rank, Market Share, Products and Services, and Analysis of Recent Developments).
- 5.4.1 Archer Daniels Midland Company
- 5.4.2 Corbion Biotech, Inc.
- 5.4.3 Darling Ingredients Inc.
- 5.4.4 Fonterra Co-operative Group Limited
- 5.4.5 Fuji Oil Group
- 5.4.6 Glanbia PLC
- 5.4.7 Hilmar Cheese Company, Inc.
- 5.4.8 International Flavors & Fragrances, Inc.
- 5.4.9 Kerry Group plc
- 5.4.10 Lacto Japan Co. Ltd.
- 5.4.11 Nagata Group Holdings Ltd
- 5.4.12 Nitta Gelatin Inc.
- 5.4.13 Nutrition Technologies Group
- 5.4.14 Tereos SCA
- 5.4.15 Wilmar International Ltd
6. KEY STRATEGIC QUESTIONS FOR PROTEIN INGREDIENTS INDUSTRY CEOS
7. APPENDIX
-
7.1 Global Overview
- 7.1.1 Overview
- 7.1.2 Porter’s Five Forces Framework
- 7.1.3 Global Value Chain Analysis
- 7.1.4 Market Dynamics (DROs)
- 7.2 Sources & References
- 7.3 List of Tables & Figures
- 7.4 Primary Insights
- 7.5 Data Pack
- 7.6 Glossary of Terms
You Can Purchase Parts Of This Report. Check Out Prices For Specific Sections
Get Price Break-up Now
List of Tables & Figures
- Figure 1:
- VOLUME OF BABY FOOD AND INFANT FORMULA MARKET, METRIC TON, ASIA-PACIFIC, 2017 - 2029
- Figure 2:
- VOLUME OF BAKERY MARKET, METRIC TON, ASIA-PACIFIC, 2017 - 2029
- Figure 3:
- VOLUME OF BEVERAGES MARKET, METRIC TON, ASIA-PACIFIC, 2017 - 2029
- Figure 4:
- VOLUME OF BREAKFAST CEREALS MARKET, METRIC TON, ASIA-PACIFIC, 2017 - 2029
- Figure 5:
- VOLUME OF CONDIMENTS/SAUCES MARKET, METRIC TON, ASIA-PACIFIC, 2017 - 2029
- Figure 6:
- VOLUME OF CONFECTIONERY MARKET, METRIC TON, ASIA-PACIFIC, 2017 - 2029
- Figure 7:
- VOLUME OF DAIRY AND DAIRY ALTERNATIVE PRODUCTS MARKET, METRIC TON, ASIA-PACIFIC, 2017 - 2029
- Figure 8:
- VOLUME OF ELDERLY NUTRITION AND MEDICAL NUTRITION MARKET, METRIC TON, ASIA-PACIFIC, 2017 - 2029
- Figure 9:
- VOLUME OF MEAT/POULTRY/SEAFOOD AND MEAT ALTERNATIVE PRODUCTS MARKET, METRIC TON, ASIA-PACIFIC, 2017 - 2029
- Figure 10:
- VOLUME OF RTE/RTC FOOD PRODUCTS MARKET, METRIC TON, ASIA-PACIFIC, 2017 - 2029
- Figure 11:
- VOLUME OF SNACKS MARKET, METRIC TON, ASIA-PACIFIC, 2017 - 2029
- Figure 12:
- VOLUME OF SPORT/PERFORMANCE NUTRITION MARKET, METRIC TON, ASIA-PACIFIC, 2017 - 2029
- Figure 13:
- VOLUME OF ANIMAL FEED MARKET, METRIC TON, ASIA-PACIFIC, 2017 - 2029
- Figure 14:
- VOLUME OF PERSONAL CARE AND COSMETICS MARKET, METRIC TON, ASIA-PACIFIC, 2017 - 2029
- Figure 15:
- AVERAGE PER CAPITA CONSUMPTION OF ANIMAL PROTEIN, GRAM PER DAY, ASIA-PACIFIC, 2017 - 2029
- Figure 16:
- AVERAGE PER CAPITA CONSUMPTION OF PLANT PROTEIN, GRAM PER DAY, ASIA-PACIFIC, 2017 - 2029
- Figure 17:
- ANIMAL PROTEIN RAW MATERIALS PRODUCTION, METRIC TON, ASIA-PACIFIC, 2017 - 2022
- Figure 18:
- PLANT PROTEIN RAW MATERIALS PRODUCTION, METRIC TON, ASIA-PACIFIC, 2017 - 2022
- Figure 19:
- VOLUME OF PROTEIN MARKET, TONNES, ASIA-PACIFIC, 2017 - 2029
- Figure 20:
- VALUE OF PROTEIN MARKET, USD, ASIA-PACIFIC, 2017 - 2029
- Figure 21:
- VOLUME OF PROTEIN MARKET BY SOURCE, METRIC TONNES, ASIA-PACIFIC, 2017 - 2029
- Figure 22:
- VALUE OF PROTEIN MARKET BY SOURCE, USD, ASIA-PACIFIC, 2017 - 2029
- Figure 23:
- VALUE SHARE OF PROTEIN MARKET BY SOURCE, %, ASIA-PACIFIC, 2017 VS 2023 VS 2029
- Figure 24:
- VOLUME SHARE OF PROTEIN MARKET BY SOURCE, %, ASIA-PACIFIC, 2017 VS 2023 VS 2029
- Figure 25:
- VOLUME OF ANIMAL PROTEIN MARKET BY PROTEIN TYPE, METRIC TONNES, ASIA-PACIFIC, 2017 - 2029
- Figure 26:
- VALUE OF ANIMAL PROTEIN MARKET BY PROTEIN TYPE, USD, ASIA-PACIFIC, 2017 - 2029
- Figure 27:
- VALUE SHARE OF ANIMAL PROTEIN MARKET BY PROTEIN TYPE, %, ASIA-PACIFIC, 2017 VS 2023 VS 2029
- Figure 28:
- VOLUME SHARE OF ANIMAL PROTEIN MARKET BY PROTEIN TYPE, %, ASIA-PACIFIC, 2017 VS 2023 VS 2029
- Figure 29:
- VOLUME OF CASEIN AND CASEINATES MARKET, METRIC TONNES, ASIA-PACIFIC, 2017 - 2029
- Figure 30:
- VALUE OF CASEIN AND CASEINATES MARKET, USD, ASIA-PACIFIC, 2017 - 2029
- Figure 31:
- VALUE SHARE OF CASEIN AND CASEINATES MARKET BY END USER, % CASEIN AND CASEINATES , ASIA-PACIFIC, 2022 VS 2029
- Figure 32:
- VOLUME OF COLLAGEN MARKET, METRIC TONNES, ASIA-PACIFIC, 2017 - 2029
- Figure 33:
- VALUE OF COLLAGEN MARKET, USD, ASIA-PACIFIC, 2017 - 2029
- Figure 34:
- VALUE SHARE OF COLLAGEN MARKET BY END USER, % COLLAGEN , ASIA-PACIFIC, 2022 VS 2029
- Figure 35:
- VOLUME OF EGG PROTEIN MARKET, METRIC TONNES, ASIA-PACIFIC, 2017 - 2029
- Figure 36:
- VALUE OF EGG PROTEIN MARKET, USD, ASIA-PACIFIC, 2017 - 2029
- Figure 37:
- VALUE SHARE OF EGG PROTEIN MARKET BY END USER, % EGG PROTEIN , ASIA-PACIFIC, 2022 VS 2029
- Figure 38:
- VOLUME OF GELATIN MARKET, METRIC TONNES, ASIA-PACIFIC, 2017 - 2029
- Figure 39:
- VALUE OF GELATIN MARKET, USD, ASIA-PACIFIC, 2017 - 2029
- Figure 40:
- VALUE SHARE OF GELATIN MARKET BY END USER, % GELATIN , ASIA-PACIFIC, 2022 VS 2029
- Figure 41:
- VOLUME OF INSECT PROTEIN MARKET, METRIC TONNES, ASIA-PACIFIC, 2017 - 2029
- Figure 42:
- VALUE OF INSECT PROTEIN MARKET, USD, ASIA-PACIFIC, 2017 - 2029
- Figure 43:
- VALUE SHARE OF INSECT PROTEIN MARKET BY END USER, % INSECT PROTEIN , ASIA-PACIFIC, 2022 VS 2029
- Figure 44:
- VOLUME OF MILK PROTEIN MARKET, METRIC TONNES, ASIA-PACIFIC, 2017 - 2029
- Figure 45:
- VALUE OF MILK PROTEIN MARKET, USD, ASIA-PACIFIC, 2017 - 2029
- Figure 46:
- VALUE SHARE OF MILK PROTEIN MARKET BY END USER, % MILK PROTEIN , ASIA-PACIFIC, 2022 VS 2029
- Figure 47:
- VOLUME OF WHEY PROTEIN MARKET, METRIC TONNES, ASIA-PACIFIC, 2017 - 2029
- Figure 48:
- VALUE OF WHEY PROTEIN MARKET, USD, ASIA-PACIFIC, 2017 - 2029
- Figure 49:
- VALUE SHARE OF WHEY PROTEIN MARKET BY END USER, % WHEY PROTEIN , ASIA-PACIFIC, 2022 VS 2029
- Figure 50:
- VOLUME OF OTHER ANIMAL PROTEIN MARKET, METRIC TONNES, ASIA-PACIFIC, 2017 - 2029
- Figure 51:
- VALUE OF OTHER ANIMAL PROTEIN MARKET, USD, ASIA-PACIFIC, 2017 - 2029
- Figure 52:
- VALUE SHARE OF OTHER ANIMAL PROTEIN MARKET BY END USER, % OTHER ANIMAL PROTEIN , ASIA-PACIFIC, 2022 VS 2029
- Figure 53:
- VOLUME OF MICROBIAL PROTEIN MARKET BY PROTEIN TYPE, METRIC TONNES, ASIA-PACIFIC, 2017 - 2029
- Figure 54:
- VALUE OF MICROBIAL PROTEIN MARKET BY PROTEIN TYPE, USD, ASIA-PACIFIC, 2017 - 2029
- Figure 55:
- VALUE SHARE OF MICROBIAL PROTEIN MARKET BY PROTEIN TYPE, %, ASIA-PACIFIC, 2017 VS 2023 VS 2029
- Figure 56:
- VOLUME SHARE OF MICROBIAL PROTEIN MARKET BY PROTEIN TYPE, %, ASIA-PACIFIC, 2017 VS 2023 VS 2029
- Figure 57:
- VOLUME OF ALGAE PROTEIN MARKET, METRIC TONNES, ASIA-PACIFIC, 2017 - 2029
- Figure 58:
- VALUE OF ALGAE PROTEIN MARKET, USD, ASIA-PACIFIC, 2017 - 2029
- Figure 59:
- VALUE SHARE OF ALGAE PROTEIN MARKET BY END USER, % ALGAE PROTEIN , ASIA-PACIFIC, 2022 VS 2029
- Figure 60:
- VOLUME OF MYCOPROTEIN MARKET, METRIC TONNES, ASIA-PACIFIC, 2017 - 2029
- Figure 61:
- VALUE OF MYCOPROTEIN MARKET, USD, ASIA-PACIFIC, 2017 - 2029
- Figure 62:
- VALUE SHARE OF MYCOPROTEIN MARKET BY END USER, % MYCOPROTEIN , ASIA-PACIFIC, 2022 VS 2029
- Figure 63:
- VOLUME OF PLANT PROTEIN MARKET BY PROTEIN TYPE, METRIC TONNES, ASIA-PACIFIC, 2017 - 2029
- Figure 64:
- VALUE OF PLANT PROTEIN MARKET BY PROTEIN TYPE, USD, ASIA-PACIFIC, 2017 - 2029
- Figure 65:
- VALUE SHARE OF PLANT PROTEIN MARKET BY PROTEIN TYPE, %, ASIA-PACIFIC, 2017 VS 2023 VS 2029
- Figure 66:
- VOLUME SHARE OF PLANT PROTEIN MARKET BY PROTEIN TYPE, %, ASIA-PACIFIC, 2017 VS 2023 VS 2029
- Figure 67:
- VOLUME OF HEMP PROTEIN MARKET, METRIC TONNES, ASIA-PACIFIC, 2017 - 2029
- Figure 68:
- VALUE OF HEMP PROTEIN MARKET, USD, ASIA-PACIFIC, 2017 - 2029
- Figure 69:
- VALUE SHARE OF HEMP PROTEIN MARKET BY END USER, % HEMP PROTEIN , ASIA-PACIFIC, 2022 VS 2029
- Figure 70:
- VOLUME OF PEA PROTEIN MARKET, METRIC TONNES, ASIA-PACIFIC, 2017 - 2029
- Figure 71:
- VALUE OF PEA PROTEIN MARKET, USD, ASIA-PACIFIC, 2017 - 2029
- Figure 72:
- VALUE SHARE OF PEA PROTEIN MARKET BY END USER, % PEA PROTEIN , ASIA-PACIFIC, 2022 VS 2029
- Figure 73:
- VOLUME OF POTATO PROTEIN MARKET, METRIC TONNES, ASIA-PACIFIC, 2017 - 2029
- Figure 74:
- VALUE OF POTATO PROTEIN MARKET, USD, ASIA-PACIFIC, 2017 - 2029
- Figure 75:
- VALUE SHARE OF POTATO PROTEIN MARKET BY END USER, % POTATO PROTEIN , ASIA-PACIFIC, 2022 VS 2029
- Figure 76:
- VOLUME OF RICE PROTEIN MARKET, METRIC TONNES, ASIA-PACIFIC, 2017 - 2029
- Figure 77:
- VALUE OF RICE PROTEIN MARKET, USD, ASIA-PACIFIC, 2017 - 2029
- Figure 78:
- VALUE SHARE OF RICE PROTEIN MARKET BY END USER, % RICE PROTEIN , ASIA-PACIFIC, 2022 VS 2029
- Figure 79:
- VOLUME OF SOY PROTEIN MARKET, METRIC TONNES, ASIA-PACIFIC, 2017 - 2029
- Figure 80:
- VALUE OF SOY PROTEIN MARKET, USD, ASIA-PACIFIC, 2017 - 2029
- Figure 81:
- VALUE SHARE OF SOY PROTEIN MARKET BY END USER, % SOY PROTEIN , ASIA-PACIFIC, 2022 VS 2029
- Figure 82:
- VOLUME OF WHEAT PROTEIN MARKET, METRIC TONNES, ASIA-PACIFIC, 2017 - 2029
- Figure 83:
- VALUE OF WHEAT PROTEIN MARKET, USD, ASIA-PACIFIC, 2017 - 2029
- Figure 84:
- VALUE SHARE OF WHEAT PROTEIN MARKET BY END USER, % WHEAT PROTEIN , ASIA-PACIFIC, 2022 VS 2029
- Figure 85:
- VOLUME OF OTHER PLANT PROTEIN MARKET, METRIC TONNES, ASIA-PACIFIC, 2017 - 2029
- Figure 86:
- VALUE OF OTHER PLANT PROTEIN MARKET, USD, ASIA-PACIFIC, 2017 - 2029
- Figure 87:
- VALUE SHARE OF OTHER PLANT PROTEIN MARKET BY END USER, % OTHER PLANT PROTEIN , ASIA-PACIFIC, 2022 VS 2029
- Figure 88:
- VOLUME OF PROTEIN MARKET BY END USER, METRIC TONNES, ASIA-PACIFIC, 2017 - 2029
- Figure 89:
- VALUE OF PROTEIN MARKET BY END USER, USD, ASIA-PACIFIC, 2017 - 2029
- Figure 90:
- VALUE SHARE OF PROTEIN MARKET BY END USER, %, ASIA-PACIFIC, 2017 VS 2023 VS 2029
- Figure 91:
- VOLUME SHARE OF PROTEIN MARKET BY END USER, %, ASIA-PACIFIC, 2017 VS 2023 VS 2029
- Figure 92:
- VOLUME OF PROTEIN MARKET, ANIMAL FEED, ASIA-PACIFIC, 2017 - 2029
- Figure 93:
- VALUE OF PROTEIN MARKET, ANIMAL FEED, ASIA-PACIFIC, 2017 - 2029
- Figure 94:
- VALUE SHARE OF PROTEIN MARKET BY SOURCE, % ANIMAL FEED , ASIA-PACIFIC, 2022 VS 2029
- Figure 95:
- VOLUME OF PROTEIN MARKET, FOOD AND BEVERAGES END USER, METRIC TONNES, ASIA-PACIFIC, 2017 - 2029
- Figure 96:
- VALUE OF PROTEIN MARKET, FOOD AND BEVERAGES END USER, USD, ASIA-PACIFIC, 2017 - 2029
- Figure 97:
- VALUE SHARE OF PROTEIN MARKET BY FOOD AND BEVERAGES END USER, %, ASIA-PACIFIC, 2017 VS 2023 VS 2029
- Figure 98:
- VOLUME SHARE OF PROTEIN MARKET BY FOOD AND BEVERAGES END USER, %, ASIA-PACIFIC, 2017 VS 2023 VS 2029
- Figure 99:
- VOLUME OF PROTEIN MARKET, BAKERY, METRIC TONNES, ASIA-PACIFIC, 2017 - 2029
- Figure 100:
- VALUE OF PROTEIN MARKET, BAKERY, USD, ASIA-PACIFIC, 2017 - 2029
- Figure 101:
- VALUE SHARE OF PROTEIN MARKET BY SOURCE, % BAKERY , ASIA-PACIFIC, 2022 VS 2029
- Figure 102:
- VOLUME OF PROTEIN MARKET, BEVERAGES, METRIC TONNES, ASIA-PACIFIC, 2017 - 2029
- Figure 103:
- VALUE OF PROTEIN MARKET, BEVERAGES, USD, ASIA-PACIFIC, 2017 - 2029
- Figure 104:
- VALUE SHARE OF PROTEIN MARKET BY SOURCE, % BEVERAGES , ASIA-PACIFIC, 2022 VS 2029
- Figure 105:
- VOLUME OF PROTEIN MARKET, BREAKFAST CEREALS, METRIC TONNES, ASIA-PACIFIC, 2017 - 2029
- Figure 106:
- VALUE OF PROTEIN MARKET, BREAKFAST CEREALS, USD, ASIA-PACIFIC, 2017 - 2029
- Figure 107:
- VALUE SHARE OF PROTEIN MARKET BY SOURCE, % BREAKFAST CEREALS , ASIA-PACIFIC, 2022 VS 2029
- Figure 108:
- VOLUME OF PROTEIN MARKET, CONDIMENTS/SAUCES, METRIC TONNES, ASIA-PACIFIC, 2017 - 2029
- Figure 109:
- VALUE OF PROTEIN MARKET, CONDIMENTS/SAUCES, USD, ASIA-PACIFIC, 2017 - 2029
- Figure 110:
- VALUE SHARE OF PROTEIN MARKET BY SOURCE, % CONDIMENTS/SAUCES , ASIA-PACIFIC, 2022 VS 2029
- Figure 111:
- VOLUME OF PROTEIN MARKET, CONFECTIONERY, METRIC TONNES, ASIA-PACIFIC, 2017 - 2029
- Figure 112:
- VALUE OF PROTEIN MARKET, CONFECTIONERY, USD, ASIA-PACIFIC, 2017 - 2029
- Figure 113:
- VALUE SHARE OF PROTEIN MARKET BY SOURCE, % CONFECTIONERY , ASIA-PACIFIC, 2022 VS 2029
- Figure 114:
- VOLUME OF PROTEIN MARKET, DAIRY AND DAIRY ALTERNATIVE PRODUCTS, METRIC TONNES, ASIA-PACIFIC, 2017 - 2029
- Figure 115:
- VALUE OF PROTEIN MARKET, DAIRY AND DAIRY ALTERNATIVE PRODUCTS, USD, ASIA-PACIFIC, 2017 - 2029
- Figure 116:
- VALUE SHARE OF PROTEIN MARKET BY SOURCE, % DAIRY AND DAIRY ALTERNATIVE PRODUCTS , ASIA-PACIFIC, 2022 VS 2029
- Figure 117:
- VOLUME OF PROTEIN MARKET, MEAT/POULTRY/SEAFOOD AND MEAT ALTERNATIVE PRODUCTS, METRIC TONNES, ASIA-PACIFIC, 2017 - 2029
- Figure 118:
- VALUE OF PROTEIN MARKET, MEAT/POULTRY/SEAFOOD AND MEAT ALTERNATIVE PRODUCTS, USD, ASIA-PACIFIC, 2017 - 2029
- Figure 119:
- VALUE SHARE OF PROTEIN MARKET BY SOURCE, % MEAT/POULTRY/SEAFOOD AND MEAT ALTERNATIVE PRODUCTS , ASIA-PACIFIC, 2022 VS 2029
- Figure 120:
- VOLUME OF PROTEIN MARKET, RTE/RTC FOOD PRODUCTS, METRIC TONNES, ASIA-PACIFIC, 2017 - 2029
- Figure 121:
- VALUE OF PROTEIN MARKET, RTE/RTC FOOD PRODUCTS, USD, ASIA-PACIFIC, 2017 - 2029
- Figure 122:
- VALUE SHARE OF PROTEIN MARKET BY SOURCE, % RTE/RTC FOOD PRODUCTS , ASIA-PACIFIC, 2022 VS 2029
- Figure 123:
- VOLUME OF PROTEIN MARKET, SNACKS, METRIC TONNES, ASIA-PACIFIC, 2017 - 2029
- Figure 124:
- VALUE OF PROTEIN MARKET, SNACKS, USD, ASIA-PACIFIC, 2017 - 2029
- Figure 125:
- VALUE SHARE OF PROTEIN MARKET BY SOURCE, % SNACKS , ASIA-PACIFIC, 2022 VS 2029
- Figure 126:
- VOLUME OF PROTEIN MARKET, PERSONAL CARE AND COSMETICS, ASIA-PACIFIC, 2017 - 2029
- Figure 127:
- VALUE OF PROTEIN MARKET, PERSONAL CARE AND COSMETICS, ASIA-PACIFIC, 2017 - 2029
- Figure 128:
- VALUE SHARE OF PROTEIN MARKET BY SOURCE, % PERSONAL CARE AND COSMETICS , ASIA-PACIFIC, 2022 VS 2029
- Figure 129:
- VOLUME OF PROTEIN MARKET, SUPPLEMENTS END USER, METRIC TONNES, ASIA-PACIFIC, 2017 - 2029
- Figure 130:
- VALUE OF PROTEIN MARKET, SUPPLEMENTS END USER, USD, ASIA-PACIFIC, 2017 - 2029
- Figure 131:
- VALUE SHARE OF PROTEIN MARKET BY SUPPLEMENTS END USER, %, ASIA-PACIFIC, 2017 VS 2023 VS 2029
- Figure 132:
- VOLUME SHARE OF PROTEIN MARKET BY SUPPLEMENTS END USER, %, ASIA-PACIFIC, 2017 VS 2023 VS 2029
- Figure 133:
- VOLUME OF PROTEIN MARKET, BABY FOOD AND INFANT FORMULA, METRIC TONNES, ASIA-PACIFIC, 2017 - 2029
- Figure 134:
- VALUE OF PROTEIN MARKET, BABY FOOD AND INFANT FORMULA, USD, ASIA-PACIFIC, 2017 - 2029
- Figure 135:
- VALUE SHARE OF PROTEIN MARKET BY SOURCE, % BABY FOOD AND INFANT FORMULA , ASIA-PACIFIC, 2022 VS 2029
- Figure 136:
- VOLUME OF PROTEIN MARKET, ELDERLY NUTRITION AND MEDICAL NUTRITION, METRIC TONNES, ASIA-PACIFIC, 2017 - 2029
- Figure 137:
- VALUE OF PROTEIN MARKET, ELDERLY NUTRITION AND MEDICAL NUTRITION, USD, ASIA-PACIFIC, 2017 - 2029
- Figure 138:
- VALUE SHARE OF PROTEIN MARKET BY SOURCE, % ELDERLY NUTRITION AND MEDICAL NUTRITION , ASIA-PACIFIC, 2022 VS 2029
- Figure 139:
- VOLUME OF PROTEIN MARKET, SPORT/PERFORMANCE NUTRITION, METRIC TONNES, ASIA-PACIFIC, 2017 - 2029
- Figure 140:
- VALUE OF PROTEIN MARKET, SPORT/PERFORMANCE NUTRITION, USD, ASIA-PACIFIC, 2017 - 2029
- Figure 141:
- VALUE SHARE OF PROTEIN MARKET BY SOURCE, % SPORT/PERFORMANCE NUTRITION , ASIA-PACIFIC, 2022 VS 2029
- Figure 142:
- VOLUME OF PROTEIN MARKET BY COUNTRY, METRIC TONNES, ASIA-PACIFIC, 2017 - 2029
- Figure 143:
- VALUE OF PROTEIN MARKET BY COUNTRY, USD, ASIA-PACIFIC, 2017 - 2029
- Figure 144:
- VALUE SHARE OF PROTEIN MARKET BY COUNTRY, %, ASIA-PACIFIC, 2017 VS 2023 VS 2029
- Figure 145:
- VOLUME SHARE OF PROTEIN MARKET BY COUNTRY, %, ASIA-PACIFIC, 2017 VS 2023 VS 2029
- Figure 146:
- VOLUME OF PROTEIN MARKET, METRIC TONNES, AUSTRALIA, 2017 - 2029
- Figure 147:
- VALUE OF PROTEIN MARKET, USD, AUSTRALIA, 2017 - 2029
- Figure 148:
- VALUE SHARE OF PROTEIN MARKET BY SOURCE, % , AUSTRALIA, 2022 VS 2029
- Figure 149:
- VOLUME OF PROTEIN MARKET, METRIC TONNES, CHINA, 2017 - 2029
- Figure 150:
- VALUE OF PROTEIN MARKET, USD, CHINA, 2017 - 2029
- Figure 151:
- VALUE SHARE OF PROTEIN MARKET BY SOURCE, % , CHINA, 2022 VS 2029
- Figure 152:
- VOLUME OF PROTEIN MARKET, METRIC TONNES, INDIA, 2017 - 2029
- Figure 153:
- VALUE OF PROTEIN MARKET, USD, INDIA, 2017 - 2029
- Figure 154:
- VALUE SHARE OF PROTEIN MARKET BY SOURCE, % , INDIA, 2022 VS 2029
- Figure 155:
- VOLUME OF PROTEIN MARKET, METRIC TONNES, INDONESIA, 2017 - 2029
- Figure 156:
- VALUE OF PROTEIN MARKET, USD, INDONESIA, 2017 - 2029
- Figure 157:
- VALUE SHARE OF PROTEIN MARKET BY SOURCE, % , INDONESIA, 2022 VS 2029
- Figure 158:
- VOLUME OF PROTEIN MARKET, METRIC TONNES, JAPAN, 2017 - 2029
- Figure 159:
- VALUE OF PROTEIN MARKET, USD, JAPAN, 2017 - 2029
- Figure 160:
- VALUE SHARE OF PROTEIN MARKET BY SOURCE, % , JAPAN, 2022 VS 2029
- Figure 161:
- VOLUME OF PROTEIN MARKET, METRIC TONNES, MALAYSIA, 2017 - 2029
- Figure 162:
- VALUE OF PROTEIN MARKET, USD, MALAYSIA, 2017 - 2029
- Figure 163:
- VALUE SHARE OF PROTEIN MARKET BY SOURCE, % , MALAYSIA, 2022 VS 2029
- Figure 164:
- VOLUME OF PROTEIN MARKET, METRIC TONNES, NEW ZEALAND, 2017 - 2029
- Figure 165:
- VALUE OF PROTEIN MARKET, USD, NEW ZEALAND, 2017 - 2029
- Figure 166:
- VALUE SHARE OF PROTEIN MARKET BY SOURCE, % , NEW ZEALAND, 2022 VS 2029
- Figure 167:
- VOLUME OF PROTEIN MARKET, METRIC TONNES, SOUTH KOREA, 2017 - 2029
- Figure 168:
- VALUE OF PROTEIN MARKET, USD, SOUTH KOREA, 2017 - 2029
- Figure 169:
- VALUE SHARE OF PROTEIN MARKET BY SOURCE, % , SOUTH KOREA, 2022 VS 2029
- Figure 170:
- VOLUME OF PROTEIN MARKET, METRIC TONNES, THAILAND, 2017 - 2029
- Figure 171:
- VALUE OF PROTEIN MARKET, USD, THAILAND, 2017 - 2029
- Figure 172:
- VALUE SHARE OF PROTEIN MARKET BY SOURCE, % , THAILAND, 2022 VS 2029
- Figure 173:
- VOLUME OF PROTEIN MARKET, METRIC TONNES, VIETNAM, 2017 - 2029
- Figure 174:
- VALUE OF PROTEIN MARKET, USD, VIETNAM, 2017 - 2029
- Figure 175:
- VALUE SHARE OF PROTEIN MARKET BY SOURCE, % , VIETNAM, 2022 VS 2029
- Figure 176:
- VOLUME OF PROTEIN MARKET, METRIC TONNES, REST OF ASIA-PACIFIC, 2017 - 2029
- Figure 177:
- VALUE OF PROTEIN MARKET, USD, REST OF ASIA-PACIFIC, 2017 - 2029
- Figure 178:
- VALUE SHARE OF PROTEIN MARKET BY SOURCE, % , REST OF ASIA-PACIFIC, 2022 VS 2029
- Figure 179:
- MOST ACTIVE COMPANIES BY NUMBER OF STRATEGIC MOVES, COUNT, ASIA-PACIFIC PROTEIN MARKET, 2017 - 2022
- Figure 180:
- MOST ADOPTED STRATEGIES, COUNT, ASIA-PACIFIC, 2017 - 2022
- Figure 181:
- VALUE SHARE OF MAJOR PLAYERS, %, ASIA-PACIFIC PROTEIN MARKET
Asia-Pacific Protein Industry Segmentation
Animal, Microbial, Plant are covered as segments by Source. Animal Feed, Food and Beverages, Personal Care and Cosmetics, Supplements are covered as segments by End User. Australia, China, India, Indonesia, Japan, Malaysia, New Zealand, South Korea, Thailand, Vietnam are covered as segments by Country.| Source | Animal | By Protein Type | Casein and Caseinates | |
| Collagen | ||||
| Egg Protein | ||||
| Gelatin | ||||
| Insect Protein | ||||
| Milk Protein | ||||
| Whey Protein | ||||
| Other Animal Protein | ||||
| Microbial | By Protein Type | Algae Protein | ||
| Mycoprotein | ||||
| Plant | By Protein Type | Hemp Protein | ||
| Pea Protein | ||||
| Potato Protein | ||||
| Rice Protein | ||||
| Soy Protein | ||||
| Wheat Protein | ||||
| Other Plant Protein | ||||
| End User | Animal Feed | |||
| Food and Beverages | By Sub End User | Bakery | ||
| Beverages | ||||
| Breakfast Cereals | ||||
| Condiments/Sauces | ||||
| Confectionery | ||||
| Dairy and Dairy Alternative Products | ||||
| Meat/Poultry/Seafood and Meat Alternative Products | ||||
| RTE/RTC Food Products | ||||
| Snacks | ||||
| Personal Care and Cosmetics | ||||
| Supplements | By Sub End User | Baby Food and Infant Formula | ||
| Elderly Nutrition and Medical Nutrition | ||||
| Sport/Performance Nutrition | ||||
| Country | Australia | |||
| China | ||||
| India | ||||
| Indonesia | ||||
| Japan | ||||
| Malaysia | ||||
| New Zealand | ||||
| South Korea | ||||
| Thailand | ||||
| Vietnam | ||||
| Rest of Asia-Pacific | ||||
Need A Different Region or Segment?
Customize Now
Market Definition
- End User - The Protein Ingredients Market operates on a B2B basis. Food, Beverages, Supplements, Animal Feed, and Personal Care & Cosmetic manufacturers are considered to be end-consumers in the market studied. The scope excludes manufacturers buying liquid/dry whey to be used for application as a binding agent or thickener or other non-protein applications.
- Penetration Rate - Penetration Rate is defined as the percentage of Protein-Fortified End User Market Volume in the Overall End User Market Volume.
- Average Protein Content - Average protein content is the average protein content present per 100 g of product manufactured by all end-user companies considered under the scope of this report.
- End User Market Volume - End-user market volume is the consolidated volume of all types and forms of end-user products in the country or region.
| Keyword | Definition |
|---|---|
| Alpha-lactalbumin (α-Lactalbumin) | It is a protein that regulates the production of lactose in the milk of almost all mammalian species. |
| Amino acid | It is an organic compound that contains both amino and carboxylic acid functional groups, which are required for the synthesis of body protein and other important nitrogen-containing compounds, such as creatine, peptide hormones, and some neurotransmitters. |
| Blanching | It is the process of briefly heating vegetables with steam or boiling water. |
| BRC | British Retail Consortium |
| Bread improver | It is a flour-based blend of several components with specific functional properties designed to modify dough characteristics and give quality attributes to bread. |
| BSF | Black Soldier Fly |
| Caseinate | It is a substance produced by adding an alkali to acid casein, a derivative of casein. |
| Celiac disease | Celiac disease is an immune reaction to eating gluten, a protein found in wheat, barley, and rye. |
| Colostrum | It is a milky fluid that’s released by mammals that have recently given birth before breast milk production begins. |
| Concentrate | It is the least processed form of protein and has a protein content ranging from 40-90% by weight. |
| Dry protein basis | It refers to the percentage of "pure protein" present in a supplement after the water in it is completely removed through heat. |
| Dry whey | It is the product resulting from drying fresh whey which has been pasteurized and to which nothing has been added as a preservative. |
| Egg protein | It is a mixture of individual proteins, including ovalbumin, ovomucoid, ovoglobulin, conalbumin, vitellin, and vitellenin. |
| Emulsifier | It is a food additive that facilitates the blending of foods that are immiscible with one another, such as oil and water. |
| Enrichment | It is the process of addition of micronutrients that are lost during the processing of the product. |
| ERS | Economic Research Service of the USDA |
| Extrusion | It is the process of forcing soft mixed ingredients through an opening in a perforated plate or die designed to produce the required shape. The extruded food is then cut to a specific size by blades. |
| Fava | Also known as Faba, it is another word for yellow split beans. |
| FDA | Food and Drug Administration |
| Flaking | It is a process in which typically a cereal grain (like corn, wheat, or rice) is broken down into grits, cooked with flavors and syrups, and then pressed into flakes between cooled rollers. |
| Foaming agent | It is a food ingredient that makes it possible to form or maintain a uniform dispersion of a gaseous phase in a liquid or solid food. |
| Foodservice | It refers to the part of the food industry which includes businesses, institutions, and companies which prepare meals outside the home. It includes restaurants, school and hospital cafeterias, catering operations, and many other formats. |
| Fortification | It is the deliberate addition of micronutrients that are not found in them naturally or which are lost during processing, to improve a food product's nutritional value. |
| FSANZ | Food Standards Australia New Zealand |
| FSIS | Food Safety and Inspection Service |
| FSSAI | Food Safety and Standards Authority of India |
| Gelling agent | It is an ingredient that functions as a stabilizer and thickener to provide thickening without stiffness through the formation of gel. |
| GHG | Greenhouse Gas |
| Gluten | It is a family of proteins found in grains, including wheat, rye, spelt, and barley. |
| Hemp | It is a botanical class of Cannabis sativa cultivars grown specifically for industrial or medicinal use. |
| Hydrolysate | It is a form of protein manufactured by exposing the protein to enzymes that can partially break the bonds between the protein's amino acids and break down large, complicated proteins into smaller pieces. Its processing makes it easier and quicker to digest. |
| Hypoallergenic | It refers to a substance that causes fewer allergic reactions. |
| Isolate | It is the purest and most processed form of protein which has undergone separation to obtain a pure protein fraction. It typically contains ≥ 90% of protein by weight. |
| Keratin | It is a protein that helps form hair, nails, and the outer layer of skin. |
| Lactalbumin | It is the albumin contained in milk and obtained from whey. |
| Lactoferrin | It is an iron‑binding glycoprotein that is present in the milk of most mammals. |
| Lupin | It is the yellow legume seeds of the genus Lupinus. |
| Millenial | Also known as Generation Y or Gen Y, it refers to the people born from 1981 to 1996. |
| Monogastric | It refers to an animal with a single-compartmented stomach. Examples of monogastric include humans, poultry, pigs, horses, rabbits, dogs, and cats. Most monogastric are generally unable to digest much cellulose food materials such as grasses. |
| MPC | Milk protein concentrate |
| MPI | Milk protein isolate |
| MSPI | Methylated soy protein isolate |
| Mycoprotein | Mycoprotein is a form of single-cell protein, also known as fungal protein, derived from fungi for human consumption. |
| Nutricosmetics | It is a category of products and ingredients that act as nutritional supplements to care for skin, nails, and hair natural beauty. |
| Osteoporosis | It is a medical condition in which the bones become brittle and fragile from loss of tissue, typically as a result of hormonal changes, or deficiency of calcium or vitamin D. |
| PDCAAS | Protein digestibility-corrected amino acid score (PDCAAS) is a method of evaluating the quality of a protein based on both the amino acid requirements of humans and their ability to digest it. |
| Per-capita consumption of animal protein | It is the average amount of animal protein (such as milk, whey, gelatin, collagen, and egg proteins) that is readily available for consumption by each person in an actual population. |
| Per-capita consumption of plant protein | It is the average amount of plant protein (such as soy, wheat, pea, oat, and hemp proteins) that is readily available for consumption by each person in an actual population. |
| Quorn | It is a microbial protein manufactured using mycoprotein as an ingredient, in which the fungus culture is dried and mixed with egg albumen or potato protein, which acts as a binder, and then is adjusted in texture and pressed into various forms. |
| Ready-to-Cook (RTC) | It refers to food products that include all of the ingredients, where some preparation or cooking is required through a process that is given on the package. |
| Ready-to-Eat (RTE) | It refers to a food product prepared or cooked in advance, with no further cooking or preparation required before being eaten. |
| RTD | Ready-to-Drink |
| RTS | Ready-to-Serve |
| Saturated fat | It is a type of fat in which the fatty acid chains have all single bonds. It is generally considered unhealthy. |
| Sausage | It is a meat product made of finely chopped and seasoned meat, which may be fresh, smoked, or pickled and which is then usually stuffed into a casing. |
| Seitan | It is a plant-based meat substitute made out of wheat gluten. |
| Softgel | It is a gelatin-based capsule with a liquid fill. |
| SPC | Soy protein concentrate |
| SPI | Soy protein isolate |
| Spirulina | It is a biomass of cyanobacteria that can be consumed by humans and animals. |
| Stabilizer | It is an ingredient added to food products to help maintain or enhance their original texture, and physical and chemical characteristics. |
| Supplementation | It is the consumption or provision of concentrated sources of nutrients or other substances that are intended to supplement nutrients in the diet and is intended to correct nutritional deficiencies. |
| Texturant | It is a specific type of food ingredient that is used to control and alter the mouthfeel and texture of food and beverage products. |
| Thickener | It is an ingredient that is used to increase the viscosity of a liquid or dough and make it thicker, without substantially changing its other properties. |
| Trans fat | Also called trans-unsaturated fatty acids or trans fatty acids, it is a type of unsaturated fat that naturally occurs in small amounts in meat. |
| TSP | Textured soy protein |
| TVP | Textured vegetable protein |
| WPC | Whey protein concentrate |
| WPI | Whey protein isolate |
Need More Details on Market Definition?
Ask a Question
Research Methodology
Mordor Intelligence follows a four-step methodology in all our reports.
- Step-1: Identify Key Variables: The quantifiable key variables (industry and extraneous) pertaining to the specific product segment and country are selected from a group of relevant variables & factors based on desk research & literature review; along with primary expert inputs. These variables are further confirmed through regression modeling (wherever required).
- Step-2: Build a Market Model: In order to build a robust forecasting methodology, the variables and factors identified in Step-1 are tested against available historical market numbers. Through an iterative process, the variables required for market forecast are set and the model is built on the basis of these variables.
- Step-3: Validate and Finalize: In this important step, all market numbers, variables and analyst calls are validated through an extensive network of primary research experts from the market studied. The respondents are selected across levels and functions to generate a holistic picture of the market studied.
- Step-4: Research Outputs: Syndicated Reports, Custom Consulting Assignments, Databases & Subscription Platforms

Get More Details On Research Methodology
Download PDF


