
Market Overview
| Study Period | 2020 - 2031 |
|---|---|
| Forecast Data Period | 2026 - 2031 |
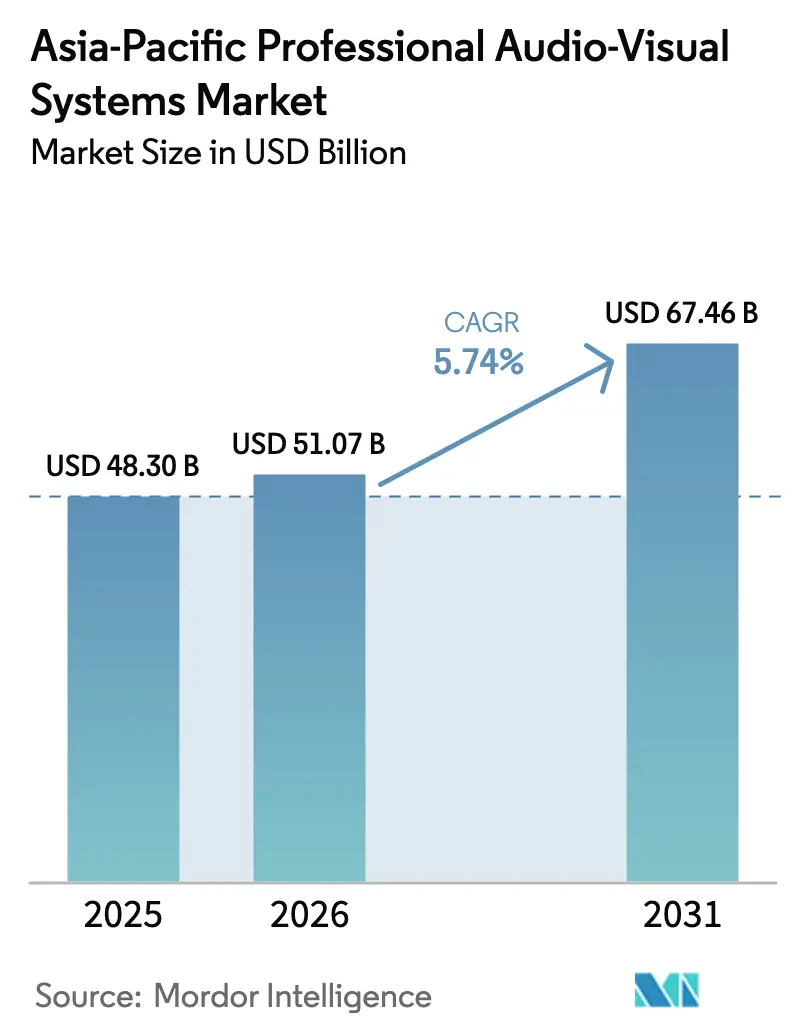
| Base Year Market Size (2025) | USD 48.3 Billion |
| Market Size (2026) | USD 51.07 Billion |
| Market Size (2031) | USD 67.46 Billion |
| Growth Rate (2026 - 2031) | 5.74 % |
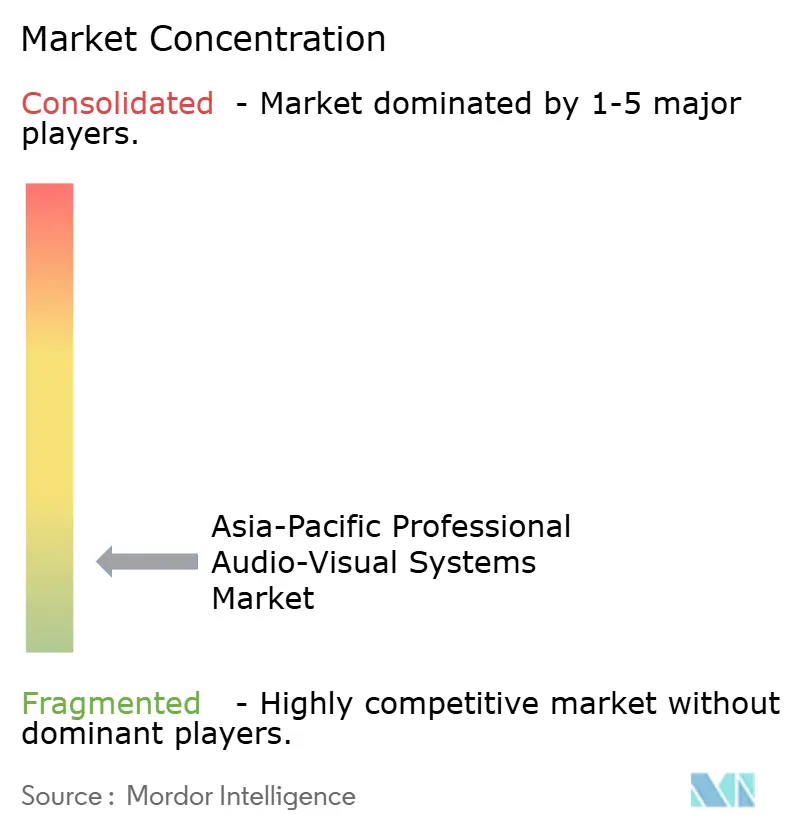
| Market Concentration | Low |
Major Players *Disclaimer: Major Players sorted in no particular order Image © Mordor Intelligence. Reuse requires attribution under CC BY 4.0. | |
Asia-Pacific Professional Audio-Visual Systems Market Analysis by Mordor Intelligence
The Asia-Pacific professional audio-visual system market size is expected to grow from USD 48.3 billion in 2025 to USD 51.07 billion in 2026 and is forecast to reach USD 67.46 billion by 2031 at 5.74% CAGR over 2026-2031. Rising digital-first business models, fast-tracking of cloud-native unified communications, and rapid 5G build-outs are reinforcing steady demand even as supply-chain friction persists. Hybrid work policies create sustained pull for platform-agnostic meeting spaces, while experiential retail and concert tourism encourage larger display footprints and immersive audio upgrades. Consolidation exemplified by Samsung’s 2025 purchase of Bowers & Wilkins, Denon, and Marantz, shows incumbents vertically integrating to manage component risk and own premium IP. Live-event recovery is energizing rental and staging refresh cycles, whereas government-funded “smart classroom” projects keep interactive learning hardware on a multi-year replacement curve.
Key Report Takeaways
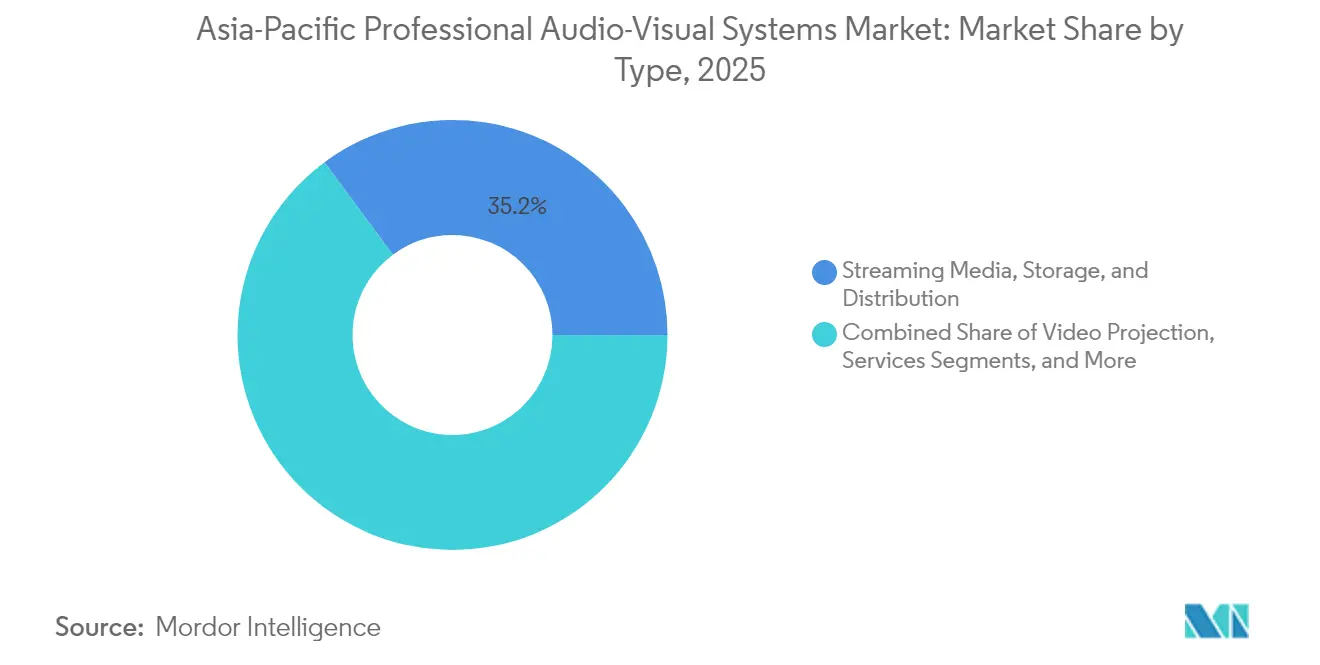
- By type, Streaming Media, Storage, and Distribution captured 35.15% of the Asia-Pacific professional audio-visual system market share in 2025, while Capture and Production Equipment is forecast to advance at a 6.62% CAGR through 2031.
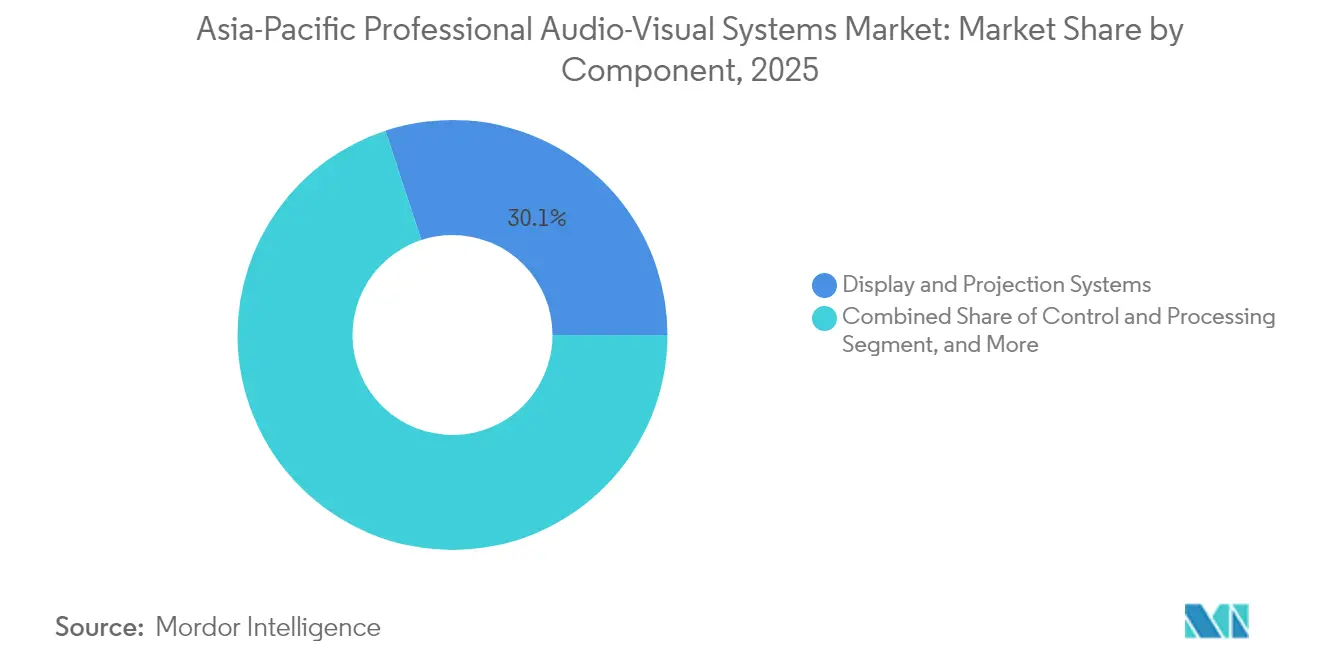
- By component, Display and Projection Systems accounted for a 30.05% share of the Asia-Pacific professional audio-visual system market size in 2025; Audio Equipment is projected to post a 7.01% CAGR from 2026-2031.
- By end-user vertical, Corporate offices held 29.35% revenue share in 2025, whereas Venues and Events is set to grow at 6.84% CAGR through 2031.
- By geography, China led with 38.35% of the Asia-Pacific professional audio-visual system market share in 2025; India is slated to register the fastest 7.22% CAGR to 2031.
Note: Market size and forecast figures in this report are generated using Mordor Intelligence’s proprietary estimation framework, updated with the latest available data and insights as of 2026.
Market Trends and Insights
Drivers Impact Analysis of Asia-Pacific Professional Audio-Visual Systems Market*
| DRIVER | (~) % IMPACT ON CAGR FORECAST | GEOGRAPHIC RELEVANCE | IMPACT TIMELINE |
|---|---|---|---|
| Hybrid-workplace demand for cloud-native UC suites | +1.2% | China, Japan, South Korea | Medium term (2-4 years) |
| Expansion of digital signage in experiential retail | +0.9% | Core Asia-Pacific, spillover to emerging markets | Short term (≤ 2 years) |
| Government-led “smart classroom” capex | +1.1% | India, Southeast Asia | Long term (≥ 4 years) |
| Live event rebound lifts rental and staging | +0.8% | Singapore, Hong Kong, Tokyo | Short term (≤ 2 years) |
| 5G-enabled remote production and AVoIP | +1.0% | China, Japan, South Korea | Medium term (2-4 years) |
| Carbon-neutral procurement mandates | +0.7% | Developed Asia-Pacific with Europe trade exposure | Long term (≥ 4 years) |
| Source: Mordor Intelligence | |||
Hybrid-workplace demand for cloud-native UC suites
Enterprises across the Asia-Pacific professional audio-visual system market are standardizing on Microsoft Teams Rooms and similar platforms, prompting integrators to deliver turnkey packages that blend cameras, microphones, interactive displays, and AI-driven sound processing.[1] Spatial audio functions and automated framing make meetings more inclusive for distributed employees, a priority for Chinese and Japanese multinationals managing cross-border teams. Converged AV-IT networks also streamline managed services, cutting truck-roll costs for facility managers and helping corporations meet internal carbon-reduction goals through power-optimized device scheduling.
Expansion of digital signage in experiential retail
Interactive LED façades and 8K videowalls are transforming flagship stores, with regional retailers using large-format displays to bridge physical shopping and social-commerce engagement. The Asia-Pacific professional audio-visual system market benefits from falling pixel-pitch pricing and higher-efficiency micro-LED modules that meet sustainability regulations without sacrificing brightness. Post-pandemic safety messaging hastened display roll-outs, and content management software now integrates occupancy sensors to trigger real-time visual prompts, a feature retailers in Singapore and Seoul deploy to comply with local health codes.[2]
Government-led “smart classroom” capex
India’s Operation Digital Board catalyzed a leap from 20,000 interactive classrooms in 2009 to 581,000 in 2019, and installations are projected to hit 1.5 million by 2024, anchoring long-run growth in the Asia-Pacific professional audio-visual system market. ASEAN nations replicate this momentum, guided by Asian Development Bank frameworks that emphasize inclusive EdTech procurement. Demand concentrates on flat-panel displays, all-in-one soundbars, and cloud-hosted learning platforms capable of synchronous in-class and remote instruction, ensuring content continuity during weather-related school closures.
Live-event rebound lifts rental and staging
Concert tourism’s return sees Singapore underwriting exclusivity deals that generated an estimated SGD 500 million (USD 390.42 million) economic impact in 2024.[3] New arenas in Hong Kong and Macau are specifying 120-frame-per-second projection, immersive 360° audio arrays, and low-latency fiber backbones to support esports, conferences, and televised award shows. Rental-house inventories thus tilt toward modular LED panels, weatherized line-array speakers, and IP-based signal routers that can be redeployed rapidly across multiple venues, compressing return-on-capital cycles.
Restraints Impact Analysis of Asia-Pacific Professional Audio-Visual Systems Market*
| RESTRAINTS | (~) % IMPACT ON CAGR FORECAST | GEOGRAPHIC RELEVANCE | IMPACT TIMELINE |
|---|---|---|---|
| High operating and compliance costs of complex AV | -0.8% | Global, heavier in tier-2 cities | Medium term (2-4 years) |
| Persistent chipset and optical-component bottlenecks | -1.1% | China, South Korea, Taiwan | Short term (≤ 2 years) |
| Shortage of certified AV technicians | -0.7% | Tier-2 cities in India, South East Asia China | Long term (≥ 4 years) |
| Carbon-border tariffs inflate export BOM costs | -0.6% | ASEAN suppliers to Europe | Medium term (2-4 years) |
| Source: Mordor Intelligence | |||
High operating and compliance costs of complex AV projects
Integrated solutions now blend video, audio, control, and cybersecurity safeguards, raising design hours and specialist wages, particularly outside primary metro areas. Training pipelines lag demand: fewer than 3,000 Asia-Pacific engineers hold advanced SDVoE certification, prompting firms to rely on freelancers who may not stay through warranty periods. AV-as-a-Service contracts transfer capex to opex but include SLA penalties tied to uptime and data-protection audits, making smaller integrators financially cautious.
Carbon-border tariffs inflate export BOM costs
The EU’s Carbon Border Adjustment Mechanism adds an estimated USD 40-60 per ton of embedded emissions on aluminum chassis and steel mounts exported from ASEAN suppliers.[4] Manufacturers weigh localizing production within bloc markets or switching to recycled alloys, but both options demand capital and engineering redesigns, pushing up MSRP until economies of scale emerge.
*Our forecasts treat driver/restraint impacts as directional, not additive. The impact forecasts reflect baseline growth, mix effects, and variable interactions.
Asia-Pacific Professional Audio-Visual Systems Market Segment Analysis
By Type:
Streaming Dominates Content Distribution EvolutionStreaming Media, Storage, and Distribution holds a 35.15% share of the Asia-Pacific professional audio-visual system market, underlining its role as the backbone for distance collaboration and direct-to-consumer entertainment. The wave of 5G private networks across factories further entrenches cloud gateways that ingest, transcode, and forward 4K content in under a second, unlocking remote quality-assurance reviews without on-site staff. Capture and Production Equipment, projected to clock a 6.62% CAGR, thrives on influencer-economy growth and affordable mirrorless cameras paired with AI auto-tracking tripods. Legacy video projection remains relevant for lecture halls and hotel ballrooms craving bright, lamp-free units able to run 24/7 with minimal maintenance.
Second-generation edge encoders compress HEVC streams at half the bit-rate, shrinking bandwidth fees for distance-learning providers. Managed-service vendors bundle them with content-delivery-network subscriptions, shifting the Asia-Pacific professional audio-visual system market from hardware sales toward recurring revenue models. Experimental holographic displays surface in surgical-planning labs, yet most enterprises still pilot them under research and development budgets rather than mainstream roll-outs.

By Component:
Display Systems Lead Hardware IntegrationDisplay and Projection Systems contributed 30.05% to the Asia-Pacific professional audio-visual system market size in 2025, buoyed by micro-LED cost declines and corporate appetite for bezel-less videowalls that double as digital backdrops for virtual production. LED manufacturers located in Shenzhen and Pyeongtaek race to reach sub-0.7-millimeter pixel pitches at competitive yields, compressing unit economics favorable to budget-sensitive education buyers. Audio Equipment enjoys a 7.01% CAGR outlook, catalyzed by Samsung’s integration of Bowers & Wilkins' psychoacoustic research into premium conferencing bars that replicate spatial attendance cues.
Control and Processing shift to software-defined cores that run on commercial off-the-shelf servers, enabling over-the-air updates that extend hardware cycles. Storage and Distribution Hardware sees traditional matrix switchers replaced by 10- and 25-gigabit network fabrics managed through browser dashboards. Power consumption remains a selling point as clients pursue green-building credits; hence, adaptive backlight dimming and class-D amplifier topologies become standard.
By End-user Vertical:
Corporate Spending Drives Market FoundationCorporate environments remained the largest revenue source, absorbing 29.35% of the Asia-Pacific professional audio-visual system market in 2025 as multinational tenants fitted flex-desking spaces with auto-calibrating beamforming arrays and dual-screen front-row configurations. Board approvals often hinge on carbon-payback models where occupancy sensors power down idle displays, aligning with ESG disclosures demanded by investors. Venues and Events, forecast at 6.84% CAGR, experience a renaissance in funding from city tourism boards courting international acts; venue managers demand modular gear capable of touring residencies one week and esports finals the next.
Education keeps rolling out interactive flat panels that bundle annotation software, thereby phasing out bulky chalkboards. Across India, state tenders increasingly require bilingual interface options, expanding addressable volume for regional OEMs integrating Hindi and Tamil fonts at the firmware layer. Healthcare adopts immersive visualization for tele-ICU monitoring and surgical rehearsals, a niche but high-margin pocket where latency tolerance is near zero and uptime SLAs exceed 99.99%.
Geography Analysis
APAC Professional Audio-Visual Systems Market
China’s 38.35% slice of the Asia-Pacific professional audio-visual system market results from its dual position as OEM powerhouse and aggressive domestic adopter. Tier-2 smart-city pilots embed outdoor LED screens into traffic-management nodes, embedding AV feeds with urban IoT telemetry. Bulk purchasing rules often favor locally branded systems, prompting multinationals to form joint ventures or license IP to Chinese partners. Meanwhile, India’s 7.22% CAGR through 2031 rides on state-funded EdTech grants and corporate campus expansions around Bengaluru and Hyderabad that specify fully integrated huddle rooms with AI auto-translation overlays, boosting inclusion for a linguistically diverse workforce. Japan and South Korea remain innovation bellwethers: broadcasters in Tokyo test 8K/120 fps workflows ahead of global sports events, while Seoul’s electronics giants mold mini-LED supply chains resilient to raw-material tariffs. Southeast Asia, aided by the Thailand 4.0 blueprint, invests in digital-service corridors that bake immersive signage into transport hubs and logistics parks. Rest of Asia Pacific markets, from Pakistan to the Pacific Islands, start to pilot unified communication suites via subscription bundles as satellite broadband prices fall.
Regulatory Landscape
Across Asia-Pacific, professional AV/ICT hardware compliance is converging around IEC 62368-1 Edition 4.0 safety requirements, tightening documentation and retest needs for OEMs and importers. India is moving new electronics certification applications under BIS to a unified IS/IEC 62368-1:2023 framework, while Malaysia’s SIRIM type-approval process has tightened acceptance of test reports aligned to current standards, limiting the use of older reports for ongoing approvals.
Several country-level updates also raise technical thresholds and compliance cadence for installed and live-event audio systems. Japan’s METI enforcement of JIS T 0601-2-57:2026 for professional stage-audio immunity testing increases RF immunity expectations, including 10 V/m testing, which requires manufacturers and integrators to validate end-to-end performance and allocate more time to accredited laboratories. In Australia and New Zealand, AS/NZS 62368.1:2026 has been published as the updated national adoption for AV and ICT equipment, with an extended coexistence window for earlier editions that supports phased portfolio transitions and dual-standard test strategies for multi-country shipments.
Value Chain Analysis
The value chain runs from component suppliers (LED modules, optical engines, semiconductors, microphones and DSP, and networking silicon) to OEM/ODM manufacturing concentrated in China and parts of Northeast Asia. Upstream software layers cover UC platforms, control and management, and content and streaming, while downstream activity is deployment-heavy and led by distributors, system integrators, rental and staging firms, and managed-service providers.
China’s integrated manufacturing clusters continue to anchor high-volume production and rapid iteration for displays, projectors, and audio sub-assemblies, and supply risks around chipsets and optical components reinforce multi-sourcing and longer qualification cycles. Channel specialization and local enablement are increasingly important to many vendors, with distributors bundling logistics, technical support, and training for AV-over-IP and DSP-centric systems. Midwich APAC has expanded its role across multiple markets through vendor appointments and partnerships, including projection and image-processing distribution for Barco across Australia, New Zealand, Malaysia, and Indonesia. Suppliers such as Kiloview and PlexusAV have also relied on distribution agreements to extend AV-over-IP reach across Southeast Asia and East Asia. In India, localization push remains visible in manufacturing-led arrangements, such as Clixroute Industries working with TPV Audio and Visual Technology to manufacture AOC-branded projectors and power units domestically, which adds an in-region production node that can shorten lead times for education and enterprise tenders.
Competitive Landscape
The Asia-Pacific professional audio-visual system market features moderate fragmentation, yet top brands rely on scale to buffer supply shocks. Sony, Samsung, Panasonic, and LG map consumer-electronics IP into professional form factors, leveraging shared component pools to keep BOM costs predictable. Niche leaders Barco for visualization, Crestron for control, and Bose Professional for installed audio differentiate via software ecosystems and certified-partner programs. Consolidation accelerated with Samsung’s 2025 audio acquisitions and Acuity Brands’ 2024 purchase of QSC, moves that fold premium DSP and loudspeaker lines into broader building-technology stacks.
White-space revolves around AI orchestration layers that auto-detect occupancy and dynamically re-route signals based on application context. Sustainability credentials serve as a soft moat; Sony’s “Road to Zero” and Panasonic’s “Eco Vision 2050” shape sourcing policies toward recyclable plastics and halogen-free cables. Regional integrators like Vega Global win complex cross-border roll-outs by bundling multilingual helpdesks and in-country stock depots, whereas software start-ups craft SaaS dashboards that unify firmware updates across mixed-vendor fleets.
Future competition will likely pit vertically integrated giants against platform-agnostic consortia advocating open-standard APIs, with customers weighing lock-in risk against single-throat-to-choke convenience. Market positioning thus hinges on balancing proprietary codec advantages with interoperability commitments that reassure enterprise architects building long-run roadmaps.
Asia-Pacific Professional Audio-Visual Systems Industry Leaders
-
Sony Corporation
-
Samsung Electronics
-
Panasonic Corporation
-
LG Electronics
-
Epson
- *Disclaimer: Major Players sorted in no particular order
Asia-Pacific Professional Audio-Visual Systems Market Companies Covered in this Report
- Sony Corporation
- Samsung Electronics
- Panasonic Corporation
- LG Electronics
- Epson
- Barco NV
- Alpine Electronics Inc.
- Kramer Electronics
- Crestron Electronics
- Bose Professional
- Shure Incorporated
- Extron Electronics
- Planar Systems Inc.
- Vega Global
- Elmo
- Guangzhou Baolun Electronic Co.
- Guangzhou DSPPA Audio Co.
- Sennheiser Electronic
Read Analysis of Asia-Pacific Professional Audio-Visual Systems Companies
Market Opportunities and Future Outlook
Opportunities are expanding where buyers standardize on IP-based, software-defined architectures that unify audio, video, and control over enterprise networks. This creates scope for interoperable device fleets, centralized monitoring, and managed services, rather than point solutions.
A concrete indicator is Samsung’s January 2026 AV-over-IP deployment at its UniverSE Training Centre in Yongin-si, South Korea, which used more than 130 Dante AV-enabled devices integrated via Dante Domain Manager and AMX control, showing at-scale AVoIP operations that integrators can replicate for corporate campuses and multi-site enterprises. Immersive venue modernization is also creating whitespace for premium installed audio, high-density networking, and content-production workflows across arts, culture, and education. Hong Kong’s East Kowloon Cultural Centre (April 2026) incorporated multiple permanent d&b Soundscape immersive audio systems within a major new facility, while the New Zealand International Convention Centre has deployed a fiber-based Crestron NVX AV-over-IP network alongside a large-format JBL VTX A Series theatre system, highlighting demand for integrated signal transport, control, and acoustics in high-traffic public venues. In education, Monash University’s July 2026 deployment of the Symetrix Cognio distributed AV and control platform illustrates how campus-wide standardization pulls through microphones, wireless systems, AVoIP infrastructure, and ongoing software lifecycle services across mixed vendor environments.
Recent Industry Developments in Asia-Pacific Professional Audio-Visual Systems Market
- July 2026: Monash University deployed the Symetrix Cognio distributed AV and control platform across campus, integrating it with systems including Shure wireless and Crestron NVX infrastructure. The deployment indicates growing demand for software-defined control layers that scale across many rooms while keeping operations standardized for IT-managed estates.
- May 2026: Sony Semiconductor Solutions signed a non-binding memorandum of understanding with TSMC for a strategic partnership to develop and manufacture next-generation image sensors. Image-sensor roadmaps affect cameras and capture devices used in production, conferencing, and virtual production workflows, supporting higher performance and more predictable supply planning for OEMs.
- October 2024: Acuity Brands completed its USD 1.2 billion acquisition of QSC. Folding QSC’s professional audio, DSP, and control capabilities into a broader building-technology portfolio strengthens cross-selling into corporate and venue projects where AV and smart-building control systems are procured together.
Asia-Pacific Professional Audio-Visual Systems Market Report Scope and Research Methodology
Market Definition and Coverage
For this study, the Asia-Pacific professional audio-visual systems market covers the hardware, software, and related services used to capture, process, distribute, and display audio and video content in professional settings, where performance and reliability are required for business or public use.
Scope exclusions: Consumer home AV products that are primarily bought for personal entertainment at home are excluded from this market view.
Segments Covered in This Report
- By Type
- Capture and Production Equipment
- Video Projection
- Streaming Media, Storage and Distribution
- Services
- Other Types
- By Component
- Audio Equipment (mics, mixers, amps)
- Display and Projection Systems
- Control and Processing
- Storage and Distribution Hardware
- By End-user Vertical
- Corporate
- Venues and Events
- Retail
- Media and Entertainment
- Education
- Government
- Healthcare
- Other End-user Vertical
- By Country
- China
- Japan
- India
- South Korea
- South-East Asia
- Rest of Asia-Pacific
Data Sources, Market Sizing, and Validation
Desk Research
Desk research started with defining what counts as professional AV in Asia-Pacific, and mapping how demand shifts across corporate, education, healthcare, hospitality, retail, and venues. Public sources were used, including national statistics offices in key APAC economies, UN Comtrade trade tables for relevant electronics categories, World Bank and IMF macro indicators, and ITU datasets for connectivity and digital adoption signals.
We also reviewed annual reports, earnings notes, and investor decks of listed manufacturers and system integrators, along with association publications and reputable press coverage on large venue builds and modernization programs. When needed, paid subscriptions for company financials and intelligence, news and financials, import-export shipment-level records, patent databases, and global contracts and tenders supported validation of timelines, pricing direction, and project activity. The desk research sources listed above are not exhaustive, and additional public references were also used for data collection, validation, and clarification.
Primary Interviews and Surveys
Primary work focused on interviews and structured surveys with manufacturers, distributors, AV integrators, rental and staging providers, and large end users that procure AV systems for multi-site deployments. We covered major APAC demand centers (including China, Japan, India, South Korea, and Southeast Asia), so replacement cycles, typical project sizing, and service attach rates could be tested against on-the-ground procurement patterns where desk research was thinner.
Distribution of primary research fieldwork respondents
| Company type | Respondent position |
|---|---|
| Top tier: 36% | CXOs: 21% |
| Mid tier: 43% | Functional/Unit leaders: 30% |
| Smaller Players: 21% | Managers: 49% |
Market-Sizing & Forecasting
Market size was built using a top-down and bottom-up approach, where regional demand was reconstructed from end user adoption and project activity, and then aligned to country and vertical mixes across Asia-Pacific. In practice, the top-down build starts with the installed base and new build activity for key professional venues and facilities, which is then translated into AV system demand using penetration and refresh assumptions.
To corroborate totals, selective bottom-up checks were added using supplier and channel signals, such as sampled price bands for projectors, displays, conferencing equipment, and control systems, multiplied by estimated unit movement in priority countries. The model relied most on construction and renovation activity in commercial buildings, the pace of hybrid meeting room upgrades, large venue and event calendar intensity, public sector and education digitalization programs, and typical replacement cycles for core AV equipment. Forecasting used scenario analysis with variable-level consensus from interviews, so changes in capex appetite and unit pricing could be reflected without forcing a single straight-line trend. Where country or vertical splits were thin, assumptions were bridged using proxy indicators from comparable markets and then re-tested through follow-up discussions with local participants.
Data Validation & Update Cycle
Findings were validated by triangulating the model output with independent signals, including trade movement direction, reported revenue exposure to Asia-Pacific, and large project announcements that indicate real spending cycles. Variances were reviewed in steps: first at country totals, then at major verticals, and finally at type-level allocations, before the numbers were signed off.
If anomalies were found, such as a sharp jump that did not align with replacement timing or project pipelines, interview re-contacts were triggered to re-check pricing, mix, and timing assumptions. The report is refreshed annually, and interim updates are made when material events affect outlook, including policy shifts, supply constraints, or sharp currency moves. Before delivery, analysts run a final pass to ensure the latest available public data and market signals are reflected in the published view.
Mordor Intelligence's Asia Pacific Professional Audio Visual Systems Market Size Versus Other Published Estimates
Published market sizes for professional AV in Asia-Pacific often vary because the boundaries are not set the same way, and the inputs used to turn demand activity into dollars are not always consistent. The biggest swings usually come from what is counted as a system versus an adjacent IT purchase, which countries are included under APAC, and whether services and integration work are priced in fully.
By tracking project-led demand signals and refreshing price and replacement-cycle assumptions with local checks, Mordor Intelligence keeps the estimate tied to professional deployments across APAC countries rather than blending in consumer electronics sales or broad IT spend.
Benchmark comparison
| Source | Market Size | Gaps in Research Methodology |
|---|---|---|
| Mordor Intelligence | USD 48.3 B (2025) | |
| Industry Association A | USD 43.9 B (2025) | Typically skews toward member-reported shipments and may undercount integration and managed services, which can compress the value total in project-heavy countries. |
| Global Consultancy B | USD 55.2 B (2025) | Often uses broader digital workplace and collaboration spend pools, which can pull in adjacent IT hardware and software that is not always purchased as part of professional AV systems. |
The spread in the table mainly comes from scope and pricing treatment, especially on services attach and what gets grouped into workplace technology budgets. Our approach stays repeatable because each step is tied to observable build and refresh activity, checked against pricing bands, and then reviewed at country and vertical levels before final totals are set.
Key Questions Answered in the Report
What is the current value of the Asia-Pacific professional audio-visual system market?
The market is valued at USD 51.07 billion in 2026, with a forecast to reach USD 67.46 billion by 2031.
Which segment holds the largest Asia-Pacific professional audio-visual system market share?
Streaming Media, Storage and Distribution leads with 35.15% share in 2025.
Which country is the fastest growing within the Asia-Pacific professional audio-visual system market?
India is projected to grow at a 7.22% CAGR between 2026 and 2031.
How is 5G influencing professional AV adoption in Asia-Pacific?
5G enables sub-10 ms latency AVoIP workflows, unlocking remote production and delivering 15-20% efficiency gains in manufacturing pilots.