| Study Period | 2017 - 2029 |
| Base Year For Estimation | 2023 |
| Forecast Data Period | 2024 - 2029 |
| Market Size (2024) | USD 11.52 Billion |
| Market Size (2029) | USD 15.59 Billion |
| CAGR (2024 - 2029) | 6.24 % |
| Market Concentration | Low |
Major Players*Disclaimer: Major Players sorted in no particular order |
 Market Size")
Asia-Pacific Polyethylene Terephthalate (PET) Market Analysis
The Asia-Pacific Polyethylene Terephthalate (PET) Market size is estimated at 11.52 billion USD in 2024, and is expected to reach 15.59 billion USD by 2029, growing at a CAGR of 6.24% during the forecast period (2024-2029).
The Asia-Pacific region has established itself as a dominant force in the global polyethylene terephthalate industry, accounting for 42.47% of global PET consumption in 2022. This commanding position is supported by the region's robust manufacturing infrastructure, extensive supply chain networks, and growing domestic demand across multiple industries. The region's strategic advantage is further strengthened by its large consumer base, rising disposable incomes, and rapid urbanization, which continue to drive demand for PET-based products. The integration of advanced manufacturing technologies and automation in production facilities has enabled manufacturers to optimize their operations and maintain competitive advantages in the global market.
The production landscape in Asia-Pacific is undergoing significant transformation with an increasing focus on sustainability and efficiency. Regional manufacturers are investing heavily in expanding their production capabilities while simultaneously implementing environmentally conscious practices. The plastic packaging sector, a major consumer of PET resin, is witnessing substantial growth with production expected to reach 90.7 million tons by 2029 from 70.9 million tons in 2023. This growth is accompanied by innovations in manufacturing processes, including the adoption of energy-efficient technologies and the implementation of circular economy principles in production cycles.
The consumer electronics sector is emerging as a significant growth driver for PET applications, with the industry projected to reach USD 565.5 billion by 2027 from USD 518.0 billion in 2023. This growth is fueled by increasing demand for electronic components, devices, and appliances that utilize PET in various applications. Manufacturers are developing specialized grades of PET to meet the specific requirements of electronic applications, including enhanced thermal stability, electrical insulation properties, and dimensional stability. The integration of PET in advanced electronic applications is creating new opportunities for material innovation and market expansion.
Technological advancements are reshaping the industry landscape, with significant investments in research and development focusing on improving polyethylene terephthalate properties and processing techniques. Industry players are increasingly adopting smart manufacturing technologies, including artificial intelligence and machine learning, to optimize production processes and enhance product quality. These technological innovations are enabling manufacturers to develop new grades of PET with improved performance characteristics, while also addressing sustainability concerns through better recycling capabilities and reduced environmental impact. The industry is witnessing a shift towards more sustainable practices, with manufacturers implementing advanced recycling technologies and developing bio-based alternatives to traditional PET products.
Asia-Pacific Polyethylene Terephthalate (PET) Market Trends
Rapid growth in ASEAN countries to foster electronics production
- The Asia-Pacific region saw an increase in electrical and electronics production revenue by 13.9% from 2020 to 2021. The electronics sector accounts for 20-50% of the total value of most Asian countries' exports. Consumer electronics such as televisions, radios, computers, and cellular phones are largely manufactured in the ASEAN region.
- ASEAN leads the production of hard drives, with over 80% of hard drives being manufactured in the region. Overall, the electrical and electronics (E&E) industry in ASEAN relies more on foreign inputs and technology than other industries, with 53% of E&E exports arising from foreign value added (FVA) or foreign inputs integrated into ASEAN’s E&E exports.
- Countries like Thailand and Malaysia lead in the production of electronics in the region. Thailand, home to one of the largest electronics assembly bases in Southeast Asia, leads in the production of hard drives, integrated circuits, and semiconductors. It ranks second in manufacturing air conditioning units and fourth in the global refrigerators market.
- The electronics industry has greatly benefitted from ASEAN's integrated production networks, which foster improved trade with larger Asian economies like China and Japan.
- China held an 11.2% share of global exports in electrical products and registered a growth of 5.8% in the export of digital products from 2019 to 2020. According to the Asian Development Bank, China provides a large market for electronics in the region. Countries such as Thailand, Japan, China, Malaysia, India, and the Philippines continue to lead the region in the production of electronics.

Understand The Key Trends Shaping This Market
Download PDF
OTHER KEY INDUSTRY TRENDS COVERED IN THE REPORT
- Rapid growth of civil aviation to drive the aerospace component production
- Growing FDI, coupled with supportive government initiatives, to drive the construction industry
- Chinese exports to help Asia-Pacific maintain its dominance in global PET trade
- Films and sheets to remain dominant during the forecast period
- Electric vehicles to boost the automobile market in the coming years
- Evolving consumer trends and growing e-commerce sector to amplify plastic packaging industry
- Higher growth expected in conjunction with crude oil prices
- The PET recycling rate is high in countries like China (94%) India (90%) and Japan (86%)
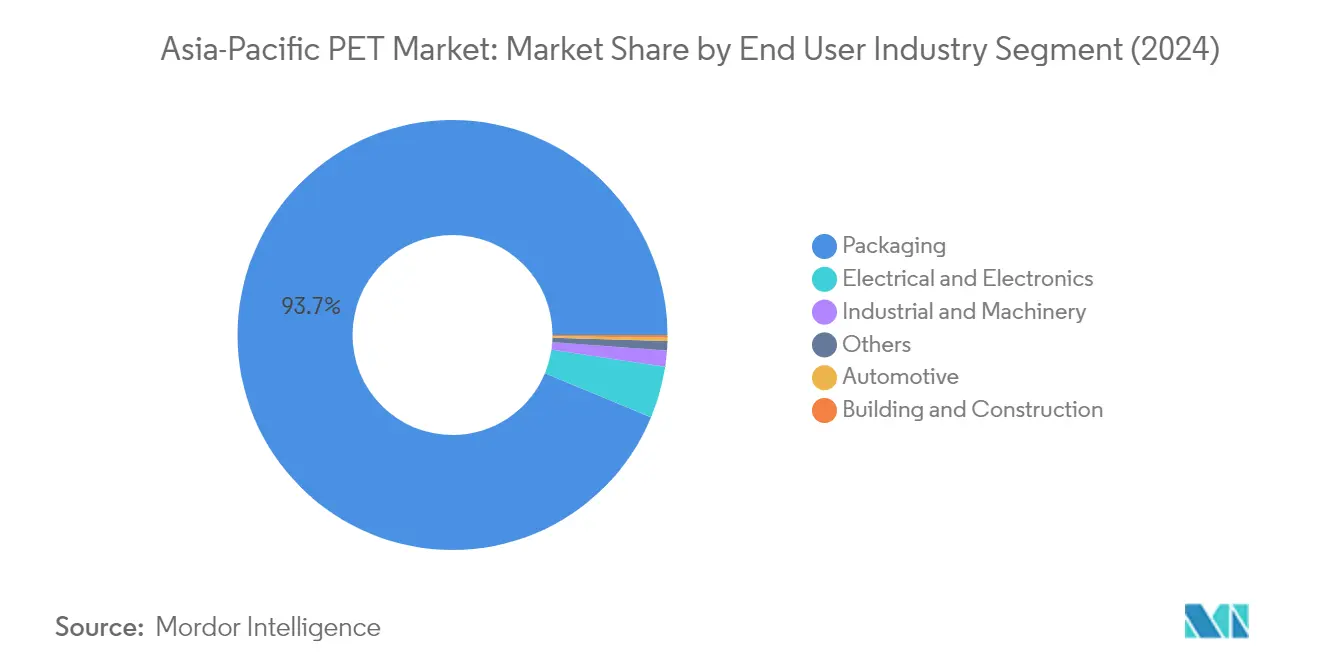
Segment Analysis: End User Industry
Packaging Segment in Asia-Pacific PET Market
The PET packaging segment dominates the Asia-Pacific polyethylene terephthalate (PET) market, commanding approximately 94% of the total market value in 2024. This substantial market share is primarily driven by the extensive use of PET in food and beverage packaging applications, particularly in convenience-sized soft drinks, juices, and water bottles. The segment's dominance is further strengthened by PET's essential properties, including rigidity, high transparency, and its ability to be molded into various packaging formats such as plastic boxes and jugs. The growth in this segment is particularly notable in China and India, where increasing urbanization and changing consumer lifestyles have led to greater demand for packaged beverages and food products. The segment's strong position is also supported by PET's advantages as a substitute for glass in food packaging applications, owing to its lightweight properties, which ensure easy and efficient transport, along with its recyclability and shatterproof characteristics.
Electrical and Electronics Segment in Asia-Pacific PET Market
The electrical and electronics segment is emerging as the fastest-growing segment in the Asia-Pacific PET market, projected to expand at approximately 8% CAGR from 2024 to 2029. This remarkable growth is driven by the increasing adoption of PET in various electronic applications, particularly in electrical insulation, coil forms, and electrical devices. The segment's growth is further accelerated by the rapid pace of electronic technological innovation and consistent demand for newer and faster electrical and electronic products. The surge in demand for technologically advanced consumer electronics and appliances, such as smartphones, laptops, and televisions, is creating substantial opportunities for PET applications. Additionally, the trend of replacing traditional materials with PET film in applications like electrical encapsulation, solenoids, and smart meters is contributing to the segment's growth trajectory. The expansion is particularly notable in major electronics manufacturing hubs like China, Japan, and South Korea, where increasing investments in electronic component production are driving demand for PET materials.
Remaining Segments in End User Industry
The other segments in the Asia-Pacific PET market include automotive, building and construction, industrial and machinery, and other miscellaneous applications. The automotive sector utilizes PET in manufacturing exterior body parts, engine covers, connector housing, and headlamp retainers. The building and construction segment incorporates PET in exterior wall ceilings and as an additive in concrete construction. The industrial and machinery sector employs PET in food processing machinery and various industrial applications. These segments, while smaller in market share, play crucial roles in diversifying PET applications across different industries. The growth in these segments is influenced by factors such as increasing automotive production, infrastructure development, and industrial automation across the Asia-Pacific region. Each segment contributes to the market's overall dynamics by offering unique applications and growth opportunities in their respective sectors. Additionally, the use of PET film and PET container solutions in these industries enhances their operational efficiencies and sustainability.
Asia-Pacific Polyethylene Terephthalate (PET) Market Geography Segment Analysis
Polyethylene Terephthalate (PET) Market in China
China maintains its dominant position in the Asia-Pacific Polyethylene Terephthalate (PET) market, commanding approximately 55% of the regional market value in 2024. The country's leadership is primarily driven by its robust packaging industry, particularly in food and beverage applications, where PET resin serves as a crucial material for PET bottle production and various PET packaging solutions. The nation's strong manufacturing infrastructure and technological capabilities have enabled it to maintain high production efficiencies and meet growing domestic demand. China's market position is further strengthened by its significant investments in research and development, focusing on developing innovative PET applications and improving product quality. The country's commitment to sustainability has also led to increased emphasis on PET recycling initiatives, with manufacturers adopting advanced recycling technologies. Additionally, the growing emphasis on lightweight packaging solutions and the expansion of the beverage industry have continued to drive demand for PET products in the country.
Polyethylene Terephthalate (PET) Market in India
India has emerged as a dynamic force in the Asia-Pacific PET market, projected to grow at approximately 6% CAGR from 2024 to 2029. The country's remarkable growth trajectory is fueled by rapid industrialization and urbanization, coupled with changing consumer preferences towards packaged products. The government's initiatives to promote the plastic industry, including allowing 100% FDI under the automatic route, have created a favorable environment for market expansion. India's PET industry has witnessed significant technological advancements, particularly in bottle-grade resin production, meeting the increasing demands of the beverage sector. The country's focus on developing sustainable packaging solutions has led to increased investments in recycling infrastructure and the adoption of eco-friendly manufacturing processes. The electrical and electronics sector's growing demand for PET films, particularly in applications like electrical encapsulation and smart meters, has created new growth avenues. Furthermore, the expansion of organized retail and e-commerce has significantly boosted the demand for PET packaging solutions.
Polyethylene Terephthalate (PET) Market in Japan
Japan's PET market demonstrates sophisticated technological integration and high-quality standards in production processes. The country's market is characterized by its strong focus on innovation and sustainability, with manufacturers continuously developing new grades of Polyethylene Terephthalate resins for specialized applications. Japanese companies have been at the forefront of developing high-performance PET materials, particularly for the electronics and automotive sectors. The nation's stringent quality control measures and advanced manufacturing capabilities have established it as a reliable supplier of premium PET products. The country's packaging industry, particularly in the beverage sector, continues to be a major consumer of PET resins, driven by the demand for convenient and lightweight packaging solutions. Japan's commitment to environmental sustainability has led to significant investments in recycling infrastructure, with the country achieving one of the highest PET bottle recycling rates in the region. The market also benefits from strong research and development activities, focusing on improving material properties and developing new applications.
Polyethylene Terephthalate (PET) Market in South Korea
South Korea's PET market is characterized by its strong integration with the country's advanced manufacturing ecosystem. The nation's technological expertise has enabled the development of specialized PET grades catering to high-end applications in the electronics and automotive sectors. South Korean manufacturers have established themselves as reliable suppliers of quality PET products, leveraging their advanced production capabilities and stringent quality control measures. The country's focus on innovation has led to the development of new applications for PET materials, particularly in the electrical and electronics industry. The market benefits from strong domestic demand in the packaging sector, driven by changing consumer lifestyles and the growth of the convenience food industry. South Korean companies have also made significant strides in sustainable manufacturing practices, implementing advanced recycling technologies and developing eco-friendly PET variants. The country's strategic location and strong trade relationships have facilitated its position as a key exporter of PET products in the region.
Polyethylene Terephthalate (PET) Market in Other Countries
The PET market in other Asia-Pacific countries, including Australia, Malaysia, Thailand, Vietnam, and Indonesia, exhibits diverse growth patterns influenced by their respective industrial development stages and economic conditions. These markets are characterized by increasing domestic consumption and growing manufacturing capabilities. Countries like Malaysia and Thailand have emerged as significant players in the packaging sector, while Vietnam and Indonesia are experiencing rapid industrialization, driving demand for PET products. The automotive and electronics sectors in these countries are increasingly adopting PET materials, creating new opportunities for market growth. These nations are also witnessing growing awareness about sustainable packaging solutions, leading to increased focus on recycling initiatives and eco-friendly manufacturing processes. The development of local manufacturing capabilities and increasing foreign investments have strengthened the PET industry in these countries, while improved distribution networks have enhanced market accessibility.
Get Analysis on Important Geographic Markets
Download PDF
Asia-Pacific Polyethylene Terephthalate (PET) Industry Overview
Top Companies in Asia-Pacific Polyethylene Terephthalate (PET) Market
Leading PET manufacturers in the Asia-Pacific region are focusing on expanding their production capacities through greenfield investments and strategic partnerships to meet growing demand. Companies are investing heavily in research and development to create innovative grades of PET resin with enhanced properties for specific end-use applications. Operational excellence is being achieved through vertical integration across the value chain, from raw material procurement to final product distribution. Strategic moves include establishing joint ventures with regional players to strengthen market presence and distribution networks. Many manufacturers are also emphasizing sustainability by investing in recycling facilities and developing eco-friendly recycled PET variants to align with evolving environmental regulations and customer preferences.
Market Dominated by Regional Manufacturing Giants
The Asia-Pacific Polyethylene Terephthalate (PET) market structure is characterized by the presence of large regional conglomerates with integrated operations across the petrochemical value chain. Chinese and Indian manufacturers dominate the market landscape, leveraging their domestic manufacturing capabilities and extensive distribution networks. The market demonstrates moderate consolidation, with the top five players accounting for a significant share while numerous medium-sized manufacturers serve specific regional markets or specialized applications.
The competitive environment is marked by ongoing consolidation through mergers and acquisitions, particularly in emerging markets like Vietnam and Indonesia. Major players are acquiring local manufacturers to expand their geographic footprint and production capabilities. Vertical integration remains a key strategy, with companies investing in backward integration to secure raw material supply and forward integration to strengthen their presence in downstream applications. The market also witnesses strategic partnerships between global and regional players to combine technological expertise with local market knowledge.
Innovation and Sustainability Drive Future Growth
Success in the Asia-Pacific PET market increasingly depends on manufacturers' ability to develop specialized grades meeting evolving end-user requirements, particularly in the packaging and electronics sectors. Companies need to focus on building strong relationships with key customers in these industries while maintaining cost competitiveness through operational efficiency. Investment in advanced manufacturing technologies and automation will be crucial for maintaining quality standards and reducing production costs. Additionally, establishing robust recycling infrastructure and developing circular economy solutions will become increasingly important as sustainability regulations tighten across the region.
Market participants must also address the growing threat of substitution from alternative materials by highlighting PET's unique advantages and developing enhanced formulations. Regional players looking to expand their market presence should focus on developing value-added products for specific applications while building strong distribution networks in emerging markets. Success will also depend on companies' ability to navigate varying regulatory landscapes across different countries and adapt to changing environmental standards. Building strategic partnerships with technology providers and end-users will be essential for maintaining competitive advantage and driving innovation in the market.
Asia-Pacific Polyethylene Terephthalate (PET) Market Leaders
-
China Petroleum & Chemical Corporation
-
China Resources (Holdings) Co.,Ltd.
-
Far Eastern New Century Corporation
-
Indorama Ventures Public Company Limited
-
Sanfame Group
- *Disclaimer: Major Players sorted in no particular order
Market/1708339243785_Asia-PacificPolyethyleneTerephthalate(PET)Market_market_concentration.svg)
Need More Details on Market Players and Competitors?
Download PDF
Asia-Pacific Polyethylene Terephthalate (PET) Market News
- October 2022: Indorama Ventures Public Company Limited announced the opening of the largest PET recycling plant in partnership with Coca-Cola Beverages, with the goal of recycling approximately 2 billion additional used PET (polyethylene terephthalate) plastic bottles in the Philippines each year.
- April 2022: Indorama Ventures Public Ltd acquired Ngoc Nghia Industry, a leading PET packaging manufacturer.
- May 2021: Indorama Ventures Public Ltd planned to construct a new resin manufacturing facility in India to increase the production capacity of PET resin to 700 tons a day.
Free With This Report
We provide a complimentary and exhaustive set of data points on global and regional metrics that present the fundamental structure of the industry. Presented in the form of 15+ free charts, the section covers rare data on various end-user production trends including passenger vehicle production, commercial vehicle production, motorcycle production, aerospace components production, electrical and electronics production, and regional data for engineering plastics demand etc.


Asia-Pacific Polyethylene Terephthalate (PET) Market Report - Table of Contents
1. EXECUTIVE SUMMARY & KEY FINDINGS
2. REPORT OFFERS
3. INTRODUCTION
- 3.1 Study Assumptions & Market Definition
- 3.2 Scope of the Study
- 3.3 Research Methodology
4. KEY INDUSTRY TRENDS
-
4.1 End User Trends
- 4.1.1 Aerospace
- 4.1.2 Automotive
- 4.1.3 Building and Construction
- 4.1.4 Electrical and Electronics
- 4.1.5 Packaging
-
4.2 Import And Export Trends
- 4.2.1 Polyethylene Terephthalate (PET) Trade
- 4.3 Price Trends
- 4.4 Form Trends
-
4.5 Recycling Overview
- 4.5.1 Polyethylene Terephthalate (PET) Recycling Trends
-
4.6 Regulatory Framework
- 4.6.1 Australia
- 4.6.2 China
- 4.6.3 India
- 4.6.4 Japan
- 4.6.5 Malaysia
- 4.6.6 South Korea
- 4.7 Value Chain & Distribution Channel Analysis
5. MARKET SEGMENTATION (includes market size in Value in USD and Volume, Forecasts up to 2029 and analysis of growth prospects)
-
5.1 End User Industry
- 5.1.1 Automotive
- 5.1.2 Building and Construction
- 5.1.3 Electrical and Electronics
- 5.1.4 Industrial and Machinery
- 5.1.5 Packaging
- 5.1.6 Other End-user Industries
-
5.2 Country
- 5.2.1 Australia
- 5.2.2 China
- 5.2.3 India
- 5.2.4 Japan
- 5.2.5 Malaysia
- 5.2.6 South Korea
- 5.2.7 Rest of Asia-Pacific
6. COMPETITIVE LANDSCAPE
- 6.1 Key Strategic Moves
- 6.2 Market Share Analysis
- 6.3 Company Landscape
-
6.4 Company Profiles (includes Global Level Overview, Market Level Overview, Core Business Segments, Financials, Headcount, Key Information, Market Rank, Market Share, Products and Services, and Analysis of Recent Developments).
- 6.4.1 China Petroleum & Chemical Corporation
- 6.4.2 China Resources (Holdings) Co.,Ltd.
- 6.4.3 Far Eastern New Century Corporation
- 6.4.4 Indorama Ventures Public Company Limited
- 6.4.5 JBF Industries Ltd
- 6.4.6 Lotte Chemical
- 6.4.7 Reliance Industries Limited
- 6.4.8 Sanfame Group
- 6.4.9 Zhejiang Hengyi Group Co., Ltd.
- 6.4.10 Zhejiang Zhink Group Co., Ltd.
7. KEY STRATEGIC QUESTIONS FOR ENGINEERING PLASTICS CEOS
8. APPENDIX
-
8.1 Global Overview
- 8.1.1 Overview
- 8.1.2 Porter’s Five Forces Framework (Industry Attractiveness Analysis)
- 8.1.3 Global Value Chain Analysis
- 8.1.4 Market Dynamics (DROs)
- 8.2 Sources & References
- 8.3 List of Tables & Figures
- 8.4 Primary Insights
- 8.5 Data Pack
- 8.6 Glossary of Terms
You Can Purchase Parts Of This Report. Check Out Prices For Specific Sections
Get Price Break-up Now
List of Tables & Figures
- Figure 1:
- PRODUCTION REVENUE OF AEROSPACE COMPONENTS, USD, ASIA-PACIFIC, 2017 - 2029
- Figure 2:
- PRODUCTION VOLUME OF AUTOMOBILES, UNITS, ASIA-PACIFIC, 2017 - 2029
- Figure 3:
- FLOOR AREA OF NEW CONSTRUCTION, SQUARE FEET, ASIA-PACIFIC, 2017 - 2029
- Figure 4:
- PRODUCTION REVENUE OF ELECTRICAL AND ELECTRONICS, USD, ASIA-PACIFIC, 2017 - 2029
- Figure 5:
- PRODUCTION VOLUME OF PLASTIC PACKAGING, TONS, ASIA-PACIFIC, 2017 - 2029
- Figure 6:
- IMPORT REVENUE OF POLYETHYLENE TEREPHTHALATE (PET) TRADE BY TOP COUNTRIES, USD, ASIA-PACIFIC, 2017 - 2021
- Figure 7:
- EXPORT REVENUE OF POLYETHYLENE TEREPHTHALATE (PET) TRADE BY TOP COUNTRIES, USD, ASIA-PACIFIC, 2017 - 2021
- Figure 8:
- ASIA-PACIFIC POLYETHYLENE TEREPHTHALATE (PET) MARKET, PRICE TRENDS, BY COUNTRY, USD PER KG, 2017-2021
- Figure 9:
- REVENUE OF POLYETHYLENE TEREPHTHALATE (PET) BY FORM TYPE, USD, ASIA-PACIFIC, 2017, 2023, AND 2029
- Figure 10:
- VOLUME OF POLYETHYLENE TEREPHTHALATE (PET) CONSUMED, TONS, ASIA-PACIFIC, 2017 - 2029
- Figure 11:
- VALUE OF POLYETHYLENE TEREPHTHALATE (PET) CONSUMED, USD, ASIA-PACIFIC, 2017 - 2029
- Figure 12:
- VOLUME OF POLYETHYLENE TEREPHTHALATE (PET) CONSUMED BY END USER INDUSTRY, TONS, ASIA-PACIFIC, 2017 - 2029
- Figure 13:
- VALUE OF POLYETHYLENE TEREPHTHALATE (PET) CONSUMED BY END USER INDUSTRY, USD, ASIA-PACIFIC, 2017 - 2029
- Figure 14:
- VOLUME SHARE OF POLYETHYLENE TEREPHTHALATE (PET) CONSUMED BY END USER INDUSTRY, %, ASIA-PACIFIC, 2017, 2023, AND 2029
- Figure 15:
- VALUE SHARE OF POLYETHYLENE TEREPHTHALATE (PET) CONSUMED BY END USER INDUSTRY, %, ASIA-PACIFIC, 2017, 2023, AND 2029
- Figure 16:
- VOLUME OF POLYETHYLENE TEREPHTHALATE (PET) CONSUMED IN AUTOMOTIVE INDUSTRY, TONS, ASIA-PACIFIC, 2017 - 2029
- Figure 17:
- VALUE OF POLYETHYLENE TEREPHTHALATE (PET) CONSUMED IN AUTOMOTIVE INDUSTRY, USD, ASIA-PACIFIC, 2017 - 2029
- Figure 18:
- VALUE SHARE OF POLYETHYLENE TEREPHTHALATE (PET) CONSUMED IN AUTOMOTIVE INDUSTRY BY COUNTRY, %, ASIA-PACIFIC, 2022 VS 2029
- Figure 19:
- VOLUME OF POLYETHYLENE TEREPHTHALATE (PET) CONSUMED IN BUILDING AND CONSTRUCTION INDUSTRY, TONS, ASIA-PACIFIC, 2017 - 2029
- Figure 20:
- VALUE OF POLYETHYLENE TEREPHTHALATE (PET) CONSUMED IN BUILDING AND CONSTRUCTION INDUSTRY, USD, ASIA-PACIFIC, 2017 - 2029
- Figure 21:
- VALUE SHARE OF POLYETHYLENE TEREPHTHALATE (PET) CONSUMED IN BUILDING AND CONSTRUCTION INDUSTRY BY COUNTRY, %, ASIA-PACIFIC, 2022 VS 2029
- Figure 22:
- VOLUME OF POLYETHYLENE TEREPHTHALATE (PET) CONSUMED IN ELECTRICAL AND ELECTRONICS INDUSTRY, TONS, ASIA-PACIFIC, 2017 - 2029
- Figure 23:
- VALUE OF POLYETHYLENE TEREPHTHALATE (PET) CONSUMED IN ELECTRICAL AND ELECTRONICS INDUSTRY, USD, ASIA-PACIFIC, 2017 - 2029
- Figure 24:
- VALUE SHARE OF POLYETHYLENE TEREPHTHALATE (PET) CONSUMED IN ELECTRICAL AND ELECTRONICS INDUSTRY BY COUNTRY, %, ASIA-PACIFIC, 2022 VS 2029
- Figure 25:
- VOLUME OF POLYETHYLENE TEREPHTHALATE (PET) CONSUMED IN INDUSTRIAL AND MACHINERY INDUSTRY, TONS, ASIA-PACIFIC, 2017 - 2029
- Figure 26:
- VALUE OF POLYETHYLENE TEREPHTHALATE (PET) CONSUMED IN INDUSTRIAL AND MACHINERY INDUSTRY, USD, ASIA-PACIFIC, 2017 - 2029
- Figure 27:
- VALUE SHARE OF POLYETHYLENE TEREPHTHALATE (PET) CONSUMED IN INDUSTRIAL AND MACHINERY INDUSTRY BY COUNTRY, %, ASIA-PACIFIC, 2022 VS 2029
- Figure 28:
- VOLUME OF POLYETHYLENE TEREPHTHALATE (PET) CONSUMED IN PACKAGING INDUSTRY, TONS, ASIA-PACIFIC, 2017 - 2029
- Figure 29:
- VALUE OF POLYETHYLENE TEREPHTHALATE (PET) CONSUMED IN PACKAGING INDUSTRY, USD, ASIA-PACIFIC, 2017 - 2029
- Figure 30:
- VALUE SHARE OF POLYETHYLENE TEREPHTHALATE (PET) CONSUMED IN PACKAGING INDUSTRY BY COUNTRY, %, ASIA-PACIFIC, 2022 VS 2029
- Figure 31:
- VOLUME OF POLYETHYLENE TEREPHTHALATE (PET) CONSUMED IN OTHER END-USER INDUSTRIES INDUSTRY, TONS, ASIA-PACIFIC, 2017 - 2029
- Figure 32:
- VALUE OF POLYETHYLENE TEREPHTHALATE (PET) CONSUMED IN OTHER END-USER INDUSTRIES INDUSTRY, USD, ASIA-PACIFIC, 2017 - 2029
- Figure 33:
- VALUE SHARE OF POLYETHYLENE TEREPHTHALATE (PET) CONSUMED IN OTHER END-USER INDUSTRIES INDUSTRY BY COUNTRY, %, ASIA-PACIFIC, 2022 VS 2029
- Figure 34:
- VOLUME OF POLYETHYLENE TEREPHTHALATE (PET) CONSUMED BY COUNTRY, TONS, ASIA-PACIFIC, 2017 - 2029
- Figure 35:
- VALUE OF POLYETHYLENE TEREPHTHALATE (PET) CONSUMED BY COUNTRY, USD, ASIA-PACIFIC, 2017 - 2029
- Figure 36:
- VOLUME SHARE OF POLYETHYLENE TEREPHTHALATE (PET) CONSUMED BY COUNTRY, %, ASIA-PACIFIC, 2017, 2023, AND 2029
- Figure 37:
- VALUE SHARE OF POLYETHYLENE TEREPHTHALATE (PET) CONSUMED BY COUNTRY, %, ASIA-PACIFIC, 2017, 2023, AND 2029
- Figure 38:
- VOLUME OF POLYETHYLENE TEREPHTHALATE (PET) CONSUMED, TONS, AUSTRALIA, 2017 - 2029
- Figure 39:
- VALUE OF POLYETHYLENE TEREPHTHALATE (PET) CONSUMED, USD, AUSTRALIA, 2017 - 2029
- Figure 40:
- VALUE SHARE OF POLYETHYLENE TEREPHTHALATE (PET) CONSUMED BY END USER INDUSTRY, %, AUSTRALIA, 2022 VS 2029
- Figure 41:
- VOLUME OF POLYETHYLENE TEREPHTHALATE (PET) CONSUMED, TONS, CHINA, 2017 - 2029
- Figure 42:
- VALUE OF POLYETHYLENE TEREPHTHALATE (PET) CONSUMED, USD, CHINA, 2017 - 2029
- Figure 43:
- VALUE SHARE OF POLYETHYLENE TEREPHTHALATE (PET) CONSUMED BY END USER INDUSTRY, %, CHINA, 2022 VS 2029
- Figure 44:
- VOLUME OF POLYETHYLENE TEREPHTHALATE (PET) CONSUMED, TONS, INDIA, 2017 - 2029
- Figure 45:
- VALUE OF POLYETHYLENE TEREPHTHALATE (PET) CONSUMED, USD, INDIA, 2017 - 2029
- Figure 46:
- VALUE SHARE OF POLYETHYLENE TEREPHTHALATE (PET) CONSUMED BY END USER INDUSTRY, %, INDIA, 2022 VS 2029
- Figure 47:
- VOLUME OF POLYETHYLENE TEREPHTHALATE (PET) CONSUMED, TONS, JAPAN, 2017 - 2029
- Figure 48:
- VALUE OF POLYETHYLENE TEREPHTHALATE (PET) CONSUMED, USD, JAPAN, 2017 - 2029
- Figure 49:
- VALUE SHARE OF POLYETHYLENE TEREPHTHALATE (PET) CONSUMED BY END USER INDUSTRY, %, JAPAN, 2022 VS 2029
- Figure 50:
- VOLUME OF POLYETHYLENE TEREPHTHALATE (PET) CONSUMED, TONS, MALAYSIA, 2017 - 2029
- Figure 51:
- VALUE OF POLYETHYLENE TEREPHTHALATE (PET) CONSUMED, USD, MALAYSIA, 2017 - 2029
- Figure 52:
- VALUE SHARE OF POLYETHYLENE TEREPHTHALATE (PET) CONSUMED BY END USER INDUSTRY, %, MALAYSIA, 2022 VS 2029
- Figure 53:
- VOLUME OF POLYETHYLENE TEREPHTHALATE (PET) CONSUMED, TONS, SOUTH KOREA, 2017 - 2029
- Figure 54:
- VALUE OF POLYETHYLENE TEREPHTHALATE (PET) CONSUMED, USD, SOUTH KOREA, 2017 - 2029
- Figure 55:
- VALUE SHARE OF POLYETHYLENE TEREPHTHALATE (PET) CONSUMED BY END USER INDUSTRY, %, SOUTH KOREA, 2022 VS 2029
- Figure 56:
- VOLUME OF POLYETHYLENE TEREPHTHALATE (PET) CONSUMED, TONS, REST OF ASIA-PACIFIC, 2017 - 2029
- Figure 57:
- VALUE OF POLYETHYLENE TEREPHTHALATE (PET) CONSUMED, USD, REST OF ASIA-PACIFIC, 2017 - 2029
- Figure 58:
- VALUE SHARE OF POLYETHYLENE TEREPHTHALATE (PET) CONSUMED BY END USER INDUSTRY, %, REST OF ASIA-PACIFIC, 2022 VS 2029
- Figure 59:
- MOST ACTIVE COMPANIES BY NUMBER OF STRATEGIC MOVES, ASIA-PACIFIC, 2019 - 2021
- Figure 60:
- MOST ADOPTED STRATEGIES, COUNT, ASIA-PACIFIC, 2019 - 2021
- Figure 61:
- PRODUCTION CAPACITY SHARE OF POLYETHYLENE TEREPHTHALATE (PET) BY MAJOR PLAYERS, %, ASIA-PACIFIC, 2022
Asia-Pacific Polyethylene Terephthalate (PET) Industry Segmentation
Automotive, Building and Construction, Electrical and Electronics, Industrial and Machinery, Packaging are covered as segments by End User Industry. Australia, China, India, Japan, Malaysia, South Korea are covered as segments by Country.| End User Industry | Automotive |
| Building and Construction | |
| Electrical and Electronics | |
| Industrial and Machinery | |
| Packaging | |
| Other End-user Industries | |
| Country | Australia |
| China | |
| India | |
| Japan | |
| Malaysia | |
| South Korea | |
| Rest of Asia-Pacific |
Need A Different Region or Segment?
Customize Now
Market Definition
- End-user Industry - Building & Construction, Packaging, Automotive, Industrial Machinery, Electrical & Electronics, and Others are the end-user industries considered under the polyethylene terephthalate market.
- Resin - Under the scope of the study, virgin polyethylene terephthalate resin in primary forms such as liquid, powder, pellet, etc. are considered.
| Keyword | Definition |
|---|---|
| Acetal | This is a rigid material that has a slippery surface. It can easily withstand wear and tear in abusive work environments. This polymer is used for building applications such as gears, bearings, valve components, etc. |
| Acrylic | This synthetic resin is a derivative of acrylic acid. It forms a smooth surface and is mainly used for various indoor applications. The material can also be used for outdoor applications with a special formulation. |
| Cast film | A cast film is made by depositing a layer of plastic onto a surface then solidifying and removing the film from that surface. The plastic layer can be in molten form, in a solution, or in dispersion. |
| Colorants & Pigments | Colorants & Pigments are additives used to change the color of the plastic. They can be a powder or a resin/color premix. |
| Composite material | A composite material is a material that is produced from two or more constituent materials. These constituent materials have dissimilar chemical or physical properties and are merged to create a material with properties unlike the individual elements. |
| Degree of Polymerization (DP) | The number of monomeric units in a macromolecule, polymer, or oligomer molecule is referred to as the degree of polymerization or DP. Plastics with useful physical properties often have DPs in the thousands. |
| Dispersion | To create a suspension or solution of material in another substance, fine, agglomerated solid particles of one substance are dispersed in a liquid or another substance to form a dispersion. |
| Fiberglass | Fiberglass-reinforced plastic is a material made up of glass fibers embedded in a resin matrix. These materials have high tensile and impact strength. Handrails and platforms are two examples of lightweight structural applications that use standard fiberglass. |
| Fiber-reinforced polymer (FRP) | Fiber-reinforced polymer is a composite material made of a polymer matrix reinforced with fibers. The fibers are usually glass, carbon, aramid, or basalt. |
| Flake | This is a dry, peeled-off piece, usually with an uneven surface, and is the base of cellulosic plastics. |
| Fluoropolymers | This is a fluorocarbon-based polymer with multiple carbon-fluorine bonds. It is characterized by high resistance to solvents, acids, and bases. These materials are tough yet easy to machine. Some of the popular fluoropolymers are PTFE, ETFE, PVDF, PVF, etc. |
| Kevlar | Kevlar is the commonly referred name for aramid fiber, which was initially a Dupont brand for aramid fiber. Any group of lightweight, heat-resistant, solid, synthetic, aromatic polyamide materials that are fashioned into fibers, filaments, or sheets is called aramid fiber. They are classified into Para-aramid and Meta-aramid. |
| Laminate | A structure or surface composed of sequential layers of material bonded under pressure and heat to build up to the desired shape and width. |
| Nylon | They are synthetic fiber-forming polyamides formed into yarns and monofilaments. These fibers possess excellent tensile strength, durability, and elasticity. They have high melting points and can resist chemicals and various liquids. |
| PET preform | A preform is an intermediate product that is subsequently blown into a polyethylene terephthalate (PET) bottle or a container. |
| Plastic compounding | Compounding consists of preparing plastic formulations by mixing and/or blending polymers and additives in a molten state to achieve the desired characteristics. These blends are automatically dosed with fixed setpoints usually through feeders/hoppers. |
| Plastic pellets | Plastic pellets, also known as pre-production pellets or nurdles, are the building blocks for nearly every product made of plastic. |
| Polymerization | It is a chemical reaction of several monomer molecules to form polymer chains that form stable covalent bonds. |
| Styrene Copolymers | A copolymer is a polymer derived from more than one species of monomer, and a styrene copolymer is a chain of polymers consisting of styrene and acrylate. |
| Thermoplastics | Thermoplastics are defined as polymers that become soft material when it is heated and becomes hard when it is cooled. Thermoplastics have wide-ranging properties and can be remolded and recycled without affecting their physical properties. |
| Virgin Plastic | It is a basic form of plastic that has never been used, processed, or developed. It may be considered more valuable than recycled or already used materials. |
Need More Details on Market Definition?
Ask a Question
Research Methodology
Mordor Intelligence follows a four-step methodology in all our reports.
- Step-1: Identify Key Variables: The quantifiable key variables (industry and extraneous) pertaining to the specific product segment and country are selected from a group of relevant variables & factors based on desk research & literature review; along with primary expert inputs. These variables are further confirmed through regression modeling (wherever required).
- Step-2: Build a Market Model: In order to build a robust forecasting methodology, the variables and factors identified in Step-1 are tested against available historical market numbers. Through an iterative process, the variables required for market forecast are set and the model is built on the basis of these variables.
- Step-3: Validate and Finalize: In this important step, all market numbers, variables and analyst calls are validated through an extensive network of primary research experts from the market studied. The respondents are selected across levels and functions to generate a holistic picture of the market studied.
- Step-4: Research Outputs: Syndicated Reports, Custom Consulting Assignments, Databases & Subscription Platforms

Get More Details On Research Methodology
Download PDF


