Market Overview
| Study Period | 2017 - 2030 |
|---|---|
| Base Year For Estimation | 2024 |
| Forecast Data Period | 2025 - 2030 |
| Market Size (2025) | USD 0.94 Billion |
| Market Size (2030) | USD 1.3 Billion |
| Growth Rate (2025 - 2030) | 6.75% CAGR |
| Market Concentration | Low |
Major Players*Disclaimer: Major Players sorted in no particular order Image © Mordor Intelligence. Reuse requires attribution under CC BY 4.0. | |

Asia-Pacific Pea Protein Market Analysis by Mordor Intelligence
The Asia-Pacific Pea Protein Market size is estimated at 0.94 billion USD in 2025, and is expected to reach 1.3 billion USD by 2030, growing at a CAGR of 6.75% during the forecast period (2025-2030).
The Asia-Pacific pea protein industry is experiencing a significant transformation driven by changing consumer preferences and health consciousness. A notable shift towards plant protein nutrition is evident, with research indicating that 69% of consumers in Asia perceived plant-based foods as healthier in 2023. This changing perception has prompted food manufacturers to replace conventional ingredients with plant protein alternatives, particularly in clean-label products. The industry is also witnessing increased investment in research and development, with companies focusing on improving protein extraction techniques and enhancing the functional properties of pea protein.
The market is seeing substantial innovation in product development and applications across various industries. Major food manufacturers are incorporating pea protein into their formulations due to its versatility and functional benefits, including excellent water-binding capabilities, neutral taste, and superior nutritional profile. The ingredient's hypoallergenic properties have become increasingly important, particularly in China, where over 85% of the population was reported to be lactose intolerant in 2022. This has led to accelerated product development in dairy alternatives and other lactose-free applications, leveraging vegan protein solutions.
Regulatory developments and certification programs are playing a crucial role in shaping the market landscape. A significant development was the introduction of the China Vegan Food Certification (CVFC) in 2023, the first program of its kind in China, aimed at standardizing vegan claims and enhancing consumer trust. This regulatory evolution is complemented by increasing industry focus on sustainable production practices and transparent supply chains, with manufacturers implementing advanced satellite imaging technology and other cutting-edge solutions to maintain sustainability throughout their operations.
The sports nutrition and active lifestyle segment is emerging as a key growth driver for the industry. In Australia, where 74.2% of adults engaged in regular physical activity in 2022, pea protein has gained significant traction among fitness enthusiasts. The ingredient's rich content of essential branched-chain amino acids (BCAA) and its role in muscle protein synthesis has made it particularly attractive to this demographic. This trend is further supported by the growing adoption of clean-label supplements and plant-based ingredients among health-conscious consumers across the region, highlighting the increasing demand for sports nutrition protein.
Asia-Pacific Pea Protein Market Trends and Insights
The consumption growth of plant protein fuels opportunities for key players in the plant protein ingredients segment
- Plant proteins are gaining interest in the Asia-Pacific market as awareness and proof of their benefits are rising in the region. Among all plant proteins, soy proteins occupy the market share with the increased acceptability of the ingredients in different foods and their increased production. The volume of soybean meal consumption in China in 2020-21 was 72.68 MMT, which was around 9% more than in 2018. High investments in research, rapid technological advancements, and advanced innovation techniques are some of the major factors resulting in the use of developed protein ingredients, including soy proteins.
- Major drivers of allergen-free plant proteins such as soy, pea, hemp, and potato are the rising adoption of a vegetarian lifestyle, increasing demand for lactose-free and gluten-free products, and growing concerns about health-related problems. Around 81% of Indian consumers restrained meat from their diet in 2021. Major benefits of plant protein ingredients over animal proteins include high nutritional value, being a good source of several vitamins and minerals, technological advancements in various food industries, and increasing demand for natural and organic substitutes, which are expected to change consumer preferences.
- The increasing consumption of plant proteins and consumer acceptance in the region are driving manufacturers to innovate products fortified with these ingredients. Major grains consumed in Japan are soybeans, rice, and wheat, along with some other types like corn and peas. The rise in plant-based protein is expected to continue to provide opportunities for food manufacturers in the coming years.

Understand The Key Trends Shaping This Market
Download PDF
China is the largest producer of dry peas in Asia-Pacific
- Dry peas are considered the major raw material source for pea protein extraction, and the production data mentioned above is for dry peas only. The above graph represents the total production of dry peas in countries including China, India, Japan, Australia, New Zealand, and South Korea. China is the largest producer of dry peas in Asia-Pacific. There are two major dried pea-producing areas in China: the Northern Dried Pea Producing Area and the Southern Dried Pea Producing Area. Ningxia, Gansu, Yunnan, and Qinghai provinces are China’s major dried pea-producing areas, accounting for over 70% of total dried pea production.
- India is the second-largest producer of peas in Asia-Pacific, after China, and the largest producer of chickpeas in the world. Yellow, green, Dum, and Kaspa are the four types of peas grown in the country. The production of dry peas in the country amounted to 1,004,402 tons in 2022, an increase of around 23.72% from 811,810 tons in 2019. Uttar Pradesh, Madhya Pradesh, and Punjab are the major pea-producing states and accounted for about 70% of the country's total pea production in 2022.
- In Australia, several types of field pea are grown, including dun pea, yellow pea, and maple pea. Victoria and South Australia have historically been the largest Australian field pea producers, but production has recently expanded considerably in Western Australia as a result of better varieties and improved production technology.
- The volume of legumes produced by Japanese agriculture is small, but their presence is significant in Japanese traditional food culture. The production of green peas is also very low in the region. Dried pea production is very low and limited, mainly in Hokkaido.

Understand The Key Trends Shaping This Market
Download PDF
OTHER KEY INDUSTRY TRENDS COVERED IN THE REPORT
- Changing lifestyles, with an increasing number of working women, are boosting the market
- Market competitiveness is boosting the growth
- The sauces segment is expected to maintain the lion's share in the Asia-Pacific market
- Soaring demand for plant-based dairy products within Asia-Pacific countries
- The growing appetite for plant-based meats in Asia-Pacific is expected to boost demand
- Healthy snacking is likely to propel the market
- Increasing demand for ruminant feed, coupled with increasing government initiatives in the industry, is driving the segment
- Rising consumption of bakery goods as a meal is driving the industry
- Increased consumer preference for convenient breakfast cereal products
- Premium confectionery is an ongoing market trend
- Increase in elderly population to drive demand
- Increasing developments spiking segmental sales
- Increasing number of health and fitness centers is driving the market
- The demand for natural/organic beauty products is boosting in the segment, owing to consumer shift toward sustainability
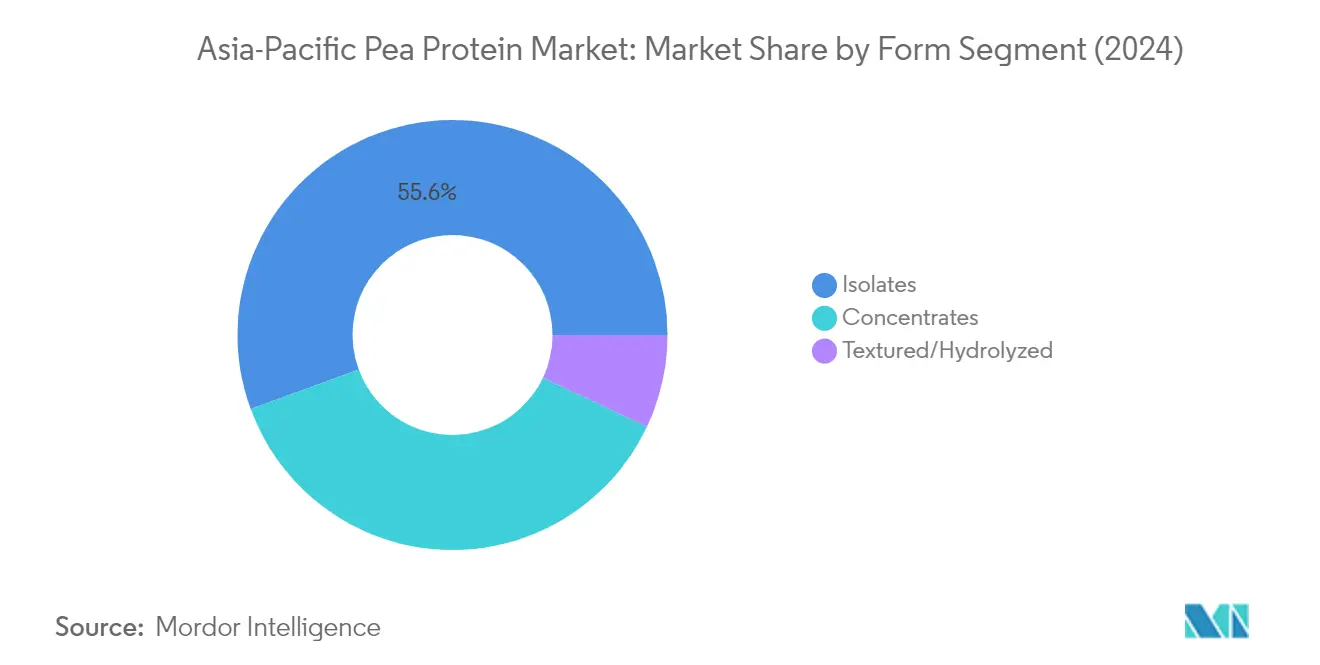
Segment Analysis: Form
Isolates Segment in Asia-Pacific Pea Protein Market
The pea protein isolate segment dominates the Asia-Pacific pea protein market, commanding approximately 56% market share in 2024. This significant market position is attributed to isolates containing a high protein concentration of 80-90%, making them particularly appealing for various applications. The segment's dominance is driven by the rising consumer inclination toward healthy food and beverages, with retail sales of health-enhancing products showing strong growth in the region. Pea protein isolates are extensively used in sports nutrition products due to their high protein content and excellent digestibility. Their versatility extends to meat alternatives, ready-to-drink beverages, and bakery applications, where they provide both nutritional and functional benefits. The segment's growth is further supported by increasing adoption in premium pet food formulations and the rising demand for clean-label supplements.
Textured/Hydrolyzed Segment in Asia-Pacific Pea Protein Market
The textured pea protein and hydrolyzed pea protein segment is emerging as the fastest-growing category in the Asia-Pacific pea protein market, projected to register a CAGR of approximately 8% during 2024-2029. This robust growth is primarily driven by increasing applications in meat alternatives and ready-to-eat products, where textured proteins effectively mimic the fibrous texture of meat. The segment's expansion is supported by rising consumer awareness about sustainable protein sources and the growing demand for plant-based meat alternatives across key markets like China and India. Textured pea proteins are gaining popularity in personal care and cosmetics applications due to their functional properties and the increasing demand for natural ingredients. The segment's growth is further accelerated by innovations in processing technologies that improve the texture and taste profiles of end products.
Remaining Segments in Form Segmentation
The pea protein concentrate segment plays a vital role in the Asia-Pacific pea protein market, offering a balanced combination of functionality and cost-effectiveness. Pea protein concentrates have gained significant traction in animal feed applications due to their nutritional profile and competitive pricing compared to other protein sources. They are widely used in food and beverage applications, particularly in bakery products and nutritional beverages, where their water-solubility, dispersibility, and oil retention properties make them ideal ingredients. The segment's growth is supported by increasing demand from the pet food industry and the rising trend of plant-based protein fortification in conventional food products.
Segment Analysis: End User
Food & Beverages Segment in Asia-Pacific Pea Protein Market
The Food & Beverages (F&B) segment maintains its commanding position in the Asia-Pacific pea protein market, accounting for approximately 97% of the total market share in 2024. This dominance is primarily driven by the increasing consumer interest in plant-based nutrition and the expansion of vegan food companies across the region. The segment's growth is particularly notable in the meat/poultry/seafood and meat alternatives sub-segment, which holds about 70% of F&B applications. The rising adoption of pea protein in various applications, including bakery products, beverages, dairy alternatives, and processed foods, further strengthens its market position. Food and beverage manufacturers are increasingly replacing conventional ingredients with plant-based alternatives like pea protein powder to produce clean-label products and boost their sustainable brand image.
Animal Feed Segment in Asia-Pacific Pea Protein Market
The Animal Feed segment is emerging as the fastest-growing sector in the Asia-Pacific pea protein market, projected to expand at approximately 9% CAGR during 2024-2029. This remarkable growth is driven by the rising demand for sustainable protein sources in animal nutrition and the increasing ownership of livestock and pets across the region. The segment's expansion is further supported by significant investments from major animal feed producers, particularly in key markets like India and China. The isolated form of pea protein in animal feed applications is gaining significant traction due to its high nutritional value and clean-label claims. The segment's growth is also bolstered by the increasing acceptance of protein-enriched feed products and rising interest in pet health across the Asia-Pacific region.
Remaining Segments in End User Segmentation
The Personal Care & Cosmetics and Supplements segments, while smaller in market share, play crucial roles in diversifying pea protein applications. The Personal Care & Cosmetics segment is gaining momentum due to increasing consumer preferences for vegan personal care items and growing awareness of pea protein's skin-rejuvenating properties. The pea protein supplement segment, particularly driven by sports nutrition applications, is expanding due to the rising health consciousness among consumers and the growing preference for plant-based protein supplements. Both segments benefit from the increasing trend toward natural and sustainable ingredients, with manufacturers developing innovative products to meet specific consumer needs in these specialized markets.
Asia-Pacific Pea Protein Market Geography Segment Analysis
Asia-Pacific Pea Protein Market in China
China dominates the Asia-Pacific pea protein market, commanding approximately 45% of the region's market volume in 2024. The country's market leadership is driven by its growing plant-based market and evolving regulatory landscape supporting the vegan food industry. The introduction of the China Vegan Food Certification (CVFC) in 2023, the first program of its kind in China, has standardized vegan claims and increased consumer trust. The food and beverage segment, particularly the meat alternatives sector, shows robust demand for pea protein ingredients. The isolated form of pea protein has gained significant traction due to its high protein content and versatile applications. The country's substantial investments in both alternative and cultivated meat sectors further strengthen its market position. Additionally, the supplements segment, particularly sports nutrition, demonstrates strong growth potential as health-conscious consumers increasingly embrace plant-based protein alternatives.
Asia-Pacific Pea Protein Market in India
India's pea protein market is primarily driven by the food and beverage segment, with significant growth potential in bakery and snacks applications. The country has witnessed increasing investments in plant-based food manufacturing, exemplified by the expansion of manufacturing facilities by various companies. The rising consumer awareness about clean-label products and health benefits associated with plant proteins has fostered market growth. Sports and performance nutrition companies are actively incorporating pea protein in their product formulations, targeting the growing fitness enthusiast demographic. The textured pea protein and hydrolyzed pea protein forms are gaining prominence, particularly in meat alternatives and ready-to-eat products. Local manufacturers are focusing on product innovations and expanding their distribution networks to capture a larger market share. The country's large vegetarian population and growing preference for plant-based proteins create a favorable environment for market expansion.
Asia-Pacific Pea Protein Market in Indonesia
Indonesia's pea protein market is experiencing significant transformation, driven by its expanding food and beverage industry and growing middle-income population. The country's food processing sector, comprising over 8,500 large and medium-sized producers alongside 1.6 million micro and small-scale producers, provides a robust foundation for market growth. The meat and meat alternatives sub-segment dominates the food and beverage category, with notable investments from plant-based startups. The supplements segment shows promising growth potential, particularly in sports nutrition, as pea protein gains popularity among health-conscious consumers due to its lactose-free and gluten-free properties. Local manufacturers are increasingly incorporating pea protein into various applications, from traditional Indonesian foods to modern health products. The country's strategic position in Southeast Asia and its large consumer base make it an attractive market for both domestic and international pea protein manufacturers.
Asia-Pacific Pea Protein Market in Australia
The Australian pea protein market is projected to grow at approximately 10% annually from 2024 to 2029, positioning it as a significant player in the region's plant protein landscape. The country's market is characterized by strong innovation in the meat alternatives segment and increasing investment in local production capabilities. Australia's position as a major exporter of bulk protein commodities, including pea protein isolate, has attracted significant market developments. The sports nutrition sub-segment shows particular promise, with athletes increasingly gravitating toward pea protein supplements due to their smoother texture and superior blending properties. The country's robust agricultural sector and commitment to sustainable farming practices provide a strong foundation for raw material sourcing. The growing consumer preference for plant-based nutrition and clean-label products continues to drive market expansion across various applications.
Asia-Pacific Pea Protein Market in Other Countries
The pea protein market in other Asia-Pacific countries, including Japan, South Korea, Malaysia, Thailand, Vietnam, and New Zealand, exhibits diverse growth patterns influenced by local dietary preferences and regulatory environments. Japan's market is characterized by sophisticated consumer preferences and stringent quality standards, while the South Korea pea protein market shows strong growth in the functional foods segment. Malaysia and Thailand are witnessing increased adoption in their respective food processing sectors, particularly in plant-based meat alternatives. Vietnam's market is evolving with changing consumer preferences and increasing health consciousness, while New Zealand focuses on premium and organic pea protein products. These markets collectively contribute to the region's dynamic growth, each offering unique opportunities based on their specific consumer needs and regulatory frameworks. The increasing awareness of plant-based proteins and growing health consciousness across these countries continue to drive market expansion.
Get Analysis on Important Geographic Markets
Download PDF
Competitive Landscape
Top Companies in Asia-Pacific Pea Protein Market
The leading companies in the Asia-Pacific pea protein market are demonstrating a strong commitment to product innovation and market expansion. Companies are focusing on developing novel pea protein variants with enhanced functionality, improved taste profiles, and better solubility characteristics to meet evolving consumer preferences. Strategic moves in the region predominantly revolve around establishing local manufacturing facilities and R&D centers to better serve the growing market demand. Operational agility is being achieved through investments in advanced processing technologies and sustainable sourcing practices. Companies are also expanding their distribution networks and forming strategic partnerships with local food manufacturers to strengthen their market presence. The emphasis on clean-label and organic certifications reflects the industry's response to increasing consumer awareness about health and sustainability.
Fragmented Market with Strong Global Players
The Asia-Pacific pea protein market exhibits a fragmented competitive landscape with a mix of global ingredient manufacturers and regional players. International companies like International Flavors & Fragrances Inc., Ingredion Incorporated, and Archer Daniels Midland Company leverage their extensive R&D capabilities and global supply chain networks to maintain market leadership. These multinational corporations benefit from their established relationships with food and beverage manufacturers and their ability to offer comprehensive ingredient solutions. Regional players, particularly from China and India, are increasingly gaining prominence by offering cost-competitive products and capitalizing on their local market knowledge.
The market is witnessing significant merger and acquisition activities as companies seek to strengthen their position and expand their product portfolios. Global players are acquiring local manufacturers to establish manufacturing bases and enhance their distribution capabilities in the region. Vertical integration strategies are being employed to secure raw material supply and optimize costs. Companies are also forming joint ventures with local partners to navigate regulatory requirements and better understand regional taste preferences. The competitive dynamics are further influenced by the entry of new players, particularly in emerging markets like China and India.
Innovation and Localization Drive Future Success
Success in the Asia-Pacific pea protein market increasingly depends on companies' ability to innovate and adapt to local market conditions. Incumbents need to focus on developing application-specific solutions that address the unique requirements of Asian food and beverage manufacturers. Investment in local R&D facilities is becoming crucial to create products that align with regional taste preferences and processing requirements. Companies must also strengthen their sustainability credentials through responsible sourcing practices and transparent supply chains. Building strong relationships with local agricultural communities and implementing farmer education programs can help secure a stable raw material supply.
Market contenders can gain ground by focusing on niche applications and underserved market segments. Developing specialized products for specific end-use applications, such as plant protein-based meat alternatives or sports nutrition, can help companies establish a strong market presence. Companies need to navigate the complex regulatory landscape and invest in obtaining necessary certifications and approvals. Building strong distribution networks and establishing partnerships with local food manufacturers can help overcome market entry barriers. The ability to offer competitive pricing while maintaining product quality will be crucial for success in price-sensitive markets. Companies must also stay ahead of potential regulatory changes and evolving consumer preferences to maintain their competitive edge.
Asia-Pacific Pea Protein Industry Leaders
Archer Daniels Midland Company
Cargill, Incorporated
Ingredion Incorporated
International Flavors & Fragrances Inc.
Kerry Group PLC
- *Disclaimer: Major Players sorted in no particular order

Need More Details on Market Players and Competitors?
Download PDF
Recent Industry Developments
- June 2022: Roquette, a global player in plant-based ingredients and a pioneer in plant proteins, announced the launch of its new NUTRALYS® range of organic textured proteins derived from peas and fava
- February 2021: DuPont's Nutrition & Biosciences and the ingredient company IFF announced their merger in 2021. The combined company will continue to operate under the name IFF. The complementary portfolios give the company leadership positions within a range of ingredients, including pea protein.
- November 2020: Food ingredients manufacturer Ingredion acquired the remaining ownership in Verdient Foods Inc. In 2018, the company established a joint venture with Verdient Foods Inc. to produce pulse-based protein concentrates and flours from peas for consumer food and animal nutrition applications. The acquisition will enable Ingredion to accelerate net sales growth, further expand its manufacturing capability, and serve increasing consumer demand for plant-based foods.
Asia-Pacific Pea Protein Market Report Scope
Concentrates, Isolates, Textured/Hydrolyzed are covered as segments by Form. Animal Feed, Food and Beverages, Personal Care and Cosmetics, Supplements are covered as segments by End User. Australia, China, India, Indonesia, Japan, Malaysia, New Zealand, South Korea, Thailand, Vietnam are covered as segments by Country.Form
| Concentrates |
| Isolates |
| Textured/Hydrolyzed |
End User
| Animal Feed | ||
| Food and Beverages | By Sub End User | Bakery |
| Beverages | ||
| Breakfast Cereals | ||
| Condiments/Sauces | ||
| Confectionery | ||
| Dairy and Dairy Alternative Products | ||
| Meat/Poultry/Seafood and Meat Alternative Products | ||
| RTE/RTC Food Products | ||
| Snacks | ||
| Personal Care and Cosmetics | ||
| Supplements | By Sub End User | Baby Food and Infant Formula |
| Elderly Nutrition and Medical Nutrition | ||
| Sport/Performance Nutrition | ||
Country
| Australia |
| China |
| India |
| Indonesia |
| Japan |
| Malaysia |
| New Zealand |
| South Korea |
| Thailand |
| Vietnam |
| Rest of Asia-Pacific |
| Form | Concentrates | ||
| Isolates | |||
| Textured/Hydrolyzed | |||
| End User | Animal Feed | ||
| Food and Beverages | By Sub End User | Bakery | |
| Beverages | |||
| Breakfast Cereals | |||
| Condiments/Sauces | |||
| Confectionery | |||
| Dairy and Dairy Alternative Products | |||
| Meat/Poultry/Seafood and Meat Alternative Products | |||
| RTE/RTC Food Products | |||
| Snacks | |||
| Personal Care and Cosmetics | |||
| Supplements | By Sub End User | Baby Food and Infant Formula | |
| Elderly Nutrition and Medical Nutrition | |||
| Sport/Performance Nutrition | |||
| Country | Australia | ||
| China | |||
| India | |||
| Indonesia | |||
| Japan | |||
| Malaysia | |||
| New Zealand | |||
| South Korea | |||
| Thailand | |||
| Vietnam | |||
| Rest of Asia-Pacific | |||
Need A Different Region or Segment?
Customize Now
Market Definition
- End User - The Protein Ingredients Market operates on a B2B basis. Food, Beverages, Supplements, Animal Feed, and Personal Care & Cosmetic manufacturers are considered to be end-consumers in the market studied. The scope excludes manufacturers buying liquid/dry whey to be used for application as a binding agent or thickener or other non-protein applications.
- Penetration Rate - Penetration Rate is defined as the percentage of Protein-Fortified End User Market Volume in the Overall End User Market Volume.
- Average Protein Content - Average protein content is the average protein content present per 100 g of product manufactured by all end-user companies considered under the scope of this report.
- End User Market Volume - End-user market volume is the consolidated volume of all types and forms of end-user products in the country or region.
| Keyword | Definition |
|---|---|
| Alpha-lactalbumin (α-Lactalbumin) | It is a protein that regulates the production of lactose in the milk of almost all mammalian species. |
| Amino acid | It is an organic compound that contains both amino and carboxylic acid functional groups, which are required for the synthesis of body protein and other important nitrogen-containing compounds, such as creatine, peptide hormones, and some neurotransmitters. |
| Blanching | It is the process of briefly heating vegetables with steam or boiling water. |
| BRC | British Retail Consortium |
| Bread improver | It is a flour-based blend of several components with specific functional properties designed to modify dough characteristics and give quality attributes to bread. |
| BSF | Black Soldier Fly |
| Caseinate | It is a substance produced by adding an alkali to acid casein, a derivative of casein. |
| Celiac disease | Celiac disease is an immune reaction to eating gluten, a protein found in wheat, barley, and rye. |
| Colostrum | It is a milky fluid that’s released by mammals that have recently given birth before breast milk production begins. |
| Concentrate | It is the least processed form of protein and has a protein content ranging from 40-90% by weight. |
| Dry protein basis | It refers to the percentage of "pure protein" present in a supplement after the water in it is completely removed through heat. |
| Dry whey | It is the product resulting from drying fresh whey which has been pasteurized and to which nothing has been added as a preservative. |
| Egg protein | It is a mixture of individual proteins, including ovalbumin, ovomucoid, ovoglobulin, conalbumin, vitellin, and vitellenin. |
| Emulsifier | It is a food additive that facilitates the blending of foods that are immiscible with one another, such as oil and water. |
| Enrichment | It is the process of addition of micronutrients that are lost during the processing of the product. |
| ERS | Economic Research Service of the USDA |
| Extrusion | It is the process of forcing soft mixed ingredients through an opening in a perforated plate or die designed to produce the required shape. The extruded food is then cut to a specific size by blades. |
| Fava | Also known as Faba, it is another word for yellow split beans. |
| FDA | Food and Drug Administration |
| Flaking | It is a process in which typically a cereal grain (like corn, wheat, or rice) is broken down into grits, cooked with flavors and syrups, and then pressed into flakes between cooled rollers. |
| Foaming agent | It is a food ingredient that makes it possible to form or maintain a uniform dispersion of a gaseous phase in a liquid or solid food. |
| Foodservice | It refers to the part of the food industry which includes businesses, institutions, and companies which prepare meals outside the home. It includes restaurants, school and hospital cafeterias, catering operations, and many other formats. |
| Fortification | It is the deliberate addition of micronutrients that are not found in them naturally or which are lost during processing, to improve a food product's nutritional value. |
| FSANZ | Food Standards Australia New Zealand |
| FSIS | Food Safety and Inspection Service |
| FSSAI | Food Safety and Standards Authority of India |
| Gelling agent | It is an ingredient that functions as a stabilizer and thickener to provide thickening without stiffness through the formation of gel. |
| GHG | Greenhouse Gas |
| Gluten | It is a family of proteins found in grains, including wheat, rye, spelt, and barley. |
| Hemp | It is a botanical class of Cannabis sativa cultivars grown specifically for industrial or medicinal use. |
| Hydrolysate | It is a form of protein manufactured by exposing the protein to enzymes that can partially break the bonds between the protein's amino acids and break down large, complicated proteins into smaller pieces. Its processing makes it easier and quicker to digest. |
| Hypoallergenic | It refers to a substance that causes fewer allergic reactions. |
| Isolate | It is the purest and most processed form of protein which has undergone separation to obtain a pure protein fraction. It typically contains ≥ 90% of protein by weight. |
| Keratin | It is a protein that helps form hair, nails, and the outer layer of skin. |
| Lactalbumin | It is the albumin contained in milk and obtained from whey. |
| Lactoferrin | It is an iron‑binding glycoprotein that is present in the milk of most mammals. |
| Lupin | It is the yellow legume seeds of the genus Lupinus. |
| Millenial | Also known as Generation Y or Gen Y, it refers to the people born from 1981 to 1996. |
| Monogastric | It refers to an animal with a single-compartmented stomach. Examples of monogastric include humans, poultry, pigs, horses, rabbits, dogs, and cats. Most monogastric are generally unable to digest much cellulose food materials such as grasses. |
| MPC | Milk protein concentrate |
| MPI | Milk protein isolate |
| MSPI | Methylated soy protein isolate |
| Mycoprotein | Mycoprotein is a form of single-cell protein, also known as fungal protein, derived from fungi for human consumption. |
| Nutricosmetics | It is a category of products and ingredients that act as nutritional supplements to care for skin, nails, and hair natural beauty. |
| Osteoporosis | It is a medical condition in which the bones become brittle and fragile from loss of tissue, typically as a result of hormonal changes, or deficiency of calcium or vitamin D. |
| PDCAAS | Protein digestibility-corrected amino acid score (PDCAAS) is a method of evaluating the quality of a protein based on both the amino acid requirements of humans and their ability to digest it. |
| Per-capita consumption of animal protein | It is the average amount of animal protein (such as milk, whey, gelatin, collagen, and egg proteins) that is readily available for consumption by each person in an actual population. |
| Per-capita consumption of plant protein | It is the average amount of plant protein (such as soy, wheat, pea, oat, and hemp proteins) that is readily available for consumption by each person in an actual population. |
| Quorn | It is a microbial protein manufactured using mycoprotein as an ingredient, in which the fungus culture is dried and mixed with egg albumen or potato protein, which acts as a binder, and then is adjusted in texture and pressed into various forms. |
| Ready-to-Cook (RTC) | It refers to food products that include all of the ingredients, where some preparation or cooking is required through a process that is given on the package. |
| Ready-to-Eat (RTE) | It refers to a food product prepared or cooked in advance, with no further cooking or preparation required before being eaten. |
| RTD | Ready-to-Drink |
| RTS | Ready-to-Serve |
| Saturated fat | It is a type of fat in which the fatty acid chains have all single bonds. It is generally considered unhealthy. |
| Sausage | It is a meat product made of finely chopped and seasoned meat, which may be fresh, smoked, or pickled and which is then usually stuffed into a casing. |
| Seitan | It is a plant-based meat substitute made out of wheat gluten. |
| Softgel | It is a gelatin-based capsule with a liquid fill. |
| SPC | Soy protein concentrate |
| SPI | Soy protein isolate |
| Spirulina | It is a biomass of cyanobacteria that can be consumed by humans and animals. |
| Stabilizer | It is an ingredient added to food products to help maintain or enhance their original texture, and physical and chemical characteristics. |
| Supplementation | It is the consumption or provision of concentrated sources of nutrients or other substances that are intended to supplement nutrients in the diet and is intended to correct nutritional deficiencies. |
| Texturant | It is a specific type of food ingredient that is used to control and alter the mouthfeel and texture of food and beverage products. |
| Thickener | It is an ingredient that is used to increase the viscosity of a liquid or dough and make it thicker, without substantially changing its other properties. |
| Trans fat | Also called trans-unsaturated fatty acids or trans fatty acids, it is a type of unsaturated fat that naturally occurs in small amounts in meat. |
| TSP | Textured soy protein |
| TVP | Textured vegetable protein |
| WPC | Whey protein concentrate |
| WPI | Whey protein isolate |
Need More Details on Market Definition?
Ask a Question
Research Methodology
Mordor Intelligence follows a four-step methodology in all our reports.
- Step-1: Identify Key Variables: The quantifiable key variables (industry and extraneous) pertaining to the specific product segment and country are selected from a group of relevant variables & factors based on desk research & literature review; along with primary expert inputs. These variables are further confirmed through regression modeling (wherever required).
- Step-2: Build a Market Model: In order to build a robust forecasting methodology, the variables and factors identified in Step-1 are tested against available historical market numbers. Through an iterative process, the variables required for market forecast are set and the model is built on the basis of these variables.
- Step-3: Validate and Finalize: In this important step, all market numbers, variables and analyst calls are validated through an extensive network of primary research experts from the market studied. The respondents are selected across levels and functions to generate a holistic picture of the market studied.
- Step-4: Research Outputs: Syndicated Reports, Custom Consulting Assignments, Databases & Subscription Platforms

Get More Details On Research Methodology
Download PDF


