
Asia-Pacific Olive Market Analysis by Mordor Intelligence
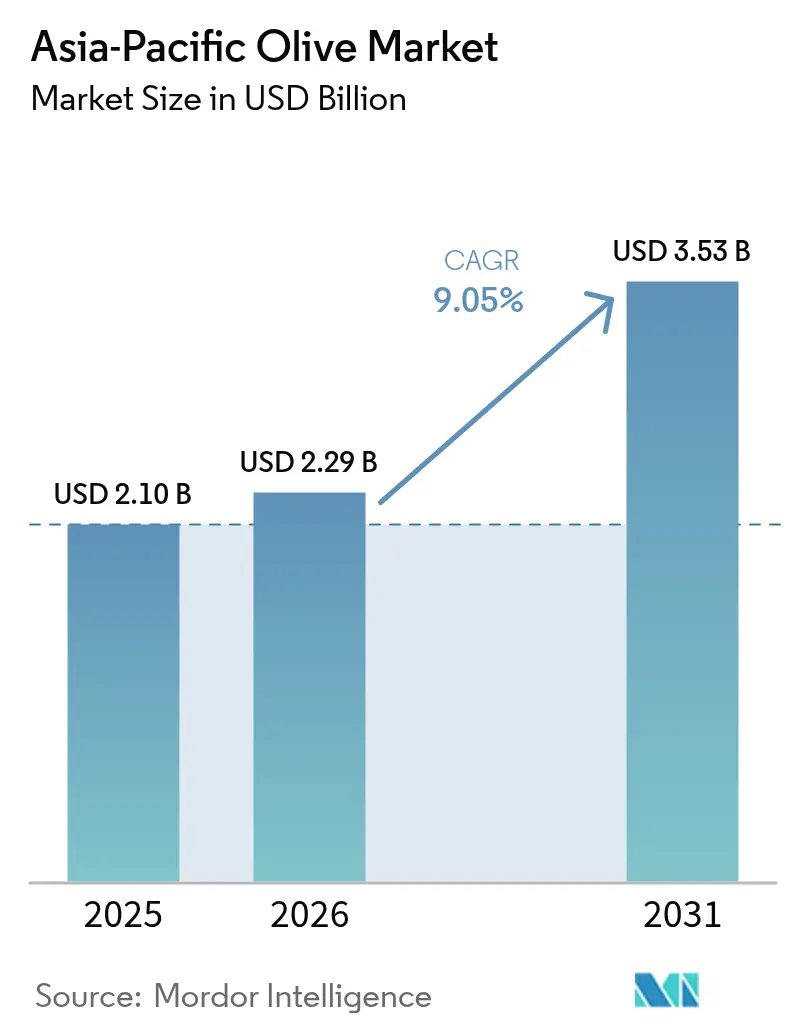
The Asia-Pacific olive market size in 2026 is estimated at USD 2.29 billion, growing from 2025 value of USD 2.10 billion with 2031 projections showing USD 3.53 billion, growing at 9.05% CAGR over 2026-2031. China anchors current demand, India contributes the steepest growth curve, and Australia supplies the most premium exports. Rising olive yields in northern China and super-high-density groves in Australia widen regional self-sufficiency, while shifting consumer diets, expanding the Hotel, Restaurant, and Cafés/Catering (HoReCa) channels, and government reforestation grants reinforce momentum. Institutional investors support large-scale estates, precision irrigation reduces water risk, and e-commerce facilitates urban smallholder plots, cold-chain gaps beyond tier-one cities, and climate volatility moderate the overall pace.
Key Report Takeaways
- By geography, China held 43.62% market share of the Asia-Pacific olive market size in 2025, while India is projected to expand at a 11.93% CAGR through 2031.
Note: Market size and forecast figures in this report are generated using Mordor Intelligence’s proprietary estimation framework, updated with the latest available data and insights as of 2026.
Asia-Pacific Olive Market Trends and Insights
Drivers Impact Analysis*
| Driver | (~) % Impact on CAGR Forecast | Geographic Relevance | Impact Timeline |
|---|---|---|---|
| Rising olive output in China and Australia | +2.5% | China, Australia, and spillover to wider Asia-Pacific | Medium term (2-4 years) |
| Dietary shift toward Mediterranean foods | +1.5% | Japan, China, and India's urban centers | Long term (≥4 years) |
| Growth of Hotel, Restaurant, and Cafés/Catering (HoReCa) and food-service channels | +2.0% | China, India, and Japan | Short term (≤2 years) |
| Government reforestation and diversification grants | +1.2% | India, and China targeted provinces | Medium term (2-4 years) |
| Precision irrigation in drought-prone groves | +1.0% | Australia, India, and semi-arid zones | Medium term (2-4 years) |
| E-commerce penetration for fresh produce | +1.8% | China, Japan, India, Tier-one and Tier-two cities | Short term (≤2 years) |
| Source: Mordor Intelligence | |||
Rising Olive Output in China and Australia
China's Gansu Province cultivates over 40,000 hectares of olive groves, primarily centered in Longnan City, producing 30,000 metric tons of olive oil annually. Meanwhile, Yunnan, Sichuan, and Shaanxi provinces are expanding experimental plots, supported by poverty-alleviation subsidies and agricultural modernization programs. Australia's super-high-density plantings span approximately 7,000 hectares across multiple states, leveraging mechanical harvesting and precision irrigation to achieve yields that represent 36% of the global extra-virgin olive oil output, despite occupying only 3% of the planted area. The International Olive Council's September 2024 engagement with Chinese officials aims to harmonize quality standards and expand technical training, potentially accelerating China's transition from net importer to self-sufficient producer within the forecast period.
Dietary Shift Toward Mediterranean Foods
In 2023, Japan imported 58,000 metric tons of olive oil, valued at USD 250 million. The primary suppliers were Spain, Italy, and Greece, driven by health-conscious consumers who associate olive oil with cardiovascular benefits and longevity. In China, urban middle-class households are increasingly purchasing olive oil through platforms like Tmall and JD.com. Premium Spanish and Italian brands on these platforms command price premiums of 30% to 50% over domestic rapeseed and soybean oils, reflecting consumer willingness to pay for perceived quality and authenticity. In India, the online grocery market, supported by quick-commerce platforms such as Blinkit, Zepto, and Swiggy Instamart, facilitates trial purchases of specialty items, including olives, by delivering fresh produce within 10 to 15 minutes in metropolitan areas. Meanwhile, Japan's aging population, with 29% of residents projected to be over 65 years old in 2024, is driving demand for nutrient-dense foods. Platforms like Rakuten, Amazon Fresh, and Oisix are focusing on offering premium fresh produce to cater to this demographic.
Growth of Hotel, Restaurant, and Cafés/Catering (HoReCa) and Food-Service Channels
India's hotel, restaurant, and institutional catering sector, driven by rising disposable incomes, urbanization, and the proliferation of international cuisine chains featuring Mediterranean menus. Fresh fruit imports into India totaled USD 664 million in 2024, with olives occupying a niche but growing share as chefs prioritize ingredient authenticity and visual appeal for Instagram-driven dining experiences. Japan's food-service sector is increasingly featuring Mediterranean-inspired menus, with olive oil and fresh olives appearing in fusion dishes that blend European and Japanese culinary traditions. This trend is supported by the country's online grocery market, which facilitates ingredient discovery [1]Source: Japan External Trade Organization, “Olive Oil Import Statistics 2023,” jetro.go.jp. Cobram Estate exports to 13 countries, including Japan, Singapore, and New Zealand, leveraging its vertically integrated supply chain to guarantee harvest-to-shelf traceability that resonates with quality-focused Hotel, Restaurant, and Cafés/Catering (HoReCa) buyers.
Government Reforestation and Agri-Diversification Grants
India's National Mission on Edible Oils-Oilseeds has targeted 69.7 million metric tons of oilseed production by 2030-31. The program also imposes a 20% import duty on edible oils to incentivize domestic cultivation. The primary focus remains on sunflower, soybean, and mustard, rather than olives. China's Gansu Province integrates olive cultivation into poverty alleviation and reforestation initiatives, offering subsidies for drip irrigation infrastructure and seedling procurement. The central government's 14th Five-Year Plan prioritizes agricultural diversification to reduce reliance on grain imports and stabilize rural incomes. Australia's state governments provide grants for water-use efficiency and climate adaptation, with programs such as the Murray-Darling Basin Plan allocating funds for precision irrigation systems that reduce water consumption by 30 to 40% while maintaining yields, directly benefiting olive growers in drought-prone regions.
Restraints Impact Analysis*
| Restraint | (~) % Impact on CAGR Forecast | Geographic Relevance | Impact Timeline |
|---|---|---|---|
| Extreme climatic anomalies (heatwaves, typhoons) | -1.5% | Australia, India (Rajasthan), and Rest of Asia-Pacific (Typhoon-prone zones) | Short term (≤2 years) |
| High cost of cultivation inputs and labor | -1.0% | Japan, Australia, and India (Smallholder zones) | Medium term (2-4 years) |
| Smallholder fragmentation is limiting economies of scale | -0.8% | India, and China (Non-Commercial zones) | Long term (≥4 years) |
| Limited cold-chain nodes outside Tier-1 cities | -1.2% | India, Rest of Asia-Pacific (Tier-2 and Tier-3 cities) | Medium term (2-4 years) |
| Source: Mordor Intelligence | |||
Extreme Climatic Anomalies (Heatwaves, Typhoons)
The Asia-Pacific region incurs annual disaster-related economic losses, with extreme heatwaves, typhoons, and floods disrupting agricultural production cycles and degrading fruit quality [2]Source: UN ESCAP, “Disaster Risk Report 2024,” unescap.org. Olive lace bug infestations in Victoria, South Australia, and Western Australia have resulted in multi-seasonal losses, with some growers reporting yield declines of 20 to 30%. This has prompted the Australian Olive Association to issue integrated pest management guidelines that emphasize biological controls and canopy monitoring. India's Rajasthan belt experiences summer temperatures exceeding 45 degrees Celsius, which trigger flower abortion and reduce fruit set. Meanwhile, erratic monsoon patterns between 2023 and 2024 resulted in either waterlogging or prolonged dry spells, stressing trees and lowering oil content below the 19% threshold required for commercial viability.
High Cost of Cultivation Inputs and Labor
Japan's agricultural labor costs rank among the highest globally, with hourly wages exceeding USD 10 in 2024, deterring domestic olive cultivation beyond the experimental plots on Shodoshima Island in Kagawa Prefecture, where production remains artisanal and insufficient to meet local demand. Australia's super-high-density olive groves require upfront investments of USD 9,800 to USD 13,000 per hectare for drip irrigation infrastructure, mechanical harvesters, and high-density seedlings, with payback periods extending from seven to ten years, which limits adoption among smaller growers. India's smallholder farmers face input cost inflation, with drip irrigation kits priced at USD 600 to USD 960 per hectare, equivalent to one to two years of net income from traditional crops such as wheat or mustard. The absence of crop insurance for olives magnifies the downside risk in the Indian Council of Agricultural Research (ICAR), India. Rajasthan Olive Cultivation Limited (ROCL) issued a manpower contract tender valued at USD 96,000 in 2025 for farm maintenance across six plantations, highlighting the labor-intensive nature of olive cultivation in regions where mechanization remains limited.
*Our forecasts treat driver/restraint impacts as directional, not additive. The impact forecasts reflect baseline growth, mix effects, and variable interactions.
Geography Analysis
China commanded 43.62% of Asia-Pacific fresh olive consumption in 2025, driven by Gansu Province's 40,000-hectare olive belt that generates USD 840 million in annual output, yet olive oil imports plunged 64% year-over-year between October 2023 and February 2024, reflecting a structural pivot toward domestic supply chains as government subsidies incentivize provincial self-sufficiency and the International Olive Council engaged Chinese officials in September 2024 to harmonize quality protocols . China's Yunnan, Sichuan, and Shaanxi provinces expand experimental olive plots supported by poverty-alleviation subsidies and agricultural modernization programs, while the International Olive Council hosted a Chinese delegation in September 2024 to harmonize quality protocols and expand technical training, potentially accelerating the country's transition from net importer to self-sufficient producer within the forecast period.
India emerges as the fastest-growing geography at 11.93% CAGR for through 2031, propelled by the National Mission on Edible Oils-Oilseeds allocation ofUSD 1.2 billion for 2024-2031 and Rajasthan's 1,000-hectare experimental plantings, though roughly half of participating farmers abandoned fields after Israeli technical support ceased in 2020, and ROCL issued multiple tenders in 2025 for farm maintenance valued at USD 96,000, signaling renewed government commitment. India's Rajasthan Olive Cultivation Limited (ROCL) issued multiple tenders in 2025 for farm maintenance at sites including Barore, Bakalia, Basbisna, Tinkirudi, Lunkaransar, Bassi, and Santhu, with a manpower contract valued at USD 96,000, signaling renewed government commitment to salvage existing plantations, and some fruit samples achieved over 19% oil content, approaching international benchmarks.
Australia's super-high-density plantings span approximately 7,000 hectares across multiple states, leveraging mechanical harvesting and precision irrigation to achieve yields that represent 36% of global extra-virgin olive oil output despite occupying only 3% of planted area, while olive lace bug infestations in Victoria, South Australia, and Western Australia caused multi-season losses that prompted growers to adopt integrated pest management protocols. Japan's online grocery sales reached USD 23.5 billion in 2024, representing 12% of total grocery spending, with platforms such as Rakuten, Amazon Fresh, and Oisix emphasizing premium fresh produce and same-day delivery, facilitating trial purchases of specialty items, including olives.
Regulatory Landscape
Regulation in the Asia-Pacific olive market is anchored in national food safety and product identity standards that govern olive oil and olive-pomace oil composition, classification, and labeling for both domestically produced and imported products. In China, the recommended national standard GB/T 23347-2021 (as amended by GB/T 23347-2021/XG1-2023) provides a technical baseline that producers and importers align with for market access, supporting quality normalization as domestic output expands in provinces such as Gansu.
For cross-border trade, compliance is shaped by the importing country framework and widely used international benchmarks. India enforces the Food Safety and Standards (Import) Regulations, 2017 through FSSAI for licensing, inspection, and labeling at customs, while Australia and New Zealand require products to comply with the Australia New Zealand Food Standards Code (including Standard 2.4.1 for edible oils). Across the region, the International Olive Council trade standard (T15/NC No 3/Rev. 15) serves as a common reference point for specifications used in export documentation and buyer audits, especially for HoReCa and modern retail procurement.
Value Chain Analysis
The Asia-Pacific olive value chain spans nursery and orchard establishment (seedlings, irrigation kits, fertilizer, and mechanization), cultivation and harvest, rapid post-harvest handling, milling/pressing (for oil) or brining/processing (for table olives), then packaging, testing/quality documentation, and distribution through importers, wholesalers, modern retail, HoReCa, and e-commerce. Australia is relatively integrated, with super-high-density groves and mechanical harvesting supporting scale economics, while brand-led exporters and vertically integrated players use traceability and quality assurance to serve premium channels across Asia-Pacific. China is building production depth around core growing belts (notably Longnan), with expansion tied to irrigation and logistics upgrades that reduce spoilage risk and improve processing timeliness.
Key bottlenecks remain time sensitivity and infrastructure: fresh olives require fast processing to protect oil quality, and table olives and bottled oils depend on reliable storage and temperature-controlled distribution beyond tier-one cities. The cost and availability of water, drip irrigation systems, and mechanization shape orchard viability, while pest pressure and climatic anomalies raise variability and reinforce the importance of agronomy support, integrated pest management protocols, and standardized testing aligned with national and IOC specifications. Regional trade architectures such as RCEP support documentation alignment and non-tariff measure coordination, which can lower friction for cross-border movement of olive oils and related inputs when suppliers meet destination standards.
Market Opportunities and Future Outlook
A primary opportunity sits in expanding regional processing and cold-chain capability to support higher domestic throughput and wider distribution beyond tier-one urban markets. Evidence of infrastructure-led moves includes the Philippines Department of Agriculture commitment of USD 52.5 million to build 99 cold storage facilities in 2025, addressing constraints that affect specialty fresh produce handling across archipelagic and secondary-city routes. For olives, incremental cold-chain nodes, better inventory rotation, and quality testing capacity create whitespace for importers, retailers, and food-service distributors aiming to reduce leakage and stabilize product attributes.
On the supply side, orchard investment and processing modernization are visible in both mature and emerging production zones. In Australia, institutional-backed conversions to super-high-density groves (for example, GO.FARM activity in large-scale property conversions announced in 2024) and continued emphasis on water-use efficiency point to scalable models that can serve domestic and export channels when irrigation access is secured. In China, the International Olive Council engagement with Chinese officials (September 2024) to harmonize quality standards and expand technical training supports domestic brand-building and buyer confidence, while province-led development in established belts (such as Gansu/Longnan) highlights opportunities for milling capacity upgrades, quality certification services, and branded retail formats that differentiate local oils against imported Spanish and Italian offerings on platforms like Tmall and JD.com.
Recent Industry Developments
- July 2026: Cobram Estate Olives reported its 2026 Australian harvest produced 11.3 million litres of olive oil. This outcome reflects expanded groves and higher throughput, supporting supply to premium retail and HoReCa buyers across Asia-Pacific.
- February 2025: GoFarm completed the acquisition of a Ferrero hazelnut orchard project valued at about A$60 million for conversion into high-density olive groves. The deal adds scalable orchard footprint and reinforces institutional capital toward long-cycle perennial crops, tightening competitive dynamics for land and water suited to olives.
- October 2024: GoFarm secured about A$150 million in investment, including participation from Qantas Super, to fund conversion of water-rich agricultural land into high-density olive groves. The financing accelerates domestic supply build-out in Australia, a key premium supplier within the Asia-Pacific olive value chain.


Research Methodology Framework and Report Scope
Market Definition and Coverage
This market covers the value of olives consumed across Asia-Pacific, including table olives and olives used in olive oil, measured at manufacturer and importer level values within the region.
Scope exclusions: Excludes retail margins and downstream marketing costs that sit after the importer or manufacturer selling price.
Segmentation Overview
- By Country
- China
- Production Analysis (Volume)
- Consumption Analysis (Volume and Value)
- Import Analysis (Volume and Value)
- Export Analysis (Volume and Value)
- Price Trend Analysis
- Japan
- Production Analysis (Volume)
- Consumption Analysis (Volume and Value)
- Import Analysis (Volume and Value)
- Export Analysis (Volume and Value)
- Price Trend Analysis
- India
- Production Analysis (Volume)
- Consumption Analysis (Volume and Value)
- Import Analysis (Volume and Value)
- Export Analysis (Volume and Value)
- Price Trend Analysis
- Australia
- Production Analysis (Volume)
- Consumption Analysis (Volume and Value)
- Import Analysis (Volume and Value)
- Export Analysis (Volume and Value)
- Price Trend Analysis
- China
Data Sources, Market Sizing, and Validation
Desk Research
To set up the base dataset, we reviewed public agriculture and trade statistics to understand how olives move through the region and how fast demand is changing. Useful anchors came from sources such as FAOSTAT for production and yield context, UN Comtrade for import and export flows, and national statistics portals for food and beverage consumption indicators.
We also checked customs and tariff references, plus food standards and labeling guidance published by regional regulators, since these can affect product mix and the reported trade codes used in statistics. Along with this, we used company annual reports, investor presentations, and reputable press to map import concentration and pricing direction, then filled remaining financial context through paid subscriptions for company financials and shipment-level import and export checks. These sources are illustrative, and we used additional public and paid references to collect, validate, and clarify the final dataset.
Primary Interviews and Surveys
Primary work was used to pressure-test the desk assumptions, especially around conversion between olive fruit and olive oil demand signals, channel mix (retail versus foodservice), and typical price movement by grade. We spoke with growers, importers, distributors, and foodservice buyers across key Asia-Pacific consuming and trading countries, then ran follow-up checks when figures did not reconcile cleanly.
Distribution of primary research fieldwork respondents
| Company type | Respondent position |
|---|---|
| Top tier: 33% | CXOs: 12% |
| Mid tier: 52% | Functional/Unit leaders: 34% |
| Smaller Players: 15% | Managers: 54% |
Market-Sizing & Forecasting
Sizing started with a top-down build that reconstructs the demand pool from country-level consumption signals and trade flows, then we adjusted for re-exports and price differences by product form. To keep the totals realistic, we corroborated the results using selective bottom-up approximations, including rolling up sampled importer volumes, distributor channel checks, and price times volume calculations for key markets.
A few practical inputs shaped the model, including import penetration trends, average unit values from customs lines, production seasonality in main growing countries, foodservice recovery versus at-home use, and the share shift between table olives and olives used for oil. Where coverage was thin for smaller markets, gaps were handled by proxying from similar countries using per capita consumption and income-linked adoption patterns, and then re-testing outputs through expert calls.
For forecasting, scenario analysis was used around price and availability shocks, and then a light multivariate regression linked demand to variables such as real income growth, urbanization, and relative edible oil pricing. Results were reviewed with primary respondents for realism.
Data Validation & Update Cycle
We checked the model through multiple passes by comparing totals against independent signals such as regional import value trends, production and yield direction, and observed price movements in key hubs. When an anomaly was found, we isolated the driver, reworked the related assumptions, and re-contacted the expert to confirm what changed on the ground.
Before sign-off, the final series went through variance checks across countries and years to keep the trend explainable, rather than jumpy without a clear reason. Reports are refreshed annually, and interim updates are made when major trade, policy, or supply events materially change volumes or pricing, followed by a final pre-delivery review so clients receive the latest view.
Mordor Intelligence's Asia Pacific Olive Market Size Versus Other Published Estimates
Published market sizes for olives in Asia-Pacific can vary widely, and the differences usually come down to what is counted, the price point used for valuation, and how trade flows are treated across countries.
Retailer margins and in-store promotion costs sit outside Mordor Intelligence's scope, which keeps the value closer to manufacturer and importer pricing. Some other estimates blend in downstream markups, or mix olive oil retail value with fresh and processed olive trade lines.
Benchmark comparison
| Source | Market Size | Gaps in Research Methodology |
|---|---|---|
| Mordor Intelligence | USD 2.10 B (2025) | |
| Industry Publisher A | USD 12.70 B (2023) | Uses a broader product and application frame that can combine olive oil-led value with multiple end uses and channel layers, which can inflate value versus manufacturer or importer pricing. |
| Trade Data Journal B | USD 0.44 B (2024) | Focuses on olives under a trade product code and values at nominal wholesale terms for producers and importers, which can undercount processed forms and consumption outside tracked trade lines. |
The spread is mainly explained by downstream value add, product form coverage (table olives versus oil-linked demand), and whether wholesale versus expanded channel value is included. By keeping inputs tied to trade, pricing, and demand signals that can be checked country by country, the estimate remains transparent and can be repeated with the same steps in future refreshes.


Key Questions Answered in the Report
What is the current value of the Asia-Pacific olive market in 2026?
The market is projected to reach USD 2.29 billion in 2026 and is projected to grow to USD 3.53 billion by 2031.
Which country consumes the most fresh olives in the Asia-Pacific?
China leads with 43.62% market share of the Asia-Pacific olive market size in 2025, anchored by the 40,000-ha Gansu olive belt.
Which country will grow fastest through 2031?
India is forecast to post a 11.93% CAGR, driven by government edible-oil missions and Rajasthan pilot groves.
What role does e-commerce play in olive distribution?
Digital grocery platforms in China, Japan, and India enable 30-minute delivery in major cities, expanding consumer access to premium olives.
Page last updated on:


 Your data is secure and never sold or shared.


