
Market Overview
| Study Period | 2021 - 2031 |
|---|---|
| Forecast Data Period | 2026 - 2031 |
| Base Year Market Size (2025) | USD 191.01 Billion |
| Market Size (2026) | USD 199.21 Billion |
| Market Size (2031) | USD 245.67 Billion |
| Growth Rate (2026 - 2031) | 4.29 % |
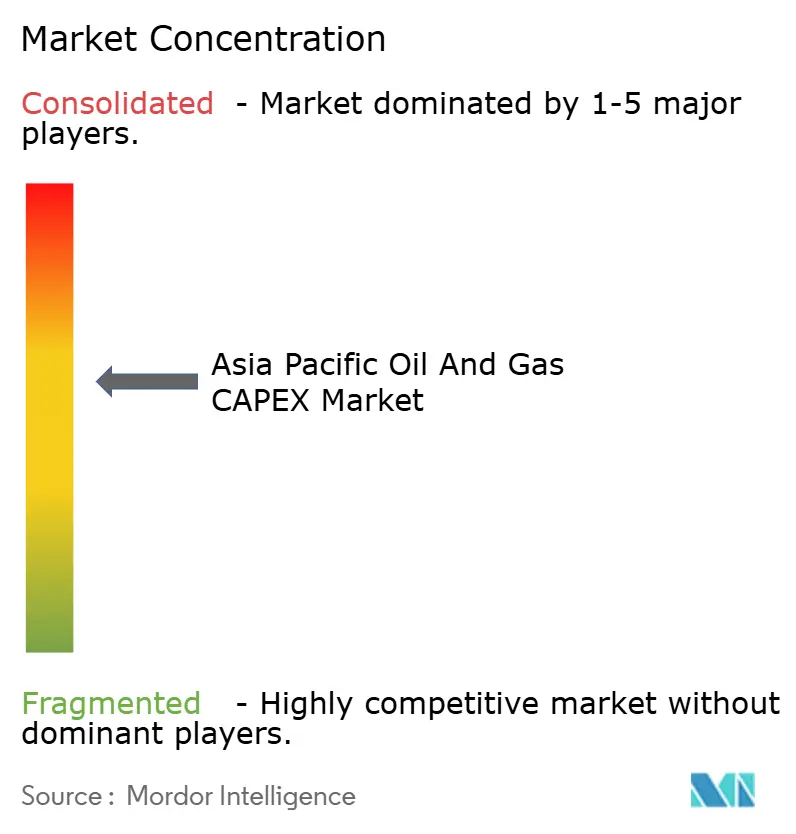
| Market Concentration | Medium |
Major Players *Disclaimer: Major Players sorted in no particular order Image © Mordor Intelligence. Reuse requires attribution under CC BY 4.0. | |
Asia Pacific Oil and Gas CAPEX Market Analysis by Mordor Intelligence
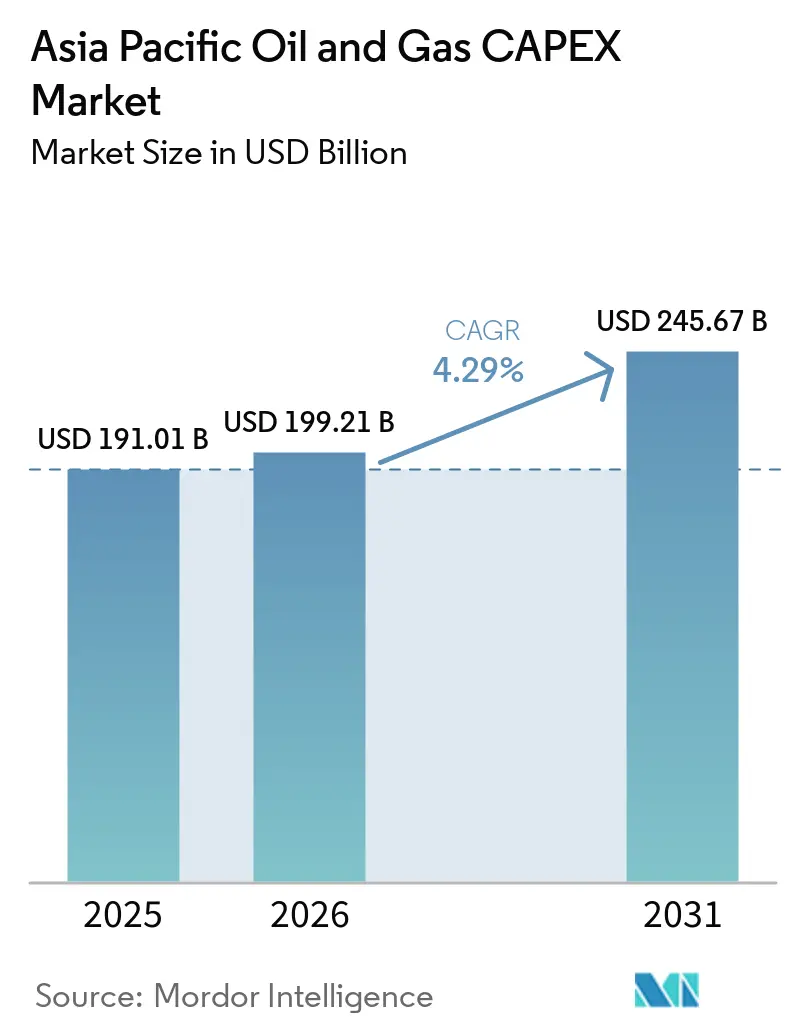
The Asia Pacific Oil And Gas CAPEX Market size was valued at USD 191.01 billion in 2025 and estimated to grow from USD 199.21 billion in 2026 to reach USD 245.67 billion by 2031, at a CAGR of 4.29% during the forecast period (2026-2031).
Persistently high regional energy demand, sizable domestic resource potential, and accelerated transition infrastructure are keeping spending on an upward trajectory despite tightening green-finance rules. Governments deploy capital toward new LNG, hydrogen, and CCUS assets to secure supply, while national oil companies maintain conventional upstream programs, safeguarding energy security during the transition period. International operators are rotating their portfolios toward the region because regulatory frameworks are clearer than in several Middle East jurisdictions, and because deep-water and LNG projects now deliver globally competitive break-even levels. Technology spending also rises as digital oilfield programs extend asset life, and modular refinery projects enhance product slate flexibility across India and China.
Key Report Takeaways
- By sector, upstream commanded 71.25% of the Asia Pacific oil and gas CAPEX market share in 2025; the downstream segment is the fastest-growing, advancing at a 4.98% CAGR to 2031.
- By location, onshore projects accounted for 65.25% of the Asia Pacific oil and gas CAPEX market size in 2025, while offshore spend is projected to expand at a 6.84% CAGR over the same horizon.
- By service, construction activities led with a 51.65% share of the Asia Pacific oil and gas CAPEX market size in 2025; decommissioning is projected to record the highest 7.58% CAGR through 2031.
- By geography, China held a commanding 56.15% share of the Asia Pacific oil and gas CAPEX market in 2025, whereas Malaysia is projected to present the fastest growth at a 5.28% CAGR by 2031.
Note: Market size and forecast figures in this report are generated using Mordor Intelligence’s proprietary estimation framework, updated with the latest available data and insights as of 2026.
Market Trends and Insights
Drivers Impact Analysis of Asia Pacific Oil and Gas CAPEX Market*
| Driver | (~) % Impact on CAGR Forecast | Geographic Relevance | Impact Timeline |
|---|---|---|---|
| Surging LNG infrastructure investments across Southeast Asia | +1.20% | Indonesia, Malaysia, Thailand, Vietnam | Medium term (2-4 years) |
| Government-led hydrogen & CCUS CAPEX commitments in Australia and Japan | +0.80% | Australia, Japan | Long term (≥ 4 years) |
| National-oil-company push for deep-water gas projects in China & Malaysia | +1.00% | China, Malaysia | Medium term (2-4 years) |
| IOCs reallocating portfolios toward low-cost APAC plays amid Middle-East risk | +0.60% | Regional, concentrated in Australia, Malaysia | Short term (≤ 2 years) |
| Rapid growth of digital-oilfield CAPEX for asset-life extension | +0.40% | China, Australia, Indonesia | Medium term (2-4 years) |
| Modular refinery projects targeting petrochemical-import substitution in India | +0.50% | India, with spillover to Bangladesh, Sri Lanka | Long term (≥ 4 years) |
| Source: Mordor Intelligence | |||
Surging LNG Infrastructure Investments Across Southeast Asia
Indonesian state major Pertamina earmarked USD 20 billion for LNG capacity additions running to 2028, while Petronas committed USD 15 billion to three floating LNG units that will lift Malaysia’s exportable gas by mid-decade. Storage, regasification, and shipping assets accompany these upstream builds, driving multi-year contracting opportunities for construction and engineering firms. The investment wave positions Southeast Asian exporters to capture 15–20% of global LNG trade by 2030, insulating them from oil-price volatility and boosting foreign-exchange inflows.(1) Domestic markets also shift away from pipeline gas in favor of flexible LNG imports that back-stop intermittent renewables. The momentum of these schemes directly feeds the Asia Pacific oil and gas CAPEX market, ensuring a sturdy demand floor across the medium term.
Government-Led Hydrogen & CCUS CAPEX Commitments in Australia and Japan
Japan’s Green Innovation Fund has earmarked JPY 2 trillion (USD 15 billion) for hydrogen value-chain projects, mirroring Australia’s AUD 70 billion (USD 47 billion) allocation aimed at production hubs, transport corridors, and geological storage.(2) The bilateral framework connects Australia’s resource endowment with Japanese offtake demand, ensuring bankable offtake against long-dated assets. Public capital absorbs early technology risk, catalyzing private participation and lowering the weighted-average cost of capital, which sustains the Asia Pacific oil and gas CAPEX market even as traditional hydrocarbons plateau. Long-term offtake agreements already under negotiation signal that project pipelines will lengthen well beyond the current forecast period.
National-Oil-Company Push for Deep-Water Gas Projects in China & Malaysia
CNOOC has set aside USD 15 billion for multiple deep-water developments through 2027, deploying next-generation subsea systems that reduce operating costs and minimize surface footprints. Petronas pursues comparable efforts in the South China Sea, adding floating production, storage, and offloading units that monetize fields previously inaccessible due to water depth and security concerns. These programs span 7–10 years, delivering dependable EPC backlogs that support the Asia Pacific oil and gas CAPEX market. Because deep-water gas displaces imported LNG, governments support approvals even amid maritime disputes, thereby locking in the positive demand impact for the medium term.
IOCs Reallocating Portfolios Toward Low-Cost APAC Plays Amid Middle-East Risk
Heightened geopolitical uncertainty in the Gulf has prompted Shell to commit USD 12 billion to Australian LNG trains and BP to partner with Indonesian NOCs on multi-field gas projects. The shift favors jurisdictions with transparent regulation, contractual sanctity, and ready export infrastructure. Short-cycle tie-backs further de-risk cash flow, meaning IOC capital turns faster, sustaining service-sector utilisation in the Asia Pacific oil and gas CAPEX market. Risk diversification remains the primary motivator, but carbon-intensity reduction also weighs in, making APAC’s relatively young asset base an attractive platform for digital optimization and methane-emission control programs.
Restraints Impact Analysis of Asia Pacific Oil and Gas CAPEX Market*
| Restraint | (~) % Impact on CAGR Forecast | Geographic Relevance | Impact Timeline |
|---|---|---|---|
| Tightened green-finance rules restricting fossil-fuel project lending | -0.80% | Global, particularly affecting Australia, Japan | Short term (≤ 2 years) |
| Rising EPC inflation & local-content mandates inflating build costs | -0.60% | Regional, concentrated in Indonesia, India, Malaysia | Medium term (2-4 years) |
| Accelerating EV uptake dampening long-term refined-products demand | -0.40% | China, India | Long term (≥ 4 years) |
| Maritime-security risks in the South China Sea delaying offshore FIDs | -0.30% | China, Malaysia, Vietnam | Short term (≤ 2 years) |
| Source: Mordor Intelligence | |||
Tightened Green-Finance Rules Restricting Fossil-Fuel Project Lending
Singapore’s Monetary Authority slashed fossil-fuel lending eligibility by 60% in 2024, and Australia’s banks followed suit, lifting borrowing costs for mid-scale upstream ventures by 200–300 basis points(3). Developers either pivot to export-credit agencies or raise mezzanine tranches, delaying final investment decisions and reducing near-term spending in the Asia Pacific oil and gas CAPEX market. Short-cycle projects with visible transition pathways still reach financial close, but high-carbon barrels bear clear funding penalties.
Rising EPC Inflation & Local-Content Mandates Inflating Build Costs
Indonesia imposes 40% local-content requirements on upstream projects, while Malaysia has similar thresholds, forcing international contractors to form JVs and nurture local supply chains that add 15–25% to total installed cost. Material and labor price spikes amplify the effect, squeezing internal rates of return and causing operators to stagger work scopes. Extended timelines reduce annual cash draws into the Asia Pacific oil and gas CAPEX market during the ramp-up window, though total lifetime spend eventually rebounds once procurement pipelines mature.
*Our forecasts treat driver/restraint impacts as directional, not additive. The impact forecasts reflect baseline growth, mix effects, and variable interactions.
Asia Pacific Oil and Gas CAPEX Market Segment Analysis
By Sector:
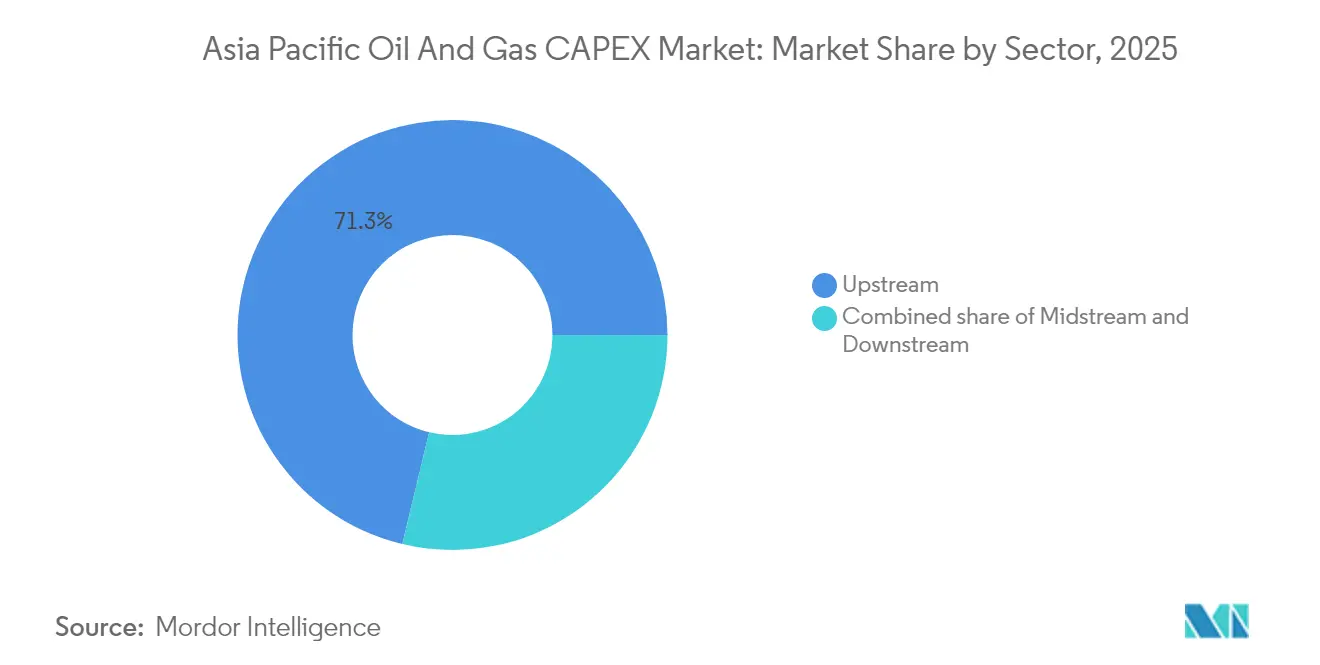
Upstream Dominance Sustains Energy Security EffortsUpstream commanded 71.25% of the Asia Pacific oil and gas CAPEX market in 2025, reflecting state directives to shore up indigenous supply amid volatile import prices. National oil companies led the way in spending on deep-water gas, shale blocks, and coal-bed methane, leveraging digital drilling and real-time reservoir imaging to boost recovery rates. These outlays keep local content factories busy and generate a continuous flow of contracts for service specialists. Midstream outlays center on brownfield pipeline looping and LNG storage, pairing with upstream developments to assure takeaway capacity.
Downstream expenditure, although comprising a smaller 28.75% share in 2025, is projected to accelerate at a 4.98% CAGR through 2031. Petrochemical integration drives revamp programs that swap simple fuels for higher-margin olefins and aromatics. India’s Jamnagar complex and China’s Fujian hub typify the shift: once gasoline-centric, the sites now channel incremental cash toward steam crackers and PDH units. Because each retrofit requires compressors, reactors, and automation, downstream continues to pull material volumes into the Asia Pacific oil and gas CAPEX market size tally, despite plateauing fuel demand.

By Location:
Offshore Growth Outpaces Onshore MaturityOnshore activities retained 65.25% of the Asia Pacific oil and gas CAPEX market size in 2025, anchored by Chinese shale, Australian coal-seam gas, and India’s Rajasthan tight-oil plays. Land projects enjoy quicker approvals and modest water-depth complexity, allowing NOCs to sanction multiple pads within a single budget cycle. Infrastructure such as trunk pipelines and gas-gathering networks gets bundled, locking in parallel opportunities for compressors and metering-skid providers.
Offshore CAPEX grows quicker at 6.84% CAGR, fueled by Malaysia’s deep-water gas surge, Indonesia’s floating LNG fleet, and Australia’s Browse and Scarborough fields. Next-generation FPSOs integrate CCS modules, meeting emissions regulations while unlocking marginal reservoirs. Specialist subsea contractors, therefore, gain share in the Asia Pacific oil and gas CAPEX market, while equipment OEMs secure frame agreements that stretch the backlog into the 2030s.
By Service:
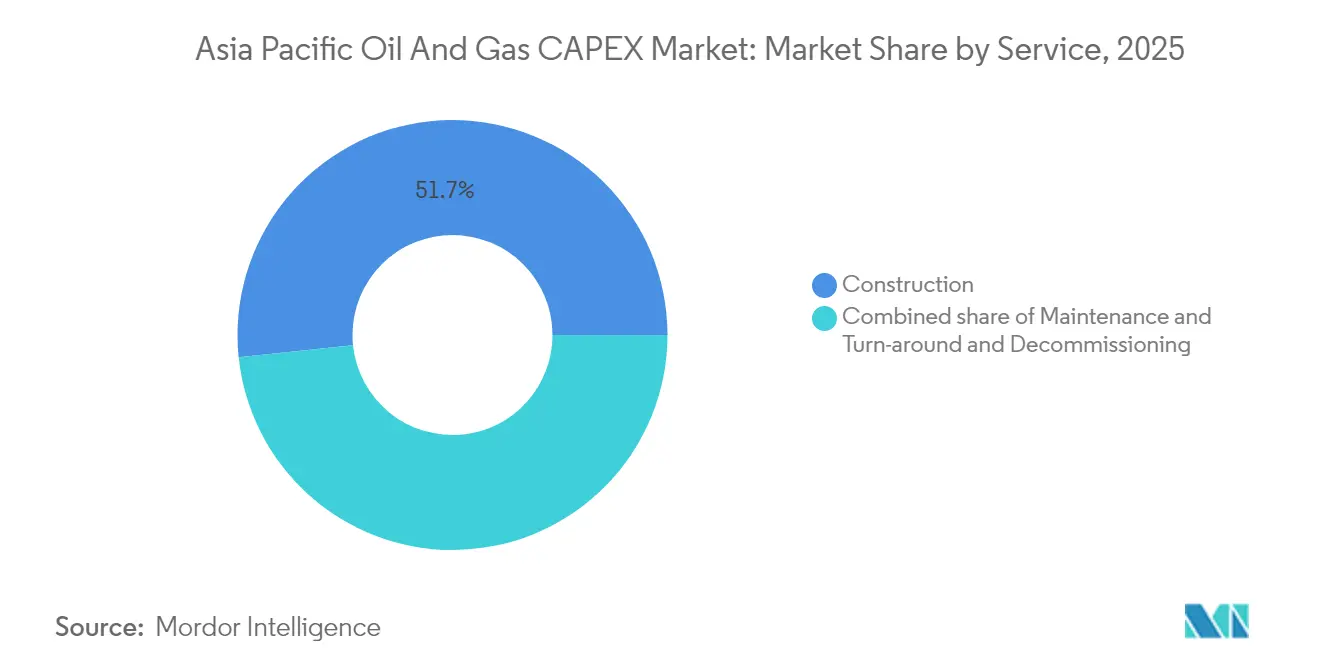
Construction Leads While Decommissioning Scales FastConstruction accounted for 51.65% of the 2025 spend as LNG trains, pipelines, and integrated refinery-petrochemical complexes broke ground across six major economies. EPC players coordinate massive workforces, heavy-lift assets, and advanced project controls to deliver under tight commissioning windows. Maintenance and turnaround posted steady, inflation-indexed growth, catering to maturing asset fleets in China and Australia.
Decommissioning remains a modest absolute slice but expands at an 7.58% CAGR, the fastest within services. Regulators now demand escrowed removal provisions and enforce strict post-plugging seabed clearance, compelling operators to award multi-year dismantling contracts. Skills developed in the North Sea migrate to the Asia Pacific, benefiting specialized contractors and keeping niche opportunities alive in the Asia Pacific oil and gas CAPEX market share for services.
Geography Analysis
China Oil and Gas CAPEX Market
China’s 56.15% stake in 2025 stems from upstream megaprojects such as Lingshui 17-2 and Shenhai-1, each exceeding USD 2 billion in development outlays. State agencies synchronize pipeline routes, port upgrades, and storage builds that compress execution timelines and heighten domestic multiplier effects. The strategy stabilizes regional supply chains and anchors equipment demand for the Asia Pacific oil and gas CAPEX market.
India Oil and Gas CAPEX Market
India’s push toward petrochemical self-sufficiency shapes its CAPEX profile. Modular refinery packages in Rajasthan and Gujarat require lower ticket sizes—USD 1–2 billion versus legacy megaprojects—yet the aggregate spend remains high because the model is repeated across several states. Gas grid expansion from Dahej southward underpins fertilizer and city-gas plans, extending midstream capex tails into the early 2030s.
Australia Oil and Gas CAPEX Market
Australia sits third in value terms but leads in technology. Brownfield LNG compression debottlenecks and CCS retrofits at Gorgon and Wheatstone keep service firms engaged, while the Pilbara hydrogen spine lines up USD 15 billion in electrolyzer, storage, and port infrastructure.Government grants lower first-mover risk, making Australia critical to future-fuel cost curves.
Malaysia Oil and Gas CAPEX Market
Malaysia’s 5.28% CAGR owes to Petronas’s three-string floating LNG roadmap plus Kasawari CCS, South East Asia’s largest carbon-capture facility under construction. Ancillary pipelines and shore-based enhancements magnify multiplier effects across Johor and Sarawak, pushing supplier-based localization above 50%.
APAC Oil and Gas CAPEX Market
Indonesia, Thailand, and Vietnam round out the core, each channeling niche CAPEX into domestic gas monetization and regas terminal additions. Bangladesh and the Philippines, grouped under Rest of Asia-Pacific, accelerate late in the period as improved sovereign credit ratings unlock concessional financing for import terminals and storage caverns.
Regulatory Landscape
Regulatory frameworks across Asia-Pacific continue to tighten around capital discipline, export proceeds management, and energy security, influencing both hydrocarbon and transition CAPEX. In Indonesia, Government Regulation No. 2 of 2026 and No. 21 of 2026 strengthened rules on retention of natural resource export proceeds (effective February 26, 2026 and June 1, 2026), while Government Regulation No. 24 of 2026 (effective June 1, 2026) governs exports of strategic natural resource commodities, adding compliance and treasury-planning complexity for LNG and upstream exporters.
In India, the Petroleum and Natural Gas Rules, 2025 (notified December 9, 2025) set frameworks for unitisation or merger leases and infrastructure sharing, reinforcing integrated development concepts that feed into field development plans and midstream tie-ins. In Vietnam, Decision No. 363/QĐ-BCT (February 28, 2026) revised the National Energy Master Plan and increased the strategic petroleum reserve requirement to 90 days of net imports by 2030, which supports storage and logistics investment while raising planning, permitting, and supply assurance requirements across downstream and midstream programs.
Competitive Landscape
National oil companies dominate spend due to sovereign mandates and ready access to state-backed finance. CNPC, CNOOC, and Sinopec collectively exceed USD 60 billion annual capex, dwarfing international rivals and cementing China’s equipment ecosystem. Petronas and ONGC follow, each leveraging integrated operations to expedite projects that align with national energy security agendas.
International majors adopt partnership models that blend technical edge with local market familiarity. Shell co-operates on FLNG, LNG bunkering, and hydrogen pilots with Petronas; TotalEnergies teams up on combined LNG and CCS developments, while BP piggybacks Indonesian NOC infrastructure to hedge geopolitical exposure. Carbon-management know-how and digital-optimization suites emerge as the main differentiators, granting international players continued relevance in the Asia Pacific oil and gas CAPEX market.
Service-sector competition intensifies as decommissioning and CCS niches open. Saipem, Subsea 7, and Technip Energies position themselves for turnkey scopes that incorporate well-plugging, topside removal, and carbon-storage site preparation. Domestic yards in China, Indonesia, and Malaysia claw share through favorable local-content policies, although complex subsea hardware still flows from Western OEMs, maintaining a balanced supplier field.
Asia Pacific Oil and Gas CAPEX Industry Leaders
-
Exxon Mobil Corporation.
-
Shell plc
-
Pacific Oil & Gas Ltd
-
Chevron Corporation
-
BP plc
- *Disclaimer: Major Players sorted in no particular order
Asia Pacific Oil and Gas CAPEX Market Companies Covered in this Report
- BP plc
- Exxon Mobil Corporation
- Shell plc
- Pacific Oil & Gas Ltd
- Chevron Corporation
- TotalEnergies SE
- Oil & Natural Gas Corporation (ONGC)
- China National Petroleum Corporation (CNPC)
- Cairn Oil & Gas (Vedanta Ltd)
- Equinor ASA
- Sinopec (CNPC)
- CNOOC Limited
- Petronas
- Woodside Energy Group Ltd
- Santos Ltd
- Inpex Corporation
- PTTEP
- Reliance Industries Ltd
- Adani Total Gas Ltd
- Saipem SpA
Market Opportunities and Future Outlook
Large, executable LNG and offshore gas programs across Southeast Asia are creating clearer contracting windows for EPC, subsea, and LNG supply-chain work, especially as projects move from planning into construction and early works. A concrete signal is Indonesia's Abadi Masela LNG project, where groundbreaking on July 16, 2026 (Inpex, Pertamina, and Petronas) marks entry into the construction phase for a US$21 billion development, supporting demand for fabrication, marine logistics, and long-lead equipment across the region. A further example is the July 20, 2026 launch of the Eni-Petronas Searah venture, which sets out a plan for about US$20 billion of investment over five years, reinforcing multi-asset upstream spending appetite and creating room for drilling, brownfield integration, and debottlenecking scopes connected to nearby infrastructure resources.
Carbon management integration continues to support CAPEX differentiation and funding access as operators add CCS components to project concepts. ExxonMobil engagements on CCS in Indonesia and Malaysia point to procurement opportunities around compression, dehydration, measurement, and subsurface services that sit alongside conventional upstream and LNG builds. At the same time, tighter green-finance conditions and ongoing cost inflation increase the value of modularization, digital monitoring, and shared infrastructure frameworks (including India's PNGR 2025 sharing provisions), which can reduce execution risk and shorten cycle times for both onshore and offshore developments.
Recent Industry Developments in Asia Pacific Oil and Gas CAPEX Market
- July 2026: Inpex commenced construction of the Abadi LNG project in Indonesia. The announcement expands upstream LNG capacity and reinforces regional gas supply security, contributing to capex momentum in APAC.
- May 2026: ExxonMobil signed a Heads of Agreement with Pertamina for a potential $2.6 billion CCS project offshore Sumatra and Java. The collaboration links carbon capture with new developments and highlights decarbonization oriented growth in APAC gas projects.
- May 2026: BP signed three new Production Sharing Contracts in Indonesia covering the Bintuni, Drawa, and Barong blocks. The contracts increase BP's exposure to Indonesian upstream output and lift the scale of regional capex activity.
Asia Pacific Oil and Gas CAPEX Market Report Scope and Research Methodology
Market Definition and Coverage
This market measures annual capital spending (CAPEX) across oil and gas projects in Asia-Pacific, covering spending tied to building, expanding, and sustaining assets across the value chain, reported in USD.
Scope exclusions: We exclude routine operating expenses, corporate overhead not linked to projects, and downstream retail activities that do not involve asset investment.
Segments Covered in This Report
- By Sector
- Upstream
- Midstream
- Downstream
- By Location
- Onshore
- Offshore
- By Service
- Construction
- Maintenance and Turn-around
- Decommissioning
- By Geography
- China
- India
- Australia
- Indonesia
- Malaysia
- Thailand
- Vietnam
- Rest of Asia-Pacific
Data Sources, Market Sizing, and Validation
Desk Research
We first built a country and sector view of oil and gas investment activity, so the model starts from what is observable in public energy statistics and project disclosures. Useful inputs were taken from sources such as IEA datasets, OPEC publications, government energy ministries and regulators in key APAC countries, national statistics offices, and customs trade statistics where relevant for equipment and materials.
To convert activity into spending, we also reviewed listed company annual reports, investor presentations, and major project announcements, which helped confirm budget cycles and the timing of final investment decisions. For cross checks, we used paid subscriptions for company financials and intelligence, and for shipment-level trade data where it helped validate procurement intensity for large build-outs. The sources listed here are illustrative only, and many additional public and paid references were used to collect, validate, and clarify data points during the work.
Primary Interviews and Surveys
Primary work was used to pressure-test the desk model on what is genuinely counted as CAPEX versus maintenance budgets, and on how offshore timelines were changing. We spoke with a mix of operators, EPC and service-side experts, and equipment-focused stakeholders across major APAC markets, so assumptions on cost inflation, project phasing, and sanctioning rates could be adjusted where needed.
Distribution of primary research fieldwork respondents
| Company type | Respondent position |
|---|---|
| Top tier: 26% | CXOs: 13% |
| Mid tier: 53% | Functional/Unit leaders: 30% |
| Smaller Players: 21% | Managers: 57% |
Market-Sizing & Forecasting
Sizing was anchored in a top-down rebuild of CAPEX pools by country and by value-chain area, where project pipelines and public investment signals were translated into annual spending by applying realistic phasing patterns. Those totals were then corroborated with selective bottom-up checks, such as sampled project budget roll ups, supplier and contractor channel checks, and spot validations of spending intensity for onshore versus offshore work.
Key inputs included upstream and LNG project sanctioning cadence, indicative EPC and service cost inflation, offshore drilling and development momentum, midstream pipeline and gas processing expansion plans, and refinery and petrochemical upgrade cycles that visibly affect downstream budgets. Where the desk record had gaps on timing or budget split, we used interview guidance to choose conservative phasing rather than forcing a complete project-by-project build.
For forecasting, we used scenario analysis supported by short series smoothing on country spend, which helped separate normal investment cycles from one-off mega-project spikes. The forward view was adjusted using interview consensus on expected approvals, cost normalization, and policy-led energy security pushes in key APAC markets.
Data Validation & Update Cycle
Outputs were checked against independent signals like aggregated company CAPEX guidance, visible project start-up schedules, and country-level investment commentary from official bodies, and then variances were investigated before final sign-off. When an outlier appeared, we traced the driver back to timing, currency translation, or overlap between project categories, and then corrected with a documented assumption.
A multi-step internal review was followed so calculation logic, unit conversions, and country allocations were consistent across the dataset. Reports are refreshed annually, and interim updates are made when material events shift spend patterns, such as delayed sanctions, large cost escalations, or policy changes that materially change investment plans. Before delivery, a final analyst pass is completed so clients receive the most current view available at that point.
Mordor Intelligence's Asia Pacific Oil and Gas Capex Market Size Versus Other Published Estimates
Published CAPEX market values for Asia-Pacific can differ even when the theme sounds similar, because not everyone counts the same kinds of spending, the same countries, or the same timing of project budgets. Differences also come from how firms treat offshore versus onshore intensity, and whether they use announced budgets or only sanctioned spending.
By tracking project sanctioning status, cost inflation resets, and currency timing checks, Mordor Intelligence keeps the APAC CAPEX total focused on spend that is tied to investable projects across upstream, midstream, and downstream, instead of mixing in broader operating budgets or narrow company-only panels.
Benchmark comparison
| Source | Market Size | Gaps in Research Methodology |
|---|---|---|
| Mordor Intelligence | USD 191.01 B (2025) | |
| Industry Newsletter A | USD 136.40 B (2024) | Uses a limited monitored-company panel and a single-year view, which can undercount countries or segments where spend is led by firms outside the tracked set, and it may exclude downstream and some midstream investment. |
| Consultancy Brief B | USD 209.16 B (2026) | Leans on forward-looking budgets with a longer horizon, which can overstate near-term spend if it assumes faster sanctions, smoother cost curves, or broader inclusion of adjacent energy and new-energy items within oil and gas CAPEX. |
The spread in values is largely explained by what is being counted as CAPEX and how project timing is treated, not by arithmetic alone. When country coverage, sector boundary, and the definition of qualifying investment are made explicit, the estimate becomes easier to trace back to repeatable steps and concrete inputs.
Key Questions Answered in the Report
How large is Asia Pacific oil and gas CAPEX spending in 2026?
The Asia Pacific oil and gas CAPEX market size stands at USD 199.21 billion in 2026, tracking the 4.29% CAGR projected for the remainder of the decade.
Which location segment is expected to grow the fastest?
Offshore developments show the highest growth, advancing at a 6.84% CAGR as deep-water gas and floating LNG projects proliferate.
Why is Malaysia considered a hotspot for new investment?
Petronas’s floating LNG program, deep-water gas fields, and CCS initiatives push Malaysia’s spending up at a 5.28% CAGR—the fastest rate in the region.
How do green-finance rules influence capital spending?
Tighter lending criteria lift borrowing costs by up to 300 basis points, delaying some mid-scale projects but accelerating low-carbon investments like hydrogen and CCS.
What opportunities exist for service companies?
Construction retains the largest wallet share, yet decommissioning and digital-oilfield upgrades grow quickest, offering specialist contractors high-margin niches.
Which technologies are most in demand?
Subsea production systems, floating LNG, carbon capture, and predictive analytics platforms dominate procurement pipelines across upcoming projects.