Asia-Pacific NMC Battery Pack Market Size and Share
Market Overview
| Study Period | 2017 - 2029 |
|---|---|
| Base Year For Estimation | 2024 |
| Forecast Data Period | 2025 - 2029 |
| Market Size (2025) | USD 17.85 Billion |
| Market Size (2029) | USD 25.97 Billion |
| Growth Rate (2025 - 2029) | 9.84% CAGR |
| Market Concentration | Low |
Major Players*Disclaimer: Major Players sorted in no particular order Image © Mordor Intelligence. Reuse requires attribution under CC BY 4.0. |
|

Asia-Pacific NMC Battery Pack Market Analysis by Mordor Intelligence
The Asia-Pacific NMC Battery Pack Market size is estimated at 17.85 billion USD in 2025, and is expected to reach 25.97 billion USD by 2029, growing at a CAGR of 9.84% during the forecast period (2025-2029).
The Asia-Pacific NMC battery pack industry is experiencing transformative growth driven by technological advancements and shifting consumer preferences. Battery technology has witnessed significant improvements in energy density and efficiency, with average lithium-ion battery pack prices declining approximately 80% to USD 220 per kWh, making electric vehicles increasingly cost-competitive. Major manufacturers are investing heavily in research and development to enhance battery performance, with companies like CATL leading innovations through products such as the Qilin Battery, which achieved mass production in March 2023 and offers improved energy density reaching 255 Wh/kg with NCM cells.
The market landscape is characterized by intense competition and strategic partnerships among key players. CATL has emerged as a dominant force, commanding over 35% market share in NMC battery pack production as of 2022, while BYD has secured a significant position with 20.93% of regional EV sales. These manufacturers are actively expanding their production capabilities and forming strategic alliances to strengthen their market presence. For instance, in December 2022, BASF initiated the supply of customized NCM cathode active materials to Prime Planet Energy & Solutions, a joint venture between Toyota and Panasonic, demonstrating the industry's collaborative approach to innovation.
The industry is witnessing a surge in product launches and technological innovations from both established players and new entrants. In February 2023, BYD unveiled its 2023 model Tang equipped with an NMC battery pack-powered plug-in hybrid system, showcasing the growing adoption of NCM technology in hybrid vehicles. Similarly, Skoda announced its entry into the Indian market in January 2023 with an electric SUV featuring an 82-kWh battery, highlighting the expanding market opportunities across different vehicle segments.
Manufacturing capabilities and supply chain optimization have become crucial factors in market competitiveness. Major manufacturers are establishing regional production facilities to ensure a stable supply and reduce costs. This trend is exemplified by Volkswagen India's announcement in April 2023 to electrify 30% of its vehicle lineup by 2030, including plans to assemble its first electric car, the ID.4, at its Aurangabad plant by 2024. The industry is also witnessing increased vertical integration, with companies investing in battery energy storage and recycling facilities to secure supply chains and maintain cost competitiveness. The focus on sustainable battery solutions is becoming increasingly important as manufacturers aim to reduce environmental impact.
Asia-Pacific NMC Battery Pack Market Trends and Insights
A VARIETY OF AUTOMAKERS ARE PRESENT IN THE MARKET, MAJORLY DRIVEN BY TOYOTA, TESLA, AND WULING
- The APAC electric vehicle market is bustling with numerous competitors, but its momentum is chiefly steered by five dominant corporations, collectively grasping over 50% of the 2022 market share. Leading the charge is BYD, securing a remarkable 20.93% of EV sales in the region. Its potent financial standing, coupled with its advanced R&D infrastructure, has positioned BYD as a powerhouse. The company's competitive pricing, coupled with its vast sales and after-sales network, effectively appeals to new consumers.
- Following BYD, the Toyota Group clinches the second spot, with about 12.88% of the market. Its well-established reputation across the APAC region, bolstered by its extensive sales and service framework, instills trust among consumers, further cementing its footprint. Tesla claims the third position, seizing 8.27% of the market. Renowned for its avant-garde, tech-driven offerings, Tesla enjoys a seamless supply chain across nations, notably China and Australia.
- Wuling comes in fourth, holding approximately 7.10% of the market. Operating under its parent company, Liuzhou Wuling Automobile Industry Co. Ltd, Wuling has carved a niche in countries like China and Indonesia, catering to a diverse clientele with its varied EV lineup. Rounding out the top five is Honda, with a 3.85% market share. Other notable contenders in the APAC EV market encompass brands like Nissan, Chery, Changan, and Neta, among others.

IN 2022, WULING, TESLA, AND BYD WERE THE BIGGEST BATTERY PACK DEMAND GENERATORS IN APAC
- The electric vehicle landscape, encompassing cars, buses, and trucks, has witnessed a notable upswing across various Asian countries in the past few years. While the appetite for electric vehicles fluctuates across regions and nations, it is evident that SUVs have carved a niche in major markets like China, India, and Japan. As a direct reflection of Asia's growing preference for SUVs over traditional sedans, due to their enhanced utility and spaciousness, electric SUVs have seen a parallel surge across the Asia-Pacific belt.
- Recent times have spotlighted a burgeoning affinity for compact SUVs among the Asian populace. Tesla's Model Y stands out with its all-electric drivetrain, sterling 5-star NCAP safety rating, seven-seat capacity, commendable range, and other features, making it a sought-after option in pivotal APAC markets, notably China. BYD's Song DM, with its competitive pricing and efficient fuel dynamics, has resonated well with customers across several Asian territories.
- The year 2022 saw Tesla's Model 3 clinching accolades as one of the top sellers in the Asian domain, a testament to its purely electric mechanism, paired with an array of attractive functionalities. The dynamic APAC EV arena also presents a myriad of electric SUV and sedan alternatives from established global manufacturers. The year 2022 anticipated robust sales for vehicles like Toyota's Yaris Cross and BYD's Dolphin. Other players, such as the Toyota Corolla and Wuling's Hongguang MINIEV, also form a robust lineup in the APAC EV ecosystem.

OTHER KEY INDUSTRY TRENDS COVERED IN THE REPORT
- GOVERNMENT INITIATIVES AND COMMERCIAL VEHICLE ELECTRIFICATION ARE RAPIDLY DRIVING THE DEMAND AND SALES OF EVS IN ASIA-PACIFIC
- THE DEMAND FOR EVS IN ASIA-PACIFIC IS FUELED BY FALLING BATTERY PRICES
- INCREASING GOVERNMENT SUPPORT FOR ELECTRIC VEHICLES IN ASIA-PACIFIC CAUSED PRICES TO DROP
- DEMAND FOR ELECTRIC VEHICLES DRIVES INTERNATIONAL AUTOMAKERS TO LAUNCH NEW PRODUCTS, EXPANDING THE ASIA-PACIFIC EV BATTERY PACK MARKET
- RISING POPULARITY OF LFP BATTERIES IN ASIAN COUNTRIES IS AIDING THE MARKET
- THE LFP BATTERIES SEGMENT HEADS THE ASIA-PACIFIC ELECTRIC VEHICLE BATTERY DEMAND
- RISING ELECTRIC VEHICLE DEMAND AND ADVANCEMENTS IN BATTERY TECHNOLOGY DRIVE GROWTH IN THE ASIA-PACIFIC REGION
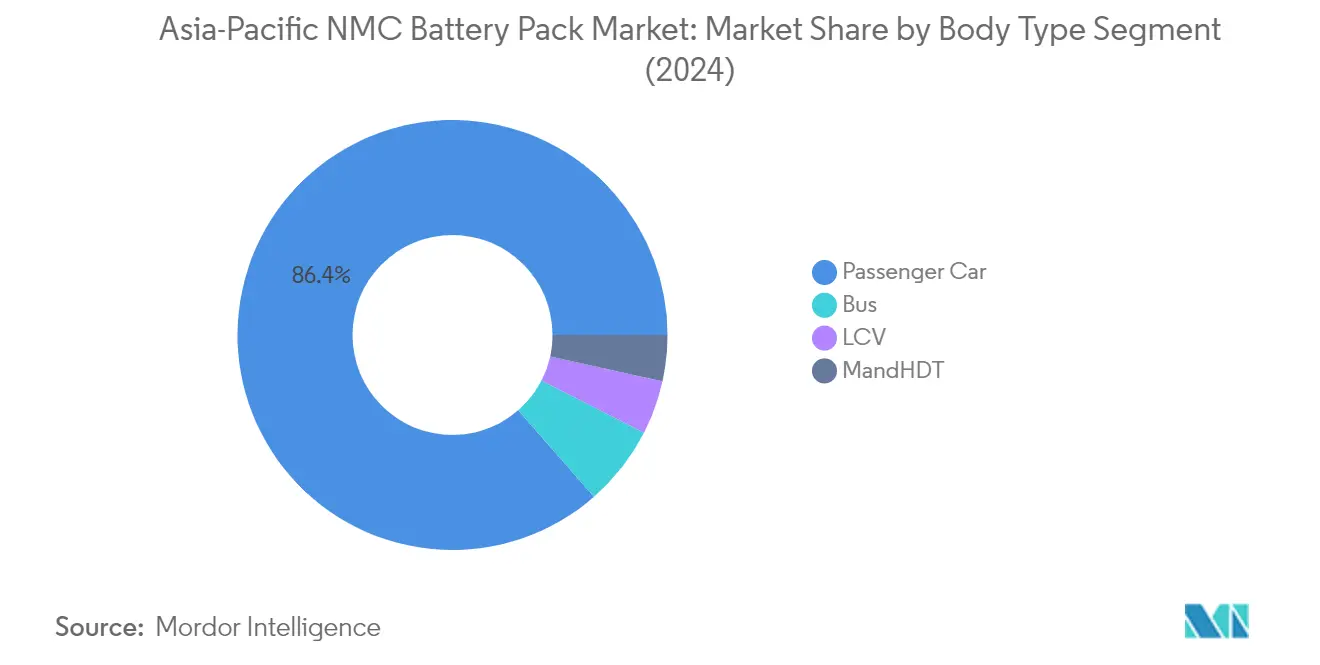
Segment Analysis: Body Type
Passenger Car Segment in Asia-Pacific NMC Battery Pack Market
The passenger car segment dominates the Asia-Pacific NMC battery pack market, commanding approximately 86% market share in 2024. This substantial market position is primarily driven by the increasing consumer preference for electric passenger vehicles across major markets like China, Japan, and South Korea. The segment's dominance is further reinforced by favorable government policies, including subsidies and tax incentives specifically targeted at electric passenger vehicles. Additionally, the growing availability of charging infrastructure in urban areas, coupled with advancements in NMC battery technology offering improved range and performance, has significantly boosted consumer confidence in electric passenger vehicles. The segment's strong performance is also attributed to major automotive manufacturers increasingly incorporating NMC battery packs in their electric passenger vehicle lineups, particularly in the mid to premium segments where consumers prioritize performance and range.
M&HDT Segment in Asia-Pacific NMC Battery Pack Market
The Medium and Heavy-Duty Truck (M&HDT) segment is emerging as the fastest-growing segment in the Asia-Pacific NMC battery pack market, projected to expand at approximately 53% CAGR from 2024 to 2029. This remarkable growth trajectory is driven by increasing environmental regulations targeting commercial vehicle emissions across major Asian economies. The segment is witnessing substantial investments in electric truck development from both traditional automotive manufacturers and new market entrants. The adoption of NMC battery packs in M&HDT applications is accelerating due to their superior energy density and fast-charging capabilities, which are crucial for commercial operations. Furthermore, the development of high-capacity charging infrastructure along major transportation corridors and logistics hubs is supporting this growth, making electric M&HDTs increasingly viable for long-haul operations.
Remaining Segments in Body Type
The Light Commercial Vehicle (LCV) and Bus segments represent significant opportunities in the Asia-Pacific NMC battery pack market, each serving distinct transportation needs. The LCV segment is gaining traction in urban delivery and small business applications, driven by the growing e-commerce sector and last-mile delivery requirements. The Bus segment, particularly in public transportation, is witnessing increased adoption of electric vehicles as cities across Asia-Pacific implement sustainable urban mobility solutions. Both segments benefit from government initiatives promoting clean transportation alternatives, with many cities implementing zero-emission zones and offering incentives for electric commercial vehicle adoption. The evolution of NMC battery technology, offering improved range and durability, is making these segments increasingly attractive for fleet operators and public transportation authorities.
Segment Analysis: Propulsion Type
BEV Segment in Asia-Pacific NMC Battery Pack Market
The Battery Electric Vehicles (BEV) segment dominates the Asia-Pacific NMC battery pack market, commanding approximately 90% market share in 2024. This overwhelming dominance can be attributed to several factors, including the increasing consumer preference for zero-emission vehicles, supportive government policies, and technological advancements in battery technology. The segment's growth is particularly strong in major markets like China, Japan, and South Korea, where robust charging infrastructure and favorable incentives have accelerated BEV adoption. Major automotive manufacturers across the region are expanding their BEV portfolios, driving the demand for NMC battery packs. Additionally, the segment is expected to maintain its market leadership position with the highest growth rate of around 19% during 2024-2029, driven by increasing environmental consciousness, declining battery costs, and improving vehicle range capabilities.
PHEV Segment in Asia-Pacific NMC Battery Pack Market
The Plug-in Hybrid Electric Vehicle (PHEV) segment represents a strategic bridge between conventional vehicles and fully electric vehicles in the Asia-Pacific NMC battery pack market. This segment has carved out its niche by offering consumers the flexibility of both electric and conventional powertrains, making it particularly attractive in regions where charging infrastructure is still developing. The segment's growth is supported by automotive manufacturers who are introducing new PHEV models across various vehicle categories, from compact cars to SUVs. Several countries in the region have included PHEVs in their electric vehicle incentive programs, recognizing their role in the broader electrification strategy. The segment's development is also driven by advancements in battery technology that enable longer electric-only driving ranges and improved overall efficiency.
Segment Analysis: Capacity
15-40 kWh Segment in Asia-Pacific NMC Battery Pack Market
The 15-40 kWh segment dominates the Asia-Pacific NMC battery pack market, commanding approximately 82% market share in 2024. This segment's prominence can be attributed to its widespread adoption in affordable electric passenger vehicles, which constitute the majority of EV sales in the region. The segment's success is driven by several factors, including optimal range capabilities for urban mobility, cost-effectiveness for mass-market adoption, and alignment with government subsidy programs in various Asian countries. Major automotive manufacturers are increasingly focusing on this capacity range for their entry and mid-level electric vehicle models, recognizing it as the sweet spot between performance and affordability. The segment's strong performance is further supported by advancements in lithium ion battery pack technology that have improved energy density and efficiency within this capacity range, making it increasingly attractive for both consumers and manufacturers.
40-80 kWh Segment in Asia-Pacific NMC Battery Pack Market
The 40-80 kWh segment is emerging as the fastest-growing segment in the Asia-Pacific NMC battery pack market, projected to grow at approximately 63% CAGR from 2024 to 2029. This remarkable growth trajectory is driven by increasing consumer demand for electric vehicles with extended range capabilities and enhanced performance characteristics. The segment is benefiting from technological advancements in battery chemistry and manufacturing processes, which are making these higher-capacity batteries more cost-effective and efficient. Automotive manufacturers are increasingly incorporating this capacity range in their premium and long-range electric vehicle models, particularly in markets where charging infrastructure is well-developed. The segment's growth is further supported by declining battery costs, improving energy density, and increasing consumer preference for vehicles that can handle both urban commuting and longer intercity travel.
Remaining Segments in Capacity Segmentation
The remaining segments in the Asia-Pacific NMC battery pack market include the above 80 kWh and less than 15 kWh categories, each serving distinct market needs. The above 80 kWh segment caters to the premium electric vehicle segment and heavy-duty commercial vehicles, where extended range and high performance are crucial requirements. This segment is particularly relevant for luxury EVs and long-haul commercial applications. On the other hand, the less than 15 kWh segment serves the growing market for urban mobility solutions, including small electric vehicles and hybrid applications. These segments, while smaller in market share, play vital roles in completing the market ecosystem and meeting diverse consumer needs across different vehicle categories and use cases.
Segment Analysis: Method
Laser Method Segment in Asia-Pacific NMC Battery Pack Market
The laser method has emerged as the dominant segment in the Asia-Pacific NMC battery pack market, commanding approximately 52% of the total market share in 2024. This method has gained significant traction due to its superior connection quality and ability to handle high-current NMC batteries, particularly in larger vehicles like buses and commercial trucks. The segment is also experiencing remarkable growth, projected to expand at around 28% annually from 2024 to 2029. The increasing adoption of laser welding can be attributed to its numerous advantages, including precise control over weld parameters, enhanced joint strength, improved thermal management, and the ability to provide robust, high-quality connections. The technology's capability to ensure consistent and reliable connections, coupled with its suitability for high-power applications, has made it the preferred choice among manufacturers in the region. The growing emphasis on improved performance, safety, and durability of battery packs continues to drive the adoption of laser welding methods in the Asia-Pacific NMC battery pack market.
Wire Method Segment in Asia-Pacific NMC Battery Pack Market
The wire method represents a significant portion of the Asia-Pacific NMC battery pack market, offering distinct advantages such as low manufacturing costs, reliable connections, and adaptability for various wire types. This traditional method continues to maintain its relevance due to its cost-effectiveness and proven track record in battery pack manufacturing. The wire bonding technique has demonstrated particular strength in low to medium power applications, where its reliability and efficiency make it an attractive choice for manufacturers. The method's ability to provide dependable connections while maintaining cost competitiveness has ensured its continued presence in the market. Leading manufacturers are actively investing in innovative technologies and research and development activities to enhance the performance and safety aspects of wire-connected battery packs. The wire method's versatility and established presence in the manufacturing ecosystem continue to make it a viable solution for meeting the growing demand for electric mobility in the Asia-Pacific region.
Segment Analysis: Component
Cathode Segment in Asia-Pacific NMC Battery Pack Market
The cathode segment dominates the Asia-Pacific NMC battery pack component market, commanding approximately 69% of the total market value in 2024. This significant market share can be attributed to cathodes being one of the costliest battery materials used in NMC batteries, making up more than 50% of all NMC battery cell components. The segment's dominance is further strengthened by the critical role cathodes play in determining battery density, power rating, and other key characteristics of NMC batteries. Major manufacturers across the APAC region have expanded their usage of cathodes in response to growing consumer demands for enhanced battery performance. Leading cathode suppliers in the region, including POSCO, Mitsubishi Chemical Holdings, and Umicore, have established robust supply chains to meet the increasing demand from electric vehicle manufacturers.
Separator Segment in Asia-Pacific NMC Battery Pack Market
The separator segment is projected to exhibit the strongest growth trajectory in the Asia-Pacific NMC battery pack component market from 2024 to 2029, with an expected growth rate of approximately 9%. This robust growth is driven by the increasing sophistication of separator technologies and their crucial role in ensuring battery safety and performance. Major separator manufacturers in Asia, including Asahi Kasei Corp., Toray Industries Inc., and SK Innovation Co. Ltd, are expanding their production capabilities to meet the rising demand. The segment's growth is further supported by ongoing technological advancements in separator materials, including enhanced thermal stability features and improved ion conductivity properties. The development of thinner yet more durable separator materials is also contributing to better overall battery performance and safety standards.
Remaining Segments in Component Market
The anode and electrolyte segments also play vital roles in the Asia-Pacific NMC battery pack market. The anode segment, primarily utilizing graphite-based materials, contributes significantly to battery longevity and charging capabilities. Manufacturers are increasingly focusing on developing silicon-based anodes to enhance energy density and performance. The electrolyte segment, while representing a smaller portion of the overall component cost, remains crucial for ion transport and overall battery functionality. Both segments are witnessing continuous innovation in materials and manufacturing processes, with manufacturers focusing on improving conductivity, stability, and safety features. The development of new electrolyte formulations and advanced anode materials continues to drive improvements in battery performance across the region.
Segment Analysis: Material Type
Other Materials Segment in Asia-Pacific NMC Battery Pack Market
Other materials constitute the largest segment in the Asia-Pacific NMC battery pack market, driven by the increasing demand for various complementary materials essential for battery manufacturing. These materials play a crucial role in enhancing battery performance, durability, and safety features. The segment's dominance is reflected in its substantial volume of approximately 282,476 thousand kg in 2024, accounting for nearly 65% of the total material consumption in NMC battery pack production. The segment's robust performance is supported by continuous technological advancements in battery material engineering and the growing emphasis on developing more efficient and sustainable battery components. Major manufacturers are investing heavily in research and development to optimize these materials' properties, leading to improved battery performance and reduced production costs. The segment's growth is further bolstered by the expanding electric vehicle market in key Asian countries and the increasing focus on energy storage solutions.
Cobalt Segment in Asia-Pacific NMC Battery Pack Market
The cobalt segment is experiencing remarkable growth in the Asia-Pacific NMC battery pack market, demonstrating exceptional potential for expansion. The segment is projected to grow at an impressive rate of approximately 63% from 2024 to 2029, making it the fastest-growing material segment in the market. This substantial growth is attributed to cobalt's critical role in enhancing battery stability and performance characteristics. The increasing adoption of high-performance NMC batteries in premium electric vehicles and advanced energy storage systems is driving the demand for cobalt. Manufacturers are developing innovative cobalt-based formulations to optimize battery efficiency and longevity. The segment's growth is further supported by strategic investments in cobalt processing capabilities and supply chain optimization across the Asia-Pacific region. Additionally, technological advancements in cobalt processing and recycling are expected to contribute to the segment's sustained growth trajectory.
Remaining Segments in Material Type
The other significant segments in the material type category include lithium, manganese, natural graphite, and nickel, each playing distinct and vital roles in NMC battery production. Lithium serves as the fundamental component for ion transfer, while manganese contributes to structural stability and thermal performance. Natural graphite is essential for anode construction, offering excellent conductivity and longevity. Nickel is crucial for increasing energy density and improving overall battery performance. These materials collectively contribute to the advancement of NMC battery technology, with manufacturers continuously optimizing their proportions to achieve the ideal balance of performance, cost, and sustainability. The development of new material processing techniques and the implementation of advanced manufacturing processes are enhancing the efficiency and effectiveness of these materials in battery production.
Asia-Pacific NMC Battery Pack Market Geography Segment Analysis
Asia-Pacific NMC Battery Pack Market in China
China dominates the Asia-Pacific NMC battery pack market, commanding approximately 90% of the total market share in 2024. The country's supremacy in the market stems from its robust domestic manufacturing ecosystem and comprehensive supply chain integration. China's market leadership is reinforced by the presence of major battery manufacturers like CATL and BYD, who have established extensive production facilities across the country. The government's unwavering support through subsidies and favorable policies has created a conducive environment for market growth. The country's advanced research and development capabilities in battery technology have enabled continuous innovations in NMC battery pack design and efficiency. Furthermore, China's strong automotive industry and growing electric vehicle adoption have created a sustained demand for NMC battery packs. The presence of a well-developed charging infrastructure network has also contributed to increased consumer confidence in electric vehicles, thereby driving the demand for NMC battery packs.
Asia-Pacific NMC Battery Pack Market in Rest of Asia-Pacific
The Rest of Asia-Pacific region, encompassing countries like Vietnam, the Philippines, and Singapore, is emerging as the fastest-growing market for NMC battery packs, projected to grow at approximately 133% CAGR from 2024 to 2029. This remarkable growth trajectory is driven by increasing environmental awareness and supportive government initiatives promoting electric vehicle adoption. The region is witnessing substantial investments in battery manufacturing facilities and charging infrastructure development. Local automotive manufacturers are increasingly partnering with international battery suppliers to secure stable supply chains. The growing middle-class population and increasing disposable income levels are driving the demand for electric vehicles, consequently boosting the NMC battery pack market. These countries are also developing their technological capabilities and expertise in battery manufacturing through knowledge transfer and international collaborations. The region's strategic location and improving logistics infrastructure make it an attractive manufacturing hub for battery producers.
Asia-Pacific NMC Battery Pack Market in Japan
Japan maintains a strong position in the Asia-Pacific NMC battery pack market, leveraging its advanced technological capabilities and robust automotive industry. The country's market is characterized by high-quality standards and innovative battery solutions developed through extensive research and development activities. Japanese manufacturers have established strong partnerships with global automotive companies, ensuring a stable demand for their NMC battery packs. The country's focus on sustainability and environmental protection has created a favorable environment for electric vehicle adoption. Japan's well-established industrial infrastructure and skilled workforce contribute to efficient battery production and quality control. The presence of major battery manufacturers and automotive companies has created a competitive ecosystem driving continuous innovation. Additionally, Japan's strong intellectual property protection framework has encouraged companies to invest in advanced battery technologies.
Asia-Pacific NMC Battery Pack Market in India
India's NMC battery pack market is experiencing significant transformation driven by the country's ambitious electric vehicle adoption goals and supportive policy framework. The government's push for domestic battery manufacturing through various initiatives has attracted substantial investments in the sector. The country's large automotive market and growing environmental consciousness among consumers are creating favorable conditions for market expansion. Local manufacturers are increasingly focusing on developing cost-effective battery solutions suited to Indian conditions. The establishment of battery testing and validation facilities is enhancing the quality and reliability of domestically produced NMC battery packs. India's strong IT capabilities are enabling the development of advanced battery management systems. The country's growing charging infrastructure network is addressing range anxiety concerns and boosting consumer confidence in electric vehicles.
Asia-Pacific NMC Battery Pack Market in Other Countries
The remaining countries in the Asia-Pacific region, including South Korea and Thailand, are demonstrating varying levels of market development in the NMC battery pack sector. These markets are characterized by distinct regulatory frameworks and adoption patterns influenced by local economic conditions and environmental policies. The automotive sectors in these countries are gradually transitioning towards electrification, creating opportunities for NMC battery pack manufacturers. Local governments are implementing various initiatives to promote domestic battery production and reduce dependence on imports. The presence of established automotive manufacturing facilities in these countries provides a foundation for market growth. These markets are also benefiting from technology transfer through international partnerships and collaborations. The development of supporting infrastructure and increasing consumer awareness about electric vehicles are creating favorable conditions for market expansion in these countries.
Competitive Landscape
Top Companies in Asia-Pacific NMC Battery Pack Market
The Asia-Pacific NMC battery pack market is led by prominent players including BYD Company Ltd., Tesla Inc., SK Innovation, LG Energy Solution, and Samsung SDI. These companies are actively pursuing technological advancements in battery chemistry and manufacturing processes to enhance energy density and performance. Strategic collaborations with automotive manufacturers and investments in research and development facilities across the region demonstrate their commitment to innovation. Companies are expanding their production capacities through new manufacturing facilities and joint ventures, particularly in China, South Korea, and Japan. The focus remains on developing advanced battery management systems, improving safety features, and reducing production costs through economies of scale. Additionally, these market leaders are investing in sustainable practices and recycling initiatives to address environmental concerns and maintain a competitive advantage.
Market Dominated by Asian Manufacturing Giants
The competitive landscape is characterized by a mix of established conglomerates and specialized battery manufacturers, with Asian companies holding significant market share. Chinese manufacturers, particularly BYD and CATL, have established a strong domestic presence while expanding their international footprint through partnerships with global automotive manufacturers. Japanese and South Korean players like LG Energy Solution, Samsung SDI, and Panasonic leverage their technological expertise and established relationships with automotive manufacturers to maintain their market positions. The market shows moderate consolidation with larger players acquiring smaller technology companies and forming strategic alliances to enhance their technological capabilities and market reach.
The market exhibits a dynamic environment where local players compete effectively with global corporations, particularly in their domestic markets. Companies are increasingly focusing on vertical integration, controlling everything from raw material procurement to final lithium-ion battery pack assembly. The industry has witnessed several strategic partnerships and joint ventures between battery manufacturers and automotive companies, aimed at securing supply chains and developing customized solutions. These collaborations have resulted in significant knowledge transfer and technological advancement, further intensifying competition in the market.
Innovation and Sustainability Drive Future Success
Success in the market increasingly depends on companies' ability to develop innovative battery technologies while maintaining cost competitiveness. Incumbent players are focusing on expanding their production capabilities, investing in advanced manufacturing processes, and strengthening their supply chain relationships. Companies are also emphasizing the development of more efficient NMC battery pack chemistries and improved energy density to meet the growing demands of electric vehicle manufacturers. The ability to secure stable raw material supply chains and implement effective recycling programs has become crucial for maintaining market position.
For new entrants and smaller players, success lies in identifying and serving specific market niches or geographical regions where they can establish a strong presence. Companies need to focus on developing specialized solutions for specific applications or customer segments while building strategic partnerships with established players. The regulatory environment, particularly regarding safety standards and environmental regulations, continues to shape market dynamics and investment decisions. Companies that can effectively navigate these requirements while maintaining operational efficiency and product quality will be better positioned for future growth. The increasing focus on sustainable practices and circular economy principles is expected to influence competitive strategies and market positioning. The development of sustainable battery solutions and green battery technologies is becoming increasingly important for companies aiming to lead in this evolving industry.
Asia-Pacific NMC Battery Pack Industry Leaders
-
BYD Company Ltd.
-
Contemporary Amperex Technology Co. Ltd. (CATL)
-
LG Energy Solution Ltd.
-
SK Innovation Co. Ltd.
-
Tesla Inc.
- *Disclaimer: Major Players sorted in no particular order

Asia-Pacific NMC Battery Pack Market Report Scope
Bus, LCV, M&HDT, Passenger Car are covered as segments by Body Type. BEV, PHEV are covered as segments by Propulsion Type. 15 kWh to 40 kWh, 40 kWh to 80 kWh, Above 80 kWh, Less than 15 kWh are covered as segments by Capacity. Cylindrical, Pouch, Prismatic are covered as segments by Battery Form. Laser, Wire are covered as segments by Method. Anode, Cathode, Electrolyte, Separator are covered as segments by Component. Cobalt, Lithium, Manganese, Natural Graphite, Nickel are covered as segments by Material Type. China, India, Japan, South Korea, Thailand, Rest-of-Asia-Pacific are covered as segments by Country.| Bus |
| LCV |
| M&HDT |
| Passenger Car |
| BEV |
| PHEV |
| 15 kWh to 40 kWh |
| 40 kWh to 80 kWh |
| Above 80 kWh |
| Less than 15 kWh |
| Cylindrical |
| Pouch |
| Prismatic |
| Laser |
| Wire |
| Anode |
| Cathode |
| Electrolyte |
| Separator |
| Cobalt |
| Lithium |
| Manganese |
| Natural Graphite |
| Nickel |
| Other Materials |
| China |
| India |
| Japan |
| South Korea |
| Thailand |
| Rest-of-Asia-Pacific |
| Body Type | Bus |
| LCV | |
| M&HDT | |
| Passenger Car | |
| Propulsion Type | BEV |
| PHEV | |
| Capacity | 15 kWh to 40 kWh |
| 40 kWh to 80 kWh | |
| Above 80 kWh | |
| Less than 15 kWh | |
| Battery Form | Cylindrical |
| Pouch | |
| Prismatic | |
| Method | Laser |
| Wire | |
| Component | Anode |
| Cathode | |
| Electrolyte | |
| Separator | |
| Material Type | Cobalt |
| Lithium | |
| Manganese | |
| Natural Graphite | |
| Nickel | |
| Other Materials | |
| Country | China |
| India | |
| Japan | |
| South Korea | |
| Thailand | |
| Rest-of-Asia-Pacific |
Market Definition
- Battery Chemistry - NCM battery type is considred under the scope of battery chemistry.
- Battery Form - The types of battery forms offered under this segment include Cylindrical, Pouch and Prismatic.
- Body Type - Body types considered under this segment include, passenger cars, LCV (light commercial vehicle), M&HDT (medium & heavy duty trucks)and buses.
- Capacity - Various types of battery capacities inldude under theis segment are 15 kWH to 40 kWH, 40 kWh to 80 kWh, Above 80 kWh and Less than 15 kWh.
- Component - Various components covered under this segment include anode, cathode, electrolyte, separator.
- Material Type - Various material covered under this segment include cobalt, lithium, manganese, natural graphite, nickel, other material.
- Method - The types of method covered under this segment include laser and wire.
- Propulsion Type - Propulsion types considered under this segment include BEV (Battery electric vehicles), PHEV (plug-in hybrid electric vehicle).
- ToC Type - ToC 4
- Vehicle Type - Vehicle type considered under this segment include passenger vehicles, and commercial vehicles with various EV powertrains.
| Keyword | Definition |
|---|---|
| Electric vehicle (EV) | A vehicle which uses one or more electric motors for propulsion. Includes cars, buses, and trucks. This term includes all-electric vehicles or battery electric vehicles and plug-in hybrid electric vehicles. |
| PEV | A plug-in electric vehicle is an electric vehicle that can be externally charged and generally includes all electric vehicles as well as plug-electric vehicles as well as plug-in hybrids. |
| Battery-as-a-Service | A business model in which the battery of an EV can be rented from a service provider or swapped with another battery when it runs out of charge |
| Battery Cell | The basic unit of an electric vehicle's battery pack, typically a lithium-ion cell, that stores electrical energy. |
| Module | A subsection of an EV battery pack, consisting of several cells grouped together, often used to facilitate manufacturing and maintenance. |
| Battery Management System (BMS) | An electronic system that manages a rechargeable battery by protecting the battery from operating outside its safe operating area, monitoring its state, calculating secondary data, reporting data, controlling its environment, and balancing it. |
| Energy Density | A measure of how much energy a battery cell can store in a given volume, usually expressed in watt-hours per liter (Wh/L). |
| Power Density | The rate at which energy can be delivered by the battery, often measured in watts per kilogram (W/kg). |
| Cycle Life | The number of complete charge-discharge cycles a battery can perform before its capacity falls under a specified percentage of its original capacity. |
| State of Charge (SOC) | A measurement, expressed as a percentage, that represents the current level of charge in a battery compared to its capacity. |
| State of Health (SOH) | An indicator of the overall condition of a battery, reflecting its current performance compared to when it was new. |
| Thermal Management System | A system designed to maintain optimal operating temperatures for an EV's battery pack, often using cooling or heating methods. |
| Fast Charging | A method of charging an EV battery at a much faster rate than standard charging, typically requiring specialized charging equipment. |
| Regenerative Braking | A system in electric and hybrid vehicles that recovers energy normally lost during braking and stores it in the battery. |
Research Methodology
Mordor Intelligence follows a four-step methodology in all its reports.
- Step-1: Identify Key Variables: To build a robust forecasting methodology, the variables and factors identified in Step-1 are tested against available historical market numbers. Through an iterative process, the variables required for market forecast are set and the model is built based on these variables.
- Step-2: Build a Market Model: Market-size estimations for the historical and forecast years have been provided in revenue and volume terms. Market revenue is calculated by multiplying the volume demand with volume-weighted average battery pack price (per kWh). Battery pack price estimation and forecast takes into account various factors affecting ASP, such as inflation rates, market demand shifts, production costs, technological developments, and consumer preferences, providing estimations for both historical data and future trends.
- Step-3: Validate and Finalize: In this important step, all market numbers, variables, and analyst calls are validated through an extensive network of primary research experts from the market studied. The respondents are selected across levels and functions to generate a holistic picture of the market studied.
- Step-4: Research Outputs: Syndicated Reports, Custom Consulting Assignments, Databases & Subscription Platforms


