
Market Overview
| Study Period | 2020 - 2031 |
|---|---|
| Forecast Data Period | 2026 - 2031 |
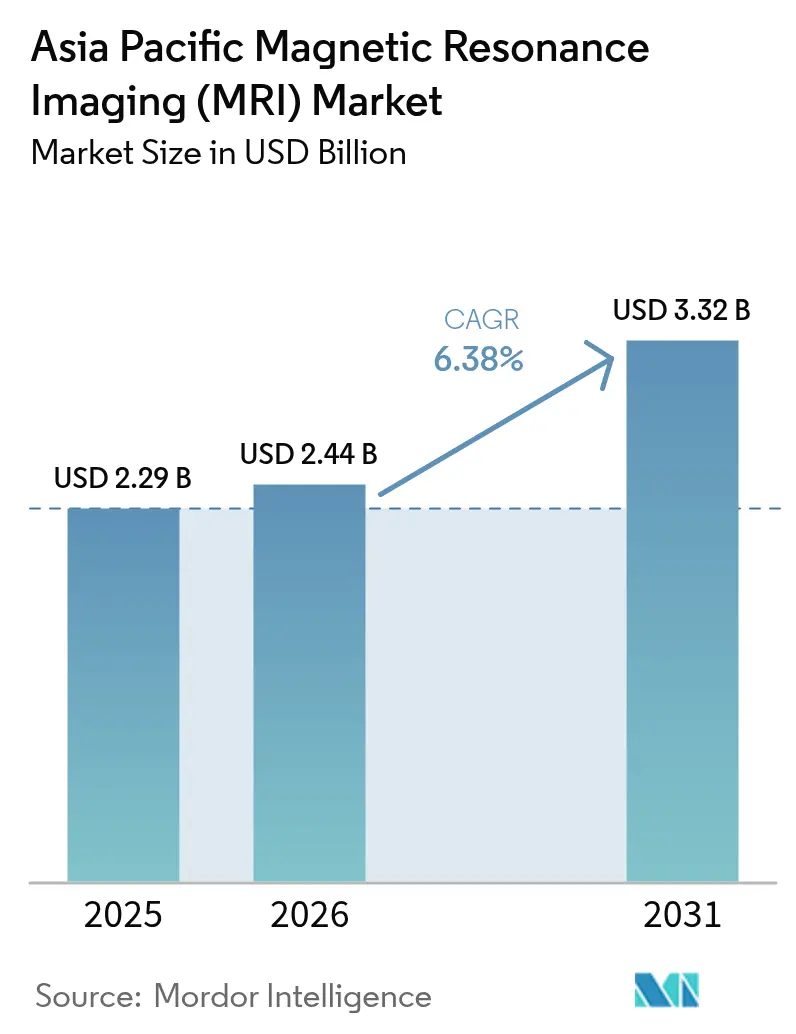
| Base Year Market Size (2025) | USD 2.29 Billion |
| Market Size (2026) | USD 2.44 Billion |
| Market Size (2031) | USD 3.32 Billion |
| Growth Rate (2026 - 2031) | 6.38 % |
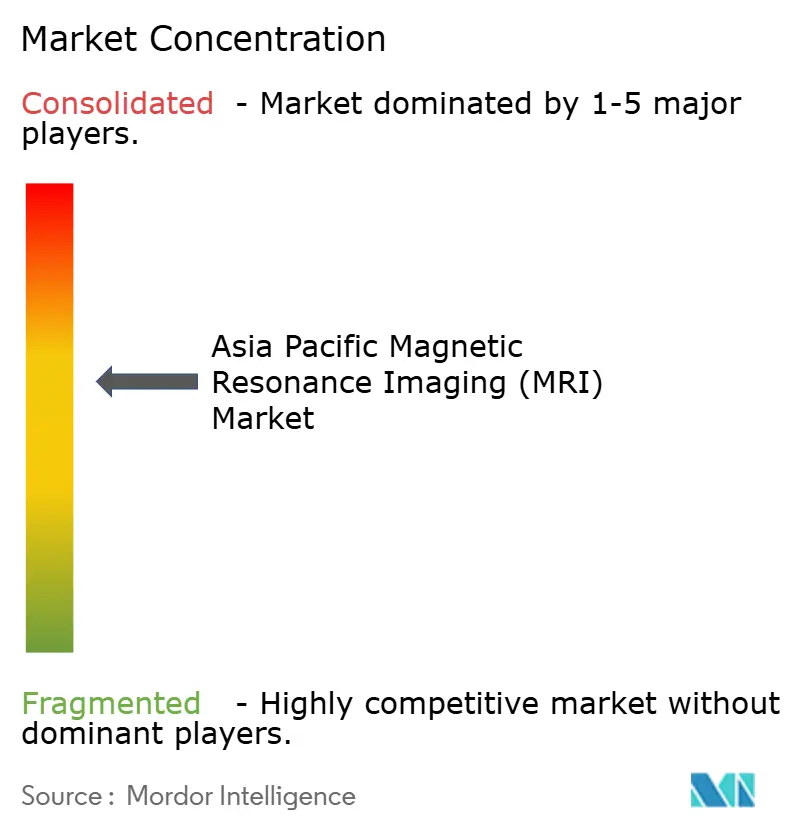
| Market Concentration | Medium |
Major Players *Disclaimer: Major Players sorted in no particular order Image © Mordor Intelligence. Reuse requires attribution under CC BY 4.0. | |
Asia Pacific Magnetic Resonance Imaging (MRI) Market Analysis by Mordor Intelligence
The Asia Pacific magnetic resonance imaging market size is expected to grow from USD 2.29 billion in 2025 to USD 2.44 billion in 2026 and is forecast to reach USD 3.32 billion by 2031 at 6.38% CAGR over 2026-2031. Continuous expansion of universal health-coverage programs, the rising incidence of chronic diseases, and breakthroughs in low-field magnet technology underpin this trajectory. Increasing hospital budgets for diagnostic imaging across China, India, and Southeast Asia align with new reimbursement codes for cardiac and neurological MRI, accelerating system installations. At the same time, AI-enabled reconstruction software is shortening scan times and lifting scanner utilization rates, improving provider economics. Regional manufacturers enjoy policy incentives that promote domestic assembly of helium-light or helium-free systems, further reshaping competitive dynamics. Collectively, these forces sustain a balanced growth environment where advanced 3 T scanners and portable low-field units coexist to serve diverse clinical settings across the Asia Pacific magnetic resonance imaging market.
Key Report Takeaways
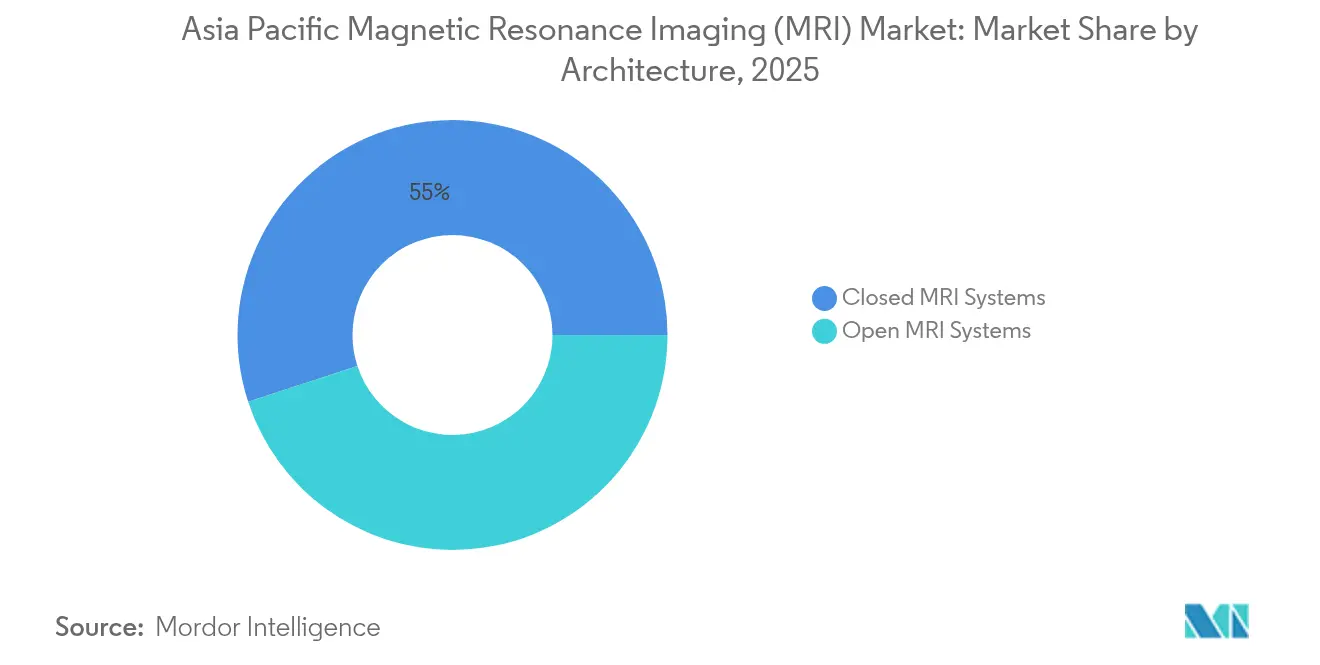
- By architecture, closed systems commanded 55.02% of the Asia Pacific magnetic resonance imaging market size in 2025, whereas open systems are advancing at an 8.27% CAGR.
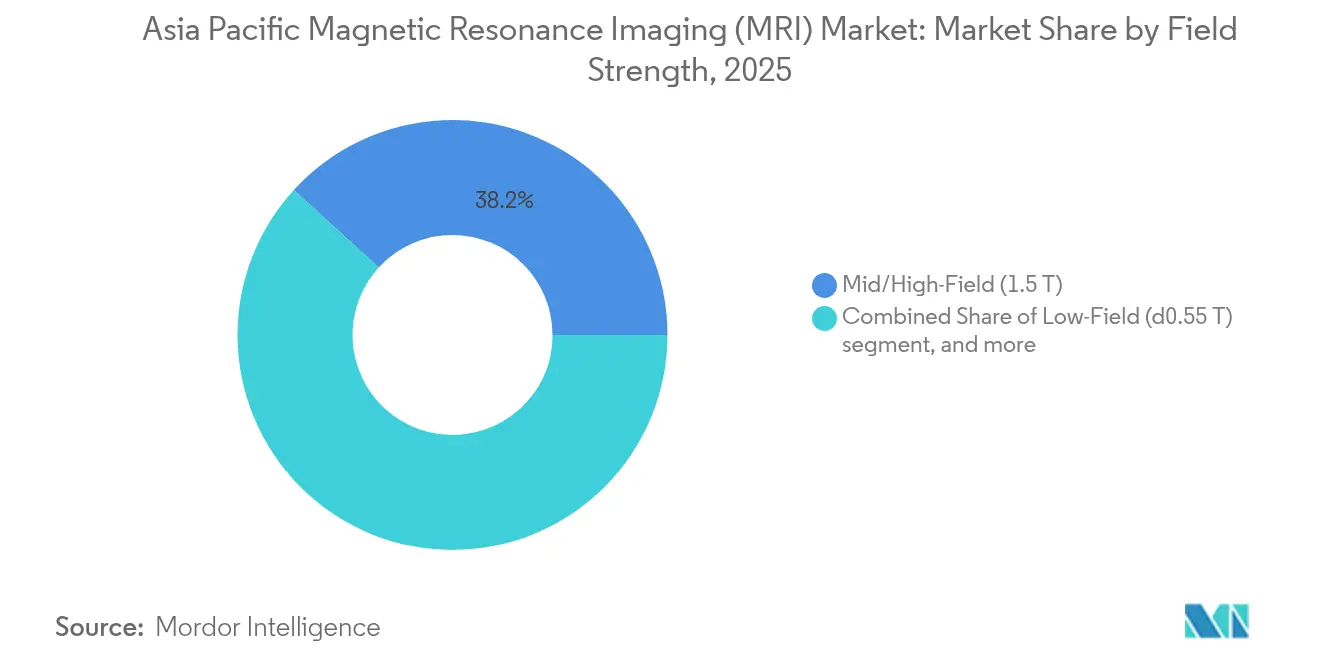
- By field strength, 1.5 T scanners held 38.21% revenue share of the Asia Pacific magnetic resonance imaging market in 2025, and ≤0.55 T platforms exhibit the fastest 7.56% CAGR.
- By application, neurology accounted for 28.32% of the Asia Pacific magnetic resonance imaging market size in 2025, while cardiology is growing at an 8.51% CAGR.
- By country, China led with 28.31% of Asia Pacific magnetic resonance imaging market share in 2025, while India is forecast to expand at a 7.41% CAGR through 2031.
Note: Market size and forecast figures in this report are generated using Mordor Intelligence’s proprietary estimation framework, updated with the latest available data and insights as of 2026.
Market Trends and Insights
Drivers Impact Analysis of Asia Pacific Magnetic Resonance Imaging (MRI) Market*
| Driver | (~) % Impact on CAGR Forecast | Geographic Relevance | Impact Timeline |
|---|---|---|---|
| Increasing burden of chronic diseases | +1.2% | China, India, Japan | Long term (≥ 4 years) |
| Universal-health-coverage expansion in Asian nations | +0.9% | India, Southeast Asia | Medium term (2-4 years) |
| Introduction of hybrid MRI systems in emerging markets | +0.7% | China, India, South Korea, Australia | Medium term (2-4 years) |
| Rapid growth in aging population & imaging demand | +1.1% | Japan, South Korea, Singapore, urban China | Long term (≥ 4 years) |
| AI-enabled accelerated image reconstruction cuts scan time | +0.8% | Japan, South Korea | Short term (≤ 2 years) |
| Domestic magnet / cryogen manufacturing incentives | +0.6% | China, India | Medium term (2-4 years) |
| Source: Mordor Intelligence | |||
Increasing Burden of Chronic Diseases
Asia’s rising prevalence of cardiovascular, oncologic, and neuro-degenerative disorders directly lifts annual MRI exam volumes. Diabetes-related neuropathy and stroke screening require high-resolution brain and vascular imaging more frequently than five years ago, driving procurement of both 1.5 T workhorse scanners and premium 3 T platforms. Large tertiary hospitals in China now embed MRI into standardized care pathways for oncology staging, boosting average scans per installed unit to more than 5,500 per year, compared with 4,200 in 2021. As chronic disease management shifts toward early intervention, health ministries continue to subsidize advanced imaging capacity, sustaining baseline growth for the Asia Pacific magnetic resonance imaging market[1].
Universal-Health-Coverage Expansion in Asian Nations
National insurance schemes such as India’s Ayushman Bharat have increased covered outpatient imaging, expanding the addressable patient pool by up to 63 million lives since 2023. The immediate effect is a rise in entry-level and refurbished MRI purchases at district hospitals that previously relied on CT or patient referrals to metropolitan centers. Portable ≤0.55 T systems attract administrators because they operate without shielded rooms, reducing installation cost by nearly 45% compared with conventional 1.5 T suites. Taken together, expanded coverage and cost-optimized hardware enlarge the Asia Pacific magnetic resonance imaging market[2].
Introduction of Hybrid MRI Systems in Emerging Markets
Combined PET/MRI and SPECT/MRI scanners offer clinicians metabolic, functional, and anatomic information in a single session, improving diagnostic accuracy for oncology and cardiology cases. Flagship academic centers in Seoul, Shanghai, and Sydney adopted hybrid models in 2024, documenting a 22% drop in diagnostic ambiguity compared with separate sequential exams. These early results justify the premium pricing of hybrid platforms, attracting tier 2 hospitals that handle complex oncology workloads. Manufacturers such as United Imaging Healthcare capitalize by bundling hybrid technology with AI-based workflow tools, reinforcing revenue diversity inside the Asia Pacific magnetic resonance imaging market[3].
AI-Enabled Accelerated Image Reconstruction Cuts Scan Time
Deep learning reconstruction software now integrates seamlessly with scanners older than 10 years, cutting acquisition time by as much as 59% without hardware replacement. Japan’s regulatory pathway for third-party AI modules, guided by the Pharmaceuticals and Medical Devices Agency, fast-tracks clinical implementation and sets a regional precedent. Hospitals report 37% higher daily throughput after activating AI recon, generating additional billable exams that shorten equipment payback periods. These efficiencies bolster demand for software-retrofit subscriptions alongside new-system purchases, deepening vendor-provider partnerships throughout the Asia Pacific magnetic resonance imaging market.
Restraints Impact Analysis of Asia Pacific Magnetic Resonance Imaging (MRI) Market*
| Restraint | (~) % Impact on CAGR Forecast | Geographic Relevance | Impact Timeline |
|---|---|---|---|
| High System Acquisition & Maintenance Costs | -1.8% | Emerging Asia Pacific markets | Long term (≥ 4 years) |
| Helium Supply-Chain Vulnerability | -1.2% | Global, acute in high-field installations | Medium term (2-4 years) |
| Shortage of Sub-Specialty Radiologists | -0.9% | India, Indonesia, Philippines, rural China | Medium term (2-4 years) |
| Hospital CAPEX Diversion to CT & PET During Economic Slowdowns | -0.7% | Developing Asia Pacific economies | Short term (≤ 2 years) |
| Source: Mordor Intelligence | |||
High System Acquisition & Maintenance Costs
New 1.5 T installations carry an average ten-year total cost of ownership exceeding USD 2.8 million once facility retrofit, preventive maintenance, and software upgrades are included. Public hospitals in Indonesia and the Philippines allocate less than 6% of operating budgets to capital equipment, highlighting affordability barriers. Providers increasingly turn to subscription-based “imaging-as-a-service” models, shifting upfront investment to multiyear operating leases indexed to scan volume, a strategy pioneered by Philips and regional financing partners. Such models mitigate, but do not eliminate, cost restraints on the Asia Pacific magnetic resonance imaging market.
Helium Supply-Chain Vulnerability
Helium price spikes of 35% in 2024 raised annual running costs for superconducting magnets, prompting providers to retrofit zero-boil-off technology or evaluate permanent-magnet alternatives. The University of Hong Kong demonstrated a 0.05 T whole-body prototype that operates entirely without cryogen, validating clinical utility when combined with AI-based denoising algorithms. Vendors now market “helium-light” 1.5 T systems holding under 70 liters, down from 1,500 liters a decade earlier, easing logistics but not fully resolving supply risk. Persistent helium uncertainty tempers purchasing in smaller economies, restraining the Asia Pacific magnetic resonance imaging market.
*Our forecasts treat driver/restraint impacts as directional, not additive. The impact forecasts reflect baseline growth, mix effects, and variable interactions.
Asia Pacific Magnetic Resonance Imaging (MRI) Market Segment Analysis
By Architecture:
Patient-Centric Design Drives Open System AdoptionOpen scanners delivered 8.27% CAGR between 2026 and 2031, outpacing the overall Asia Pacific magnetic resonance imaging market although closed configurations retained 55.02% share in 2025. Hospitals value the 270-degree patient access of open bores for interventional procedures and for cohorts prone to claustrophobia. Portable iterations weighing under 3 tons are now dispatched to rural clinics in Sichuan Province under provincial tele-imaging pilots, confirming that form factor flexibility converts directly into expanded patient reach. As reconstruction software compensates for lower field strength, diagnostic confidence in musculoskeletal and pediatric cases matches closed-bore benchmarks. Growth remains strongest in Southeast Asia, where outpatient imaging centers differentiate with comfort-oriented marketing.
Open architecture suppliers are layering cloud-based protocol libraries and automated positioning aids, reducing technologist learning curves. Meanwhile, closed systems continue to dominate research and high-end neurological applications because of superior gradient performance and coil ecosystem depth. Vendors have started offering hybrid service contracts allowing providers to mix open and closed units under a single uptime guarantee, a model gaining traction in Japan’s private hospital groups. Consequently, both sub-segments reinforce the Asia Pacific magnetic resonance imaging market, with open systems supplying incremental volume while closed platforms preserve high-resolution leadership.

By Field Strength:
Low-Field Innovation Disrupts Traditional HierarchiesMid-field 1.5 T units generated 38.21% of the Asia Pacific magnetic resonance imaging market share in 2025, confirming their role as universal workhorses. Yet ≤0.55 T systems recorded the fastest 7.56% CAGR as AI post-processing neutralizes inherent signal-to-noise limitations. DeepSee Technology’s shield-free bedside model, cleared by China’s NMPA in 2025, illustrates how low-field designs avoid expensive RF cages and deliver meaningful neuro imaging inside intensive-care units. Cost-conscious public hospitals in India project 32% lower five-year operating expenses when adopting low-field scanners instead of refurbishing legacy 1.5 T rooms.
High-field 3 T platforms retain momentum for cardiac mapping, whole-body diffusion, and functional MRI studies, securing budget allocations in academic institutions. At the far end, 7 T research magnets remain rare, with fewer than 15 installations across Asia Pacific, constrained by purchase price and safety protocol complexity. Overall, field-strength diversity enables providers to align equipment with case-mix realities, ensuring that each echelon contributes to the Asia Pacific magnetic resonance imaging market size growth trajectory.
By Application:
Cardiology Acceleration Driven by AI IntegrationNeurology retained 28.32% share in 2025, reflecting MRI’s role in stroke, glioma, and dementia management pathways. Cardiology, however, posts the quickest 8.51% CAGR as new non-contrast T1-mapping and strain quantification sequences meet rising cardiovascular disease incidence. AI vendors now bundle automated left-ventricular function reporting with scanner consoles, cutting reading time by 40% and allowing smaller centers to launch cardiac services without dedicated cardiologist staffing. Evolving reimbursement in South Korea and Australia grants separate billing codes for stress cardiac MRI, improving return on investment. Musculoskeletal and oncology segments continue steady expansion, collectively absorbing additional scanner slots during off-peak neurology scheduling. Application diversification thus sustains broad-based demand across the Asia Pacific magnetic resonance imaging market.
Geography Analysis
China Magnetic Resonance Imaging (MRI) Market
China accounted for 28.31% of the Asia Pacific magnetic resonance imaging market in 2025, underpinned by multi-billion-dollar provincial subsidy programs that reimburse up to 50% of scanner purchase price for county hospitals. Domestic firms benefited from preferential procurement scoring, with United Imaging Healthcare surpassing 5,000 cumulative MRI installations nationwide by mid-2025. AI-ready picture archiving platforms and a federal imaging cloud facilitate rapid algorithm deployment, reinforcing clinical adoption curves. Province-level data analytics also encourage outcome-based purchasing that favors high-throughput designs.
India Magnetic Resonance Imaging (MRI) Market
India is the fastest-growing national cohort, registering a 7.41% CAGR through 2031. The Ayushman Bharat scheme reimburses up to 60% of outpatient MRI cost, and public-private partnerships fast-track scanner placement in tier-2 cities. Strong medical tourism demand for orthopedic and cardiac interventions drives private chain expansion, while indigenous assembly of 0.4 T and 1.5 T systems reduces import duties by 15%. Regulatory simplification under the Medical Devices (Amendment) Rules 2024 shortened license timelines to under six months, catalyzing vendor pipeline momentum.
APAC Magnetic Resonance Imaging (MRI) Market
Japan, South Korea, and Australia constitute mature sub-markets where replacement demand prevails. Japan’s scanner density exceeds 55 units per million population, the highest globally, leading vendors to focus on software upgrades and hybrid PET/MRI adoption. South Korea shows similar saturation but pioneers operational models such as per-scan AI fees bundled into national insurance tariffs. Australia’s public hospitals stress cost-effectiveness; hence, they negotiate multiyear managed-equipment service contracts that bundle 3 T hardware, coils, and analytics dashboards.
ASEAN Magnetic Resonance Imaging (MRI) Market
The Rest of Asia Pacific cluster—Indonesia, Malaysia, Thailand, Vietnam, and the Philippines—adds incremental volume through greenfield private hospitals targeting middle-class segments. Portable ≤0.55 T units find early success in island geographies where road logistics complicate patient transfer. Cross-border teleradiology hubs in Singapore support these markets by interpreting scans remotely, demonstrating the region-wide interplay that sustains the Asia Pacific magnetic resonance imaging market.
Regulatory Landscape
Asia Pacific MRI market access is governed by fragmented, country-specific medical device regimes, which means OEMs must navigate distinct requirements for registration, post-market obligations, and quality systems across regulators such as China NMPA, Japan PMDA, Singapore HSA, South Korea MFDS, India CDSCO, and Australia TGA. Industry organizations such as APACMed have become a practical route for accelerating device registration in parts of the region, including markets that accept abridged pathways based on approvals from reference jurisdictions, while IMDRF and GHWP alignment around standards like ISO 13485 helps manufacturers manage cross-border quality expectations for themselves and critical suppliers.
In China, the NMPA announced updated Good Manufacturing Practice requirements for medical devices (Announcement No. 107 of 2025), with the revised GMP taking effect on November 1, 2026 and raising compliance burden for marketing authorization holders and their contract manufacturing and validation documentation. In Japan, the PMDA and the Ministry of Health, Labour and Welfare continue to shape adoption through approvals for MRI-related software and consumables, illustrated by March 2026 approval of Bayer's low-dose MRI contrast agent (gadoquatrane, Ambelvist) and PMDA clearance activity for MRI-based AI tools.
Value Chain Analysis
The MRI value chain in Asia Pacific includes upstream raw materials and subsystems (magnets, gradients, RF chains, coils, cryogen and thermal-management components), midstream system integration and final assembly, and downstream installation, service, and clinical workflow enablement (protocols, reconstruction software, PACS connectivity, and training). Even with growing final assembly and localization initiatives in China, Japan, and South Korea, superconducting magnets and certain gradient components still show meaningful import dependence, and lead times for superconducting magnets can extend to 6-12 months while remaining exposed to global liquid helium availability and price volatility.
Commercialization relies on OEM direct sales to tertiary hospitals and group purchasing, supplemented by local distributors and service partners in tier-2/tier-3 cities and island geographies. After-sales service, uptime guarantees, and software upgrades, including AI reconstruction retrofits for older fleets, are increasingly central to vendor differentiation, while compliance across multiple regulators drives localized documentation, in-country representation, and audit readiness through the commercialization chain. Localization programs, including domestic assembly and component sourcing incentives in large markets, are also reshaping supplier qualification and increasing the strategic importance of regional service depots and application training networks.
Competitive Landscape
The Asia Pacific magnetic resonance imaging market features moderate concentration: the top five vendors together controlled roughly 62% revenue in 2024. GE Healthcare, Siemens Healthineers, and Philips Healthcare leverage decades-old installed bases and multivendor service teams, yet their combined share is trending downward as regional makers scale. United Imaging Healthcare recorded nearly 30% year-on-year export growth in 2025, shipping scanners to over 14,000 hospitals worldwide, while Neusoft Medical Systems broadened its ≤0.5 T portfolio for primary-care settings.
Technological race centers on helium-light magnets, AI reconstruction suites, and workflow orchestration tools. Siemens’ Deep Resolve and GE’s AIR Recon DL compete head-to-head with start-ups such as AirMedical that offer vendor-agnostic software compatible with older fleets, capturing high-margin subscription revenue. At the hardware frontier, DeepSee Technology’s shield-free bedside unit disrupts conventional siting economics, prompting incumbents to accelerate their own low-field roadmaps. Simultaneously, hybrid PET/MRI vendors are expanding reference sites to prove cost–benefit; early adopters report reduced patient transfers and accelerated oncology treatment planning.
Partnerships between manufacturers and hospital chains now emphasize shared-risk models, where leasing rates or revenue shares fluctuate with scanner utilization. This strategy mitigates cap-ex hurdles for providers while locking vendors into multiyear revenue streams. Local component sourcing mandates in China and India further compel multinational companies to invest in assembly lines, aligning with government industrial policy but eroding cost advantages linked to global supply chains. Collectively, these shifts guarantee lively strategic maneuvering within the Asia Pacific magnetic resonance imaging market over the forecast horizon.
Asia Pacific Magnetic Resonance Imaging (MRI) Industry Leaders
-
Siemens Healthcare
-
Canon Medical Systems Corporation
-
Koninklijke Philips NV
-
GE Healthcare
-
Fujifilm Corporation
- *Disclaimer: Major Players sorted in no particular order
Asia Pacific Magnetic Resonance Imaging (MRI) Market Companies Covered in this Report
- Alltech Medical Systems
- Aspect Imaging
- Beijing Wandong Medical
- Bruker BioSpin
- Canon
- Esaote
- FUJIFILM
- GE Healthcare
- Hitachi Healthcare (Part of Fujifilm)
- Mindray (Shenzhen Mindray Bio-Medical)
- MR Solutions
- Neusoft Medical Systems
- Koninklijke Philips
- Shenzhen Anke High-Tech
- Shenzhen Basda Medical
- Siemens Healthineers
- SpinTech MRI
- Synaptive Medical
- Time Medical Systems
- United Imaging Healthcare
Read Analysis of Asia Pacific Magnetic Resonance Imaging (MRI) Companies
Market Opportunities and Future Outlook
Helium-light and helium-free MRI platforms create whitespace in cost- and infrastructure-constrained settings across emerging Asia Pacific, where conventional siting requirements for shielding, quench pipes, and cryogen logistics can limit adoption. This opportunity is reinforced by local product development and manufacturing capacity initiatives, including GE HealthCare opening its Magnetic Resonance Eastern Hemisphere Headquarters R&D Center in Tianjin in December 2025 (its only system-level MRI research base outside the United States) and India's push toward indigenous MRI capability, including the April 2026 launch announcement around a helium-free 1.5 T scanner by VoxelGrids.
Service access expansion also connects to workforce and operating-model constraints, with policy adjustments opening additional pathways for utilization in undersupplied regions. In South Korea, the Ministry of Health and Welfare implemented a June 2026 amendment to special medical equipment operation rules that allows part-time radiologist staffing (minimum eight hours per week) for MRI operations, targeting regional testing gaps and supporting the economics of smaller centers that previously struggled to meet staffing requirements. Beyond this, large network procurements and centralized contracting provide another route for scale deployments, as illustrated by the October 2025 agreement between Superhealth and United Imaging to equip 100 Indian hospitals with advanced radiology systems, including AI-ready MRI, shifting purchasing power toward multi-site hospital networks and vendors able to standardize installation, training, and multiyear service coverage.
Recent Industry Developments in Asia Pacific Magnetic Resonance Imaging (MRI) Market
- May 2026: Philips and the Asian Society of Cardiovascular Imaging (ASCI) signed an MoU at the 19th ASCI Congress in Singapore to advance cardiovascular imaging education and clinical practice across Asia Pacific. The collaboration supports faster diffusion of standardized cardiac MRI protocols and AI-enabled workflows, which can lift utilization and strengthen vendor positioning in high-growth cardiology applications.
- September 2025: DeepSee Technology obtained China NMPA Class III clearance for the wMR-510, described as a no-shielding mobile head MRI designed for bedside use in emergency and ICU settings. The approval signals momentum for low-field and mobile architectures that reduce siting barriers and expands the addressable footprint beyond traditional radiology suites.
- June 2024: The University of Hong Kong published results on a whole-body 0.05 T MRI concept enhanced by deep learning, demonstrating clinically useful imaging from very low-field hardware without relying on cryogens. This work strengthened the technical case for helium-free and simplified-install MRI pathways, influencing OEM roadmaps and procurement discussions in cost-sensitive health systems.
Asia Pacific Magnetic Resonance Imaging (MRI) Market Report Scope and Research Methodology
Market Definition and Coverage
For this methodology, the Asia Pacific MRI market is measured as the value of magnetic resonance imaging (MRI) systems sold and installed across Asia Pacific, covering core hardware configurations and field strengths used for clinical imaging.
Scope exclusions: The sizing excludes service revenue such as scanning procedures, maintenance contracts, and third party refurbished resale values.
Segments Covered in This Report
- By Architecture
- Closed MRI Systems
- Open MRI Systems
- By Field Strength
- Low-Field (≤0.55 T)
- Mid/High-Field (1.5 T)
- Very-High-Field (3 T)
- Ultra-High-Field (7 T +)
- By Application
- Neurology
- Oncology
- Musculoskeletal
- Cardiology
- Gastroenterology
- Other Applications
- Country
- China
- Japan
- India
- South Korea
- Australia
- Rest of Asia-Pacific
Data Sources, Market Sizing, and Validation
Desk Research
Desk research is used to set the factual base for the model and to avoid relying on assumptions in isolation. We reviewed public health spending and imaging-related infrastructure indicators and then linked them with MRI installation and capacity signals across key Asia Pacific countries.
Typical inputs were taken from sources such as the World Health Organization, World Bank, OECD health statistics (where available for the region), national health ministries and statistical offices, and International Atomic Energy Agency health related publications that sometimes reference imaging access. These were complemented with company annual reports, investor presentations, press releases, and hospital network procurement announcements, and then checked against paid subscriptions used for company financials, news, and patent databases to understand product cycles and timing. This list is illustrative only, and many other public sources were also referred to for data collection, validation, and clarification.
Primary Interviews and Surveys
Primary work focused on validating what desk sources cannot fully show, such as current replacement timing, budget constraints, and how utilization patterns differ between large hospitals and diagnostic centers. We spoke with a mix of manufacturers, distributors, and other channel participants, along with radiology and biomedical engineering stakeholders, and coverage was kept balanced across major APAC markets so assumptions could be adjusted before finalization.
Distribution of primary research fieldwork respondents
| Company type | Respondent position |
|---|---|
| Top tier: 37% | CXOs: 17% |
| Mid tier: 42% | Functional/Unit leaders: 41% |
| Smaller Players: 21% | Managers: 42% |
Market-Sizing & Forecasting
The core sizing logic uses a top-down approach where the installed base and imaging capacity signals are rebuilt by country, then translated into annual system demand based on replacement timing and new site additions. Those totals are cross-checked with selective bottom-up approximations, including sampled average selling prices by field strength and a reasonableness check using supplier and distributor revenue splits, which helps adjust for pricing mix shifts.
Key inputs in the model include MRI installed base expansion, replacement cycle length, field strength mix (for example 1.5T versus 3T), new hospital and diagnostic center capacity additions, and public and private healthcare capex trends that influence purchasing. For forecasting, scenario analysis is used around capex cycles and tender timing, and then the central case is aligned to expert views collected during interviews so the demand path does not depend on a single indicator. Where a country has limited visibility, gaps are handled through proxy variables such as bed additions and imaging density, followed by re-checks with regional respondents to keep the estimates practical.
Data Validation & Update Cycle
Outputs are validated through multiple passes, starting with consistency checks across countries, field strengths, and implied unit volumes versus value. Large variances trigger a deeper review of pricing assumptions, replacement timing, and whether one-off procurement cycles are being over-counted, and then respondents are re-contacted if the gap remains material.
Before sign-off, the model is reviewed by another analyst to confirm that inputs, calculations, and references are traceable. The report is refreshed annually, and interim updates are made when major policy changes, reimbursement shifts, or notable tender announcements change the near-term outlook. Right before delivery, a final scan is completed so clients receive an up-to-date view.
Mordor Intelligence's Asia Pacific Mri Market Size Versus Other Published Estimates
Published market sizes for Asia Pacific MRI can look different because each publisher defines what is counted and how pricing is averaged across field strengths and countries. Variation also comes from the base year, the currency conversion timing, and whether the forecast assumes a steady tender cycle or a more uneven procurement pattern.
Service revenue from MRI scans sits outside Mordor Intelligence's scope here, and that single exclusion can widen the spread when other estimates blend equipment with procedure income or maintenance. Another common driver is how average selling prices are handled, since mixing premium 3T systems with lower-field systems without a clear country-level weight can move totals quickly, and some publications also use older base-year price points without re-checking them against recent hospital tenders.
Benchmark comparison
| Source | Market Size | Gaps in Research Methodology |
|---|---|---|
| Mordor Intelligence | USD 2.29 B (2025) | |
| Trade Publisher A | USD 2.15 B (2024) | Uses a different base year and does not clearly separate equipment revenue from other MRI-related income streams, which can shift the starting value even before forecasting. |
| Industry Research Outlet B | USD 1.66 B (2024) | Focuses on MRI systems only with narrower country coverage and a more conservative ASP mix assumption, which tends to lower the value versus broader APAC roll-ups. |
Overall, the gap is mostly explained by what gets included in the market and how the pricing mix is weighted across countries and field strengths. By keeping the steps traceable to installed base, replacement demand, and realistic ASP ranges, the resulting number stays easier to defend and to update when new procurement signals emerge.
Key Questions Answered in the Report
What is the current size of the Asia Pacific magnetic resonance imaging market?
The Asia Pacific magnetic resonance imaging market size reached USD 2.44 billion in 2026 and is forecast to hit USD 3.32 billion by 2031.
Which country leads scanner installations across Asia Pacific?
China holds 28.31% revenue share owing to large-scale government procurement incentives and robust domestic manufacturing.
Which segment is expanding fastest within the regional MRI space?
The cardiology segment shows the highest 8.51% CAGR, supported by AI-enhanced cardiac MRI protocols.
How are low-field scanners impacting equipment budgets?
²0.55 T systems reduce siting and running costs by roughly 45%, helping resource-constrained hospitals adopt MRI.
What technological shift is most influencing purchase decisions through 2031?
AI-enabled image reconstruction that shortens scan times by up to 59% is becoming a pivotal factor in vendor selection.
How vulnerable is the market to helium supply disruptions?
Helium dependence remains a restraint, but helium-light and helium-free designs are mitigating long-term risk across new installs.