
Market Overview
| Study Period | 2021 - 2031 |
|---|---|
| Forecast Data Period | 2026 - 2031 |
| Base Year Market Size (2025) | USD 6.32 Billion |
| Market Size (2026) | USD 6.88 Billion |
| Market Size (2031) | USD 10.52 Billion |
| Growth Rate (2026 - 2031) | 8.90 % |
| Market Concentration | Medium |
Major Players *Disclaimer: Major Players sorted in no particular order Image © Mordor Intelligence. Reuse requires attribution under CC BY 4.0. | |
Asia-Pacific Meal Replacement Products Market Analysis by Mordor Intelligence
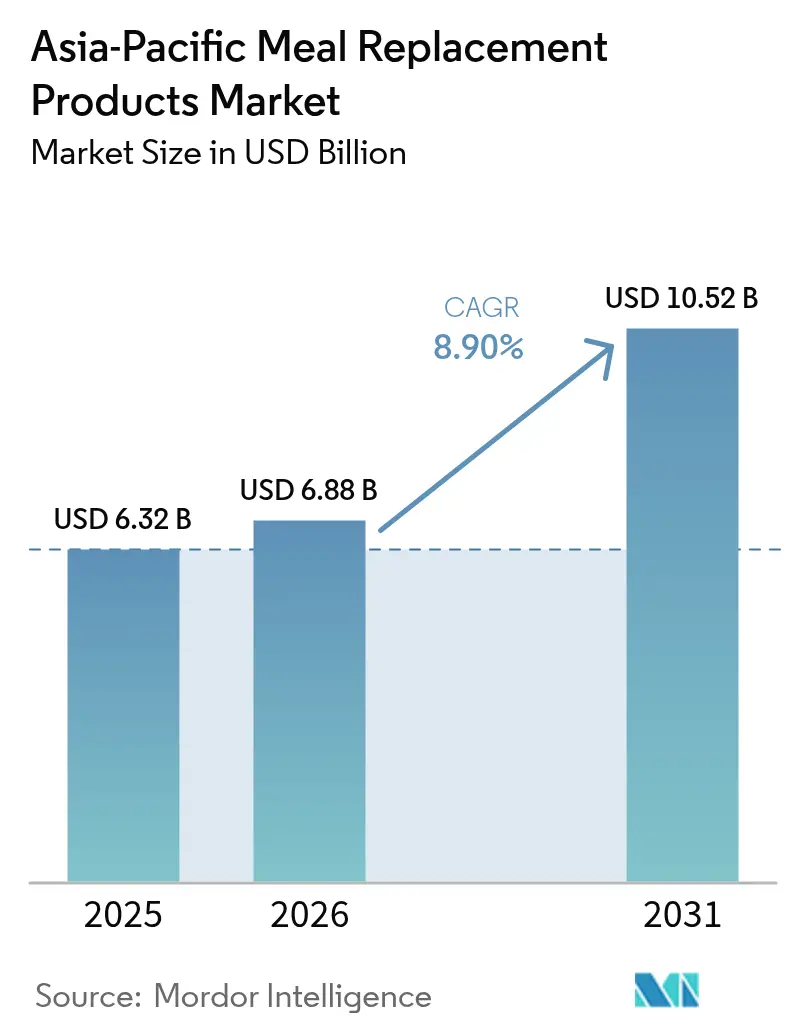
The Asia-Pacific meal replacement products market size was valued at USD 6.32 billion in 2025 and estimated to grow from USD 6.88 billion in 2026 to reach USD 10.52 billion by 2031, at a CAGR of 8.90% during the forecast period (2026-2031). This growth trajectory reflects the region's accelerating health consciousness, urbanization pressures, and evolving dietary preferences that favor convenient nutrition solutions over traditional meal patterns. China's National Fitness Plan targeting 38.5% of the population exercising regularly by 2025 exemplifies the policy-driven wellness momentum propelling demand across major economies[1].
Key Report Takeaways
- By product type, powdered formulas held a 43.72% share of the Asia-Pacific meal replacement products market share in 2025, while ready-to-drink (RTD) offerings are projected to post a 10.43% CAGR to 2031.
- By packaging format, bottles/jars captured 44.31% revenue in 2025; pouches are set to expand at a 9.87% CAGR through the forecast period.
- By nature, conventional formulations controlled 86.92% of the 2025 base, but organic lines are on track for an 10.89% CAGR between 2026 and 2031.
- By distribution channel, supermarkets/hypermarkets contributed 34.78% of 2025 sales; online retail is expected to register the fastest 11.12% CAGR.
- By geography, China dominated with a 37.92% 2025 share, whereas India is forecast to lead in growth at 10.11% CAGR from 2026-2031.
Note: Market size and forecast figures in this report are generated using Mordor Intelligence’s proprietary estimation framework, updated with the latest available data and insights as of 2026.
Market Trends and Insights
Drivers Impact Analysis of Asia-Pacific Meal Replacement Products Market*
| Driver | (~) % Impact on CAGR Forecast | Geographic Relevance | Impact Timeline |
|---|---|---|---|
| Rising demand for convenient, portion-controlled nutrition | +1.8% | Global, strongest in urban China, Japan, Singapore | Medium term (2-4 years) |
| Growing obesity and fitness focus fuels weight-management usage | +1.5% | China, India, Australia, with spillover to Thailand, Malaysia | Long term (≥ 4 years) |
| Premiumization and innovation in protein-fortified RTD beverages | +1.2% | Japan, South Korea, Singapore, urban China | Short term (≤ 2 years) |
| Corporate wellness schemes and gym chain growth boost adoption | +0.9% | Japan, Australia, Singapore, expanding to China, India | Medium term (2-4 years) |
| Rising consumer demand for functional ingredients | +0.7% | Asia-Pacific core markets, early adoption in premium segments | Medium term (2-4 years) |
| Rising preference for plant-based and protein-rich meal replacements | +0.6% | Australia, Singapore, Japan, emerging in India, China | Long term (≥ 4 years) |
| Source: Mordor Intelligence | |||
Rising Demand for Convenient, Portion-Controlled Nutrition
Urbanization pressures and extended working hours across Asia-Pacific create structural demand for time-efficient nutrition solutions that maintain dietary quality without preparation complexity. There is an increase in meal replacement sales, reflecting the healthcare sector's recognition of controlled nutrition benefits for patient management and staff wellness programs. The trend extends beyond individual consumers to institutional adoption, where corporate cafeterias and healthcare facilities integrate portion-controlled options to address rising diabetes and obesity rates. Regulatory frameworks in Indonesia and Thailand implemented new labeling requirements for sugar, salt, and fat content in 2024, creating transparency that favors nutritionally balanced meal replacements over traditional processed foods.
Growing Obesity and Fitness Focus Fuels Weight-Management Usage
Asia-Pacific's obesity epidemic drives systematic healthcare responses that position meal replacements as clinical intervention tools rather than lifestyle products. Whorld Health Organization (WHO) data indicates obesity rates exceeding 31% in the Southeast Asia region, with government initiatives promoting structured weight management programs that incorporate controlled-calorie nutrition solutions[2]. Additionally, corporate wellness schemes gain momentum as employers recognize productivity benefits from employee health improvements, with Australian and Japanese companies leading the adoption of workplace nutrition programs that include meal replacement subsidies. The fitness industry's expansion creates complementary demand channels, where gym chains partner with nutrition brands to offer post-workout recovery solutions and weight management support programs.
Premiumization and Innovation in Protein-Fortified RTD Beverages
Premium positioning strategies succeed across developed Asia-Pacific markets as consumers demonstrate willingness to pay higher prices for enhanced nutritional profiles and functional benefits. Abbott's January 2025 launch of Protality Nutrition Shake exemplifies this trend, featuring 30 grams of high-quality protein, 25 vitamins and minerals, and positioned at USD 13.69 for a four-pack, targeting adults seeking weight loss while preserving muscle mass. Japanese consumers prioritize protein content in balanced nutrition foods, with consumers specifically seeking protein-focused formulations, supporting premium RTD product development that emphasizes bioavailability and amino acid profiles. Technology integration enables personalized nutrition approaches, where brands leverage mobile applications and diagnostic tools to justify premium pricing through customized formulations.
Corporate Wellness Schemes and Gym Chain Growth Boost Adoption
Institutional demand channels create stable revenue streams that reduce market volatility and enable long-term planning for meal replacement manufacturers. Corporate wellness program adoption accelerates across Asia-Pacific as employers recognize healthcare cost reduction benefits and productivity improvements from employee nutrition support. Gym chain proliferation creates dedicated distribution channels where meal replacement products integrate with fitness services, offering post-workout nutrition and weight management programs that drive consistent consumption patterns. Japanese companies increasingly include health investment support, with younger demographics willing to invest in health-focused products, creating favorable conditions for corporate procurement programs.
Restraints Impact Analysis of Asia-Pacific Meal Replacement Products Market*
| Restraint | (~) % Impact on CAGR Forecast | Geographic Relevance | Impact Timeline |
|---|---|---|---|
| High cost of meal replacement products compared to traditional meals | -1.4% | Price-sensitive markets: India, Indonesia, Philippines, Vietnam | Short term (≤ 2 years) |
| Regulatory hurdles and varying standards across countries | -0.8% | Cross-border operations, particularly China, India, Indonesia | Medium term (2-4 years) |
| Challenges in taste and flavor acceptance | -0.6% | Traditional food culture markets: China, Japan, Thailand, Indonesia | Medium term (2-4 years) |
| Competition from traditional healthy snacks and fresh food options | -0.5% | Markets with strong street food culture: Thailand, Singapore, Malaysia, India | Long term (≥ 4 years) |
| Source: Mordor Intelligence | |||
High Cost of Meal Replacement Products Compared to Traditional Meals
Price sensitivity across emerging Asia-Pacific markets creates adoption barriers that limit mass-market penetration despite growing health awareness and urbanization trends. Consumers in Asia-Pacific increasingly hunt for cheaper alternatives and promotions, with value-seeking behavior intensifying across price-sensitive markets, including India, Indonesia, Philippines, and Vietnam. Traditional meal options remain significantly more affordable, with local street food and home-cooked meals costing fractions of branded meal replacement products, particularly in markets where labor costs keep food service prices low. Currency fluctuations and import dependencies exacerbate cost challenges, as many premium ingredients and specialized processing equipment require foreign exchange, making local pricing vulnerable to macroeconomic volatility.
Regulatory Hurdles and Varying Standards Across Countries
Fragmented regulatory frameworks across Asia-Pacific create compliance complexity that increases market entry costs and delays product launches, particularly affecting smaller manufacturers lacking regulatory expertise. China's SAMR guidance on Foods for Special Medical Purposes registration processes, updated in January 2025, exemplifies evolving standards that require continuous compliance monitoring and documentation. Indonesia implemented new labeling regulations for sugar, salt, and fat content in October 2024, followed by health supplement labeling requirements in June 2024, creating additional compliance layers for meal replacement products. ASEAN harmonization efforts progress slowly, with individual countries maintaining distinct approval processes, ingredient restrictions, and health claim requirements that necessitate market-specific formulations and documentation.
*Our forecasts treat driver/restraint impacts as directional, not additive. The impact forecasts reflect baseline growth, mix effects, and variable interactions.
Asia-Pacific Meal Replacement Products Market Segment Analysis
By Product Type:
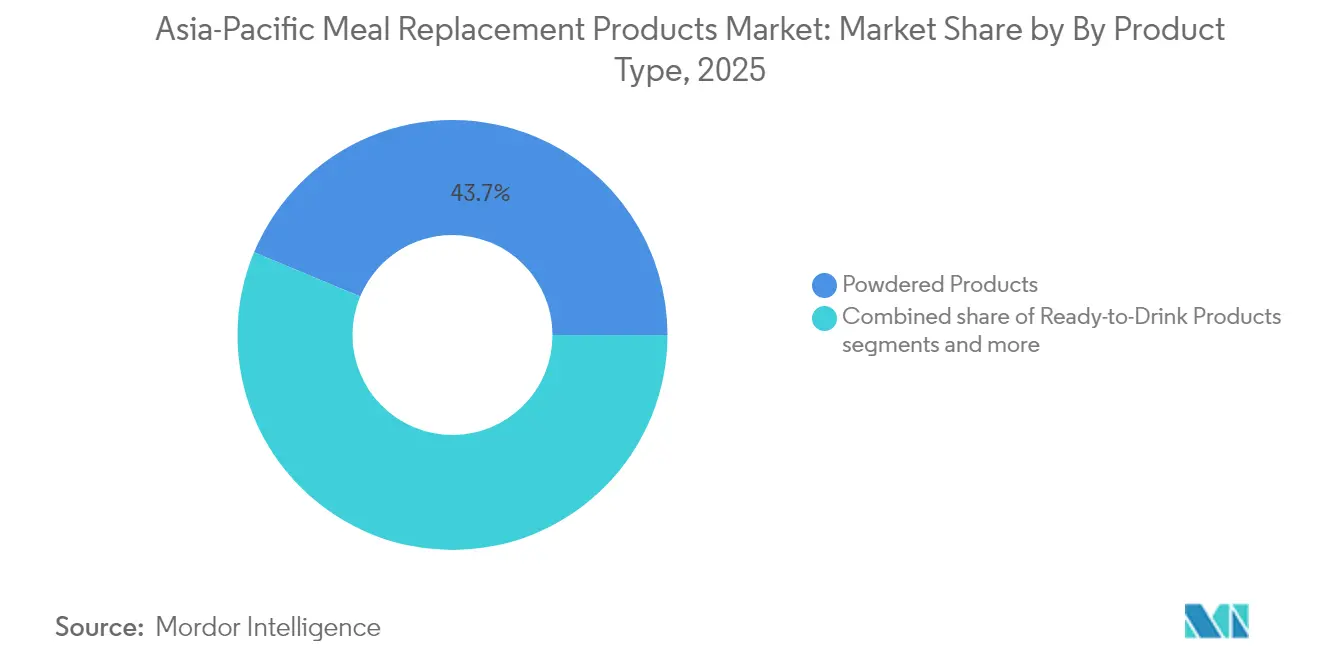
RTD Innovation Drives Category EvolutionPowdered products held the largest segment share at 43.72% in 2025, while ready-to-drink products are anticipated to grow at a CAGR of 10.43% through 2031, reflecting a shift in consumer preferences toward immediate consumption and convenience. Abbott's strategic product launches exemplify this trend, with Protality Nutrition Shake targeting weight management through ready-to-consume formats and Ensure Gold Plant-Based addressing lactose intolerance concerns in the Philippines market. The nutritional bars segment benefits from portability advantages and snack-replacement positioning, while the soups category gains traction in markets with established liquid meal traditions, particularly in China and Japan, where hot consumption preferences align with cultural dietary patterns.
Powdered products retain dominance through cost advantages and extended shelf life benefits that appeal to price-conscious consumers and institutional buyers seeking bulk procurement options. The format enables customization through mixing ratios and flavor additions, supporting personalized nutrition approaches that resonate with health-conscious demographics. Other product types explore niche applications in sports nutrition and medical nutrition segments, where specialized delivery mechanisms address specific consumer needs beyond general meal replacement.

By Packaging Format:
Sustainability Meets ConvenienceTraditional bottles and jars hold a dominant market share of 44.31% in 2025, while the pouches segment is projected to grow at a CAGR of 9.87%, driven by manufacturers' focus on sustainability and portability benefits. Flexible packaging innovations reduce material usage and transportation costs while enabling portion control and freshness preservation that appeals to single-serving consumption patterns. Tetra packs and cartons maintain steady growth through established supply chains and consumer familiarity, particularly in markets where ambient storage capabilities matter for distribution efficiency.
Environmental consciousness drives packaging evolution, with companies achieving B Corp certification and emphasizing sustainable packaging transitions as a core business strategy. Consumer willingness to pay premiums for sustainable packaging creates opportunities for innovative formats that combine environmental benefits with functional advantages. Regulatory frameworks increasingly emphasize packaging waste reduction, with Singapore's Zero Waste Master Plan and 30-by-30 food security goal creating policy support for circular economy approaches in food packaging.
By Nature:
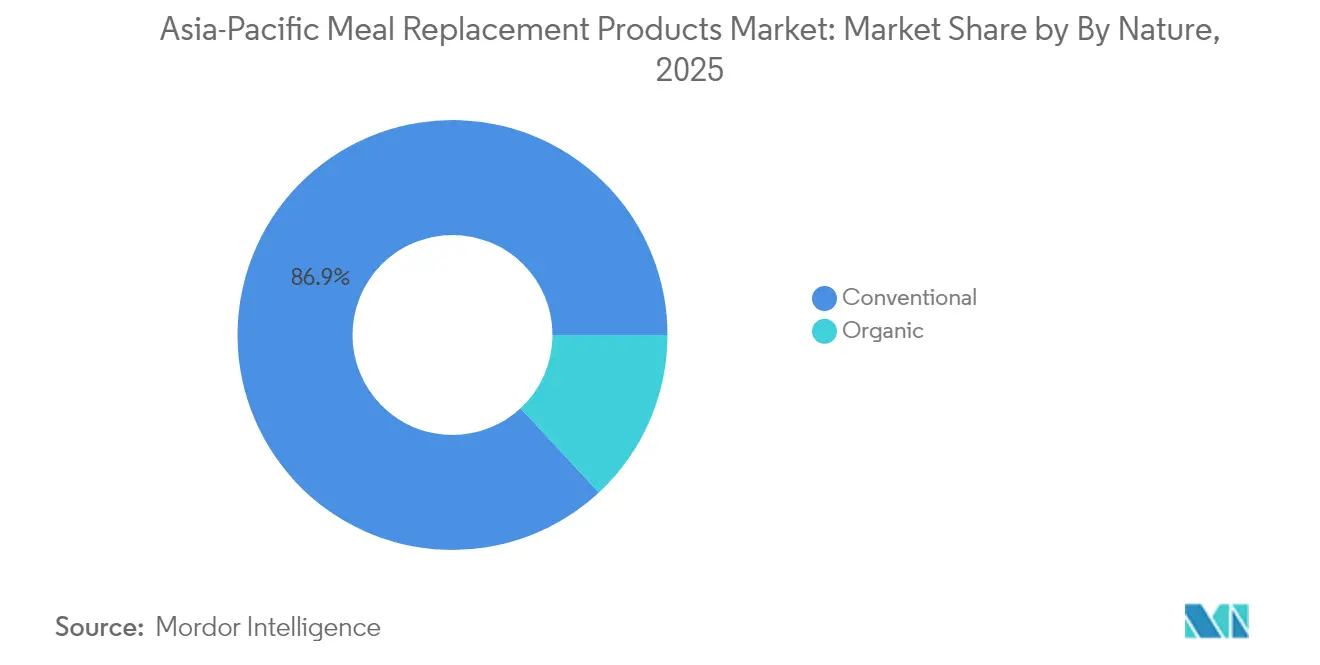
Organic Premium Positioning Gains MomentumConventional products held an 86.92% market share in 2025, while the organic segment is expected to grow at a CAGR of 10.89%. This growth reflects the success of premium positioning strategies targeting health-conscious consumers who are willing to pay higher prices for perceived quality benefits. Certification requirements create entry barriers that limit competitive intensity while establishing consumer trust through third-party validation of ingredient sourcing and processing methods. Supply chain complexity for organic ingredients necessitates long-term supplier relationships and inventory management that favor established players with procurement capabilities.
Conventional products benefit from cost advantages and wider ingredient availability that enable mass-market positioning and institutional sales channels. The segment's stability provides a cash flow foundation for manufacturers to invest in organic product development and market education initiatives. Cross-contamination prevention requirements in organic production create operational challenges that smaller manufacturers struggle to address, consolidating market share among larger players with dedicated facility capabilities.
By Distribution Channel:
Digital Transformation AcceleratesTraditional supermarkets/hypermarkets held a 34.78% market share in 2025. Online retail channels are expected to grow at a CAGR of 11.12%, driven by the growth of e-commerce platforms that facilitate direct-to-consumer relationships and subscription models. Southeast Asian e-commerce growth, led by Indonesia and Vietnam, showing the highest intent to increase online usage, creates favorable conditions for meal replacement brands seeking market entry through digital channels. Social commerce integration through TikTok Shop and livestreaming formats drives discovery and conversion, particularly for health-related products where influencer tutorial content resonates with younger demographics.
Convenience stores and specialty stores maintain relevance through immediate availability and product trial opportunities that complement online purchasing behavior. The channel mix evolution requires omnichannel strategies that balance digital efficiency with physical touchpoints for consumer education and brand building. Moreover, localized e-commerce strategies combined with marketplace presence and retail partnerships can drive rapid market penetration .
Geography Analysis
China Meal Replacement Products Market
China commands 37.92% market share in 2025 through established consumer awareness, extensive distribution infrastructure, and regulatory frameworks that support meal replacement product development. The market benefits from urbanization trends, rising disposable incomes, and government health initiatives that promote structured nutrition approaches for obesity prevention and fitness enhancement.
APAC Meal Replacement Products Market
India emerges as the fastest-growing geography at 10.11% CAGR through 2031, driven by an expanding middle class, increasing health consciousness, and corporate wellness program adoption across major cities. The market's growth potential attracts international players seeking to establish a presence before competitive intensity increases. Japan maintains mature market characteristics with sophisticated consumer preferences for functional ingredients and premium positioning, while Australia benefits from an established sports nutrition culture and regulatory clarity that supports product innovation. Indonesia, South Korea, Thailand, and Singapore represent emerging opportunities with distinct consumer preferences and regulatory environments that require localized approaches. The Rest of Asia-Pacific segment includes smaller markets with growth potential as distribution networks expand and consumer awareness increases through regional brand expansion strategies.
Regulatory Landscape
Regulation of meal replacements across Asia-Pacific remains fragmented, with country-specific rules shaping permissible formulations and claims. In Australia and New Zealand, meal replacements are covered under the Australia New Zealand Food Standards Code (Standard 2.9.3), while Very Low Energy Diet (VLED) products have been handled through the Food Standards Australia New Zealand (FSANZ) Application A1230 process. This approach aligns VLEDs more closely with Food for Special Medical Purposes requirements under Standard 2.9.5 and Codex STAN 203-1995.
Elsewhere in the region, governance is still taking shape around category definitions and nutrient thresholds. China has used a group standard pathway for meal replacement products (China Nutrition Society, T/CNSS 002-2018 draft) in the absence of a unified government standard, while South Korea's Ministry of Food and Drug Safety (MFDS) issued draft amendments (June 2023) to tighten nutrient-related requirements for products positioned to children. In Southeast Asia, claim substantiation and labeling oversight vary by market, with bodies such as Malaysia's Ministry of Health (via its Expert Committee on Nutrition, Health Claims and Advertising) influencing what can be stated on-pack and in advertising.
Competitive Landscape
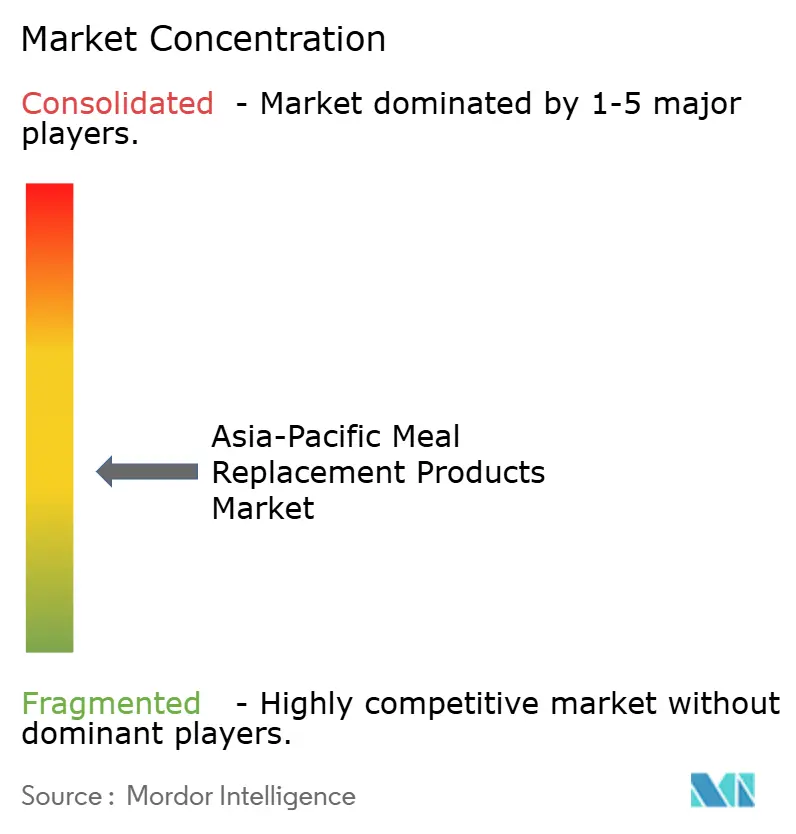
The Asia-Pacific meal replacement products market shows moderate fragmentation. This market structure creates a competitive environment where established multinational corporations compete with regional brands for market share. Local companies focus on specific consumer segments by offering products tailored to regional tastes and preferences. The market's competitive dynamics are characterized by localized product development, distribution strategies, and marketing approaches to effectively serve diverse consumer needs across different Asia-Pacific regions.
White-space opportunities emerge in sustainable protein sources and functional ingredient integration, where companies like Ajinomoto leverage microbial protein technology through Solein partnerships to create premium positioning in Singapore's novel food approval framework. Manufacturing capacity expansion signals long-term commitment, with Sirio Pharma investing USD 40 million in Thailand's first Asian facility outside China, targeting Southeast Asian nutraceutical market growth through localized production capabilities.
Emerging companies are focusing on sustainability practices, such as eco-friendly packaging and reduced carbon emissions in their production processes. They are also establishing direct-to-consumer sales channels through e-commerce platforms and dedicated online stores. Meanwhile, established companies are strengthening their market positions by acquiring smaller competitors, expanding their product portfolios, and increasing their distribution networks.
Asia-Pacific Meal Replacement Products Industry Leaders
-
Glanbia PLC
-
Nestlé SA
-
Amway Corp.
-
Abbott Laboratories
-
Herbalife Nutrition
- *Disclaimer: Major Players sorted in no particular order
Asia-Pacific Meal Replacement Products Market Companies Covered in this Report
- Abbott Laboratories
- Herbalife Nutrition
- Amway Corp.
- Nestlé SA
- Danone SA
- Glanbia PLC
- Huel Ltd
- Soylent Nutrition Inc.
- Formulite Pty Ltd
- Bulk Nutrients
- Ka'Chava (Tribal Nutrition)
- WonderLab
- Sustyfoods Group
- SlimFast (GlaxoSmithKline)
- Otsuka Pharmaceutical (Musashi)
- Orgain Inc.
- Saturo Foods GmbH
- Happy Viking
- HLTH Code
- Upnourish (Bright Lifecare)
Read Analysis of Asia-Pacific Meal Replacement Products Companies
Market Opportunities and Future Outlook
Opportunities are growing at the intersection of weight management, performance nutrition, and nutrition positioning that sits close to clinically adjacent formats, where product design can bridge mainstream meal replacements and more regulated medical nutrition. In India, the May 2026 launch of Celevida GLP+ by the Nestle Health Science and Dr. Reddy's joint venture shows commercialization of nutrition products tailored to consumers on GLP-1/GIP therapies. It also supports the case for meal replacement and high-protein formats positioned around muscle preservation and structured nutrition routines.
A second opportunity is supply chain localization and scale-up for ready-to-consume and functional formats, which supports faster innovation and more consistent availability across channels in the region. Abbott's move tied to the Pokeno manufacturing site in New Zealand and Glanbia's disclosed Asia capacity expansion activity in its Health and Nutrition division (Q1 2026) point to continued investment in regional manufacturing and ingredient capabilities. With powdered products remaining the largest format by share (43.72% in 2025) and RTD products identified as the fastest-growing format in the report segmentation, companies that combine localized production with protein-forward formulations and clearer labeling can compete across both modern retail and digital-first routes to market.
Recent Industry Developments in Asia-Pacific Meal Replacement Products Market
- June 2026: Nestlé S.A. acquires the remaining stake in yfood Labs to achieve full ownership. The move strengthens Nestlé's control over a rapidly growing ready-to-consume nutrition platform and expands presence in the Asia-Pacific/European smart-food space.
- May 2026: Nestlé Health Science Ltd. & Dr. Reddy's Laboratories Ltd. launched Celevida GLP+ for individuals on GLP-1/GIP therapies in India. The collaboration aligns with weight-management pharmacotherapy trends and broadens medical-nutrition offerings in a high-growth segment.
- April 2026: Glanbia PLC capacity expansions for Health and Nutrition division in Asia, Europe, and the US. The expansion strengthens supply security and supports regional demand for nutrition products amid high growth.
Asia-Pacific Meal Replacement Products Market Report Scope and Research Methodology
Market Definition and Coverage
This market covers packaged products positioned as a meal substitute for consumers in Asia-Pacific, sold as ready-to-drink beverages, powders, or bars, and used for weight management, convenience, or nutrition support.
Scope exclusions: We exclude vitamins, sports supplements that are not promoted as a meal substitute, and medically prescribed enteral nutrition.
Segments Covered in This Report
- By Product Type
- Powdered Products
- Ready-to-Drink Products
- Nutritional Bars
- Soups
- Other Product Types
- By Packaging Format
- Bottles/Jars
- Pouches
- Tetra Packs and Cartons
- Others
- By Nature
- Conventional
- Organic
- By Distribution Channel
- Supermarkets/Hypermarkets
- Convenience Stores
- Specialty Stores
- Online Retail Stores
- Other Channels
- By Country
- China
- India
- Japan
- Australia
- Indonesia
- South Korea
- Thailand
- Singapore
- Rest of Asia-Pacific
Data Sources, Market Sizing, and Validation
Desk Research
Desk work starts by clarifying what qualifies as a meal replacement on pack, then mapping how products move through retail and online routes across APAC. To keep assumptions anchored, we lean on public statistics and regulatory references such as FAOSTAT, UN Comtrade, World Bank indicators, national food-safety authorities, and labeling rules, plus trade bodies focused on functional foods and nutrition.
We also review company annual reports, investor presentations, and product announcements to understand portfolio mix and price positioning, which helps when we translate volume signals into value. In cases where public detail is thin, we use paid subscriptions for company financials and intelligence, patent databases, and shipment-level trade checks. The sources mentioned here are illustrative, and we also used other public documents and data points to validate and clarify the model.
Primary Interviews and Surveys
Primary work is used to pressure-test what we saw in desk research, especially on how brands set price ladders, how quickly online channels are gaining share, and what counts as a true meal replacement versus a snack substitute. We spoke with manufacturers, distributors, retailers, and industry specialists across major APAC markets, then re-checked key assumptions with functional and category leaders before finalizing the view.
Distribution of primary research fieldwork respondents
| Company type | Respondent position |
|---|---|
| Top tier: 39% | CXOs: 13% |
| Mid tier: 41% | Functional/Unit leaders: 41% |
| Smaller Players: 20% | Managers: 46% |
Market-Sizing & Forecasting
The sizing starts from a top-down build where the regional demand pool is reconstructed using consumption patterns for nutrition and functional food categories, trade direction checks, and channel expansion signals, then narrowed to products marketed as meal substitutes. Once that pool is set, we corroborate totals using selective bottom-up checks, such as sampled SKU price points across modern trade and e-commerce, plus manufacturer and distributor channel splits shared in interviews.
Key inputs used in the model include average selling price movement by format (RTD, powder, bar), the mix shift between offline retail and online, frequency of use for weight management versus convenience users, country-level income and urbanization indicators, and observed pack-size trends that affect price per serving. For forecasting, scenario analysis is applied so that a base case can be adjusted for faster e-commerce adoption, pricing inflation, or slower category trial rates, with those ranges reviewed by interviewees. Where direct data is missing in smaller APAC markets, ratios are bridged from comparable countries using retail maturity and import reliance, then re-checked through expert feedback.
Data Validation & Update Cycle
Outputs are cross-checked against independent signals such as category growth commentary in public filings, trade flow direction, and visible price bands in key channels. When large variances show up by country or format, assumptions are revisited, and where needed we re-contact respondents to confirm whether the shift is real or a data gap.
Before sign-off, the model goes through a multi-step review where calculations, currency handling, and year-to-year movements are checked for consistency. Reports are refreshed annually, and interim updates are made when material events occur, such as major regulatory changes or notable pricing resets. Right before delivery, an analyst performs a fresh pass so clients receive the latest updated view.
Mordor Intelligence's Asia Pacific Meal Replacement Products Market Size Versus Other Published Estimates
Published market sizes for meal replacements in APAC can look far apart because the category line is not always drawn the same way, and pricing assumptions can be handled differently across formats. Differences also come from which channels are counted, what year is treated as the base, and how currency conversion is timed.
A common gap driver is scope, where some estimates fold in broader weight management items, diet snacks, or medical nutrition, which can inflate totals versus a strict meal substitute definition. Another driver is the way value is built, since some models apply a single regional price curve even though RTD, powders, and bars have very different price-per-serving paths and promotion intensity by country.
Benchmark comparison
| Source | Market Size | Gaps in Research Methodology |
|---|---|---|
| Mordor Intelligence | USD 6.32 B (2025) | |
| Regional Consultancy A | USD 8.90 B (2024) | Uses a wider basket that can include diet foods and adjacent weight management products, and it also anchors on an earlier year where post-pandemic demand spikes can overstate steady-state consumption. |
| Trade Journal B | USD 5.40 B (2025) | Relies heavily on tracked retail and modern trade sales, which can undercount fast-growing e-commerce and cross-border online purchases that matter for this category in several APAC markets. |
The spread mainly traces back to what is counted as a meal replacement and how channel coverage is treated, which then changes the price and volume math country by country. By separating meal substitutes from adjacent diet and medical categories and re-checking online share assumptions in updates, the estimate stays more traceable to repeatable inputs, a modeling choice applied by Mordor Intelligence.
Key Questions Answered in the Report
What is the current value of the Asia-Pacific meal replacement products market?
It is USD 6.88 billion in 2026 and is forecast to reach USD 10.52 billion by 2031
Which product type is expanding fastest?
Ready-to-drink formats are set to post a 10.43% CAGR through 2031, making them the quickest-growing category.
Which country leads sales?
China held 37.92% of 2025 regional sales, giving it clear leadership.
Why are pouches gaining popularity?
They cut packaging weight, improve portability, and align with regional waste-reduction policies.