
Market Overview
| Study Period | 2020 - 2031 |
|---|---|
| Forecast Data Period | 2026 - 2031 |
| Base Year Market Size (2025) | USD 262.48 Billion |
| Market Size (2026) | USD 268.21 Billion |
| Market Size (2031) | USD 298.62 Billion |
| Growth Rate (2026 - 2031) | 2.18 % |
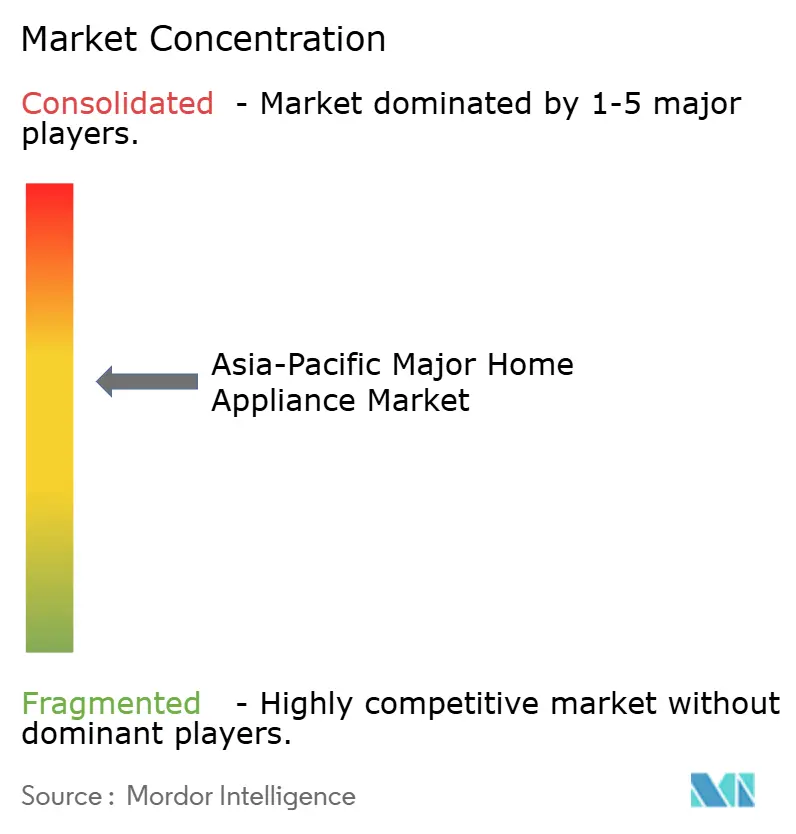
| Market Concentration | Medium |
Major Players *Disclaimer: Major Players sorted in no particular order Image © Mordor Intelligence. Reuse requires attribution under CC BY 4.0. | |
Asia-Pacific Major Home Appliance Market Analysis by Mordor Intelligence
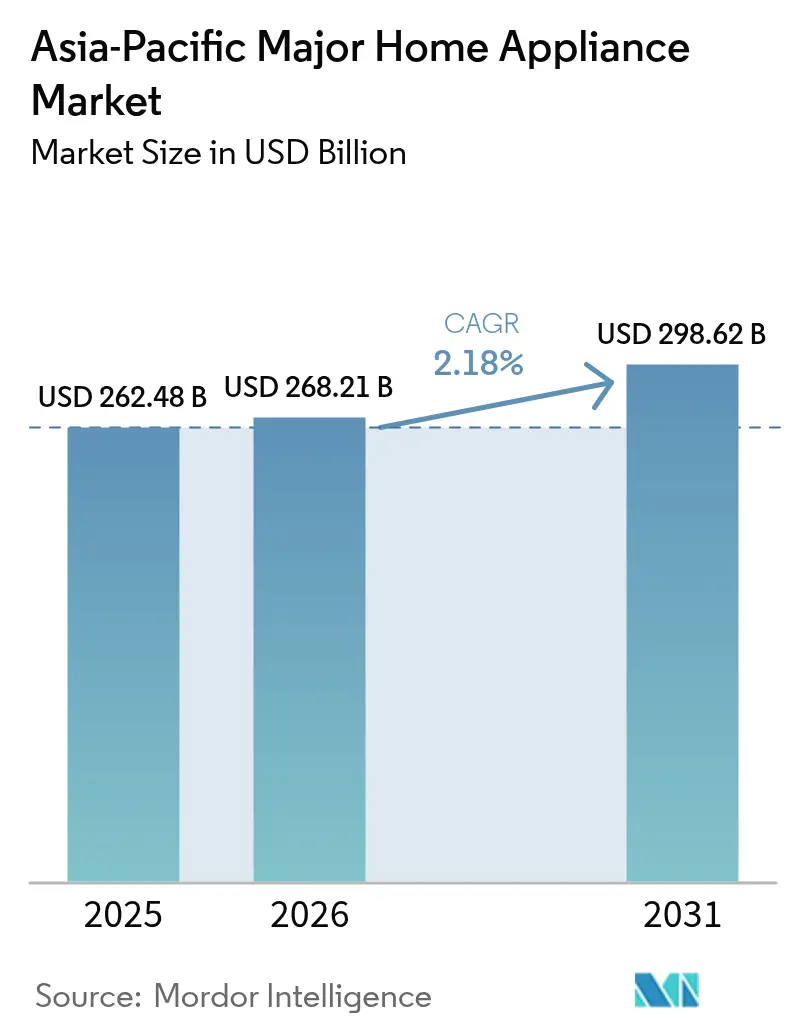
The Asia-Pacific major home appliance market size is expected to grow from USD 262.48 billion in 2025 to USD 268.21 billion in 2026 and is forecast to reach USD 298.62 billion by 2031 at 2.18% CAGR over 2026-2031. The shift from volume-led expansion toward value-oriented premiumization shapes this trajectory as producers embed smart connectivity, AI, and energy-saving technologies into core product lines while navigating competitive pressure from Chinese OEMs and dynamic consumer preferences across diverse economies [1]. In mature markets such as Japan and South Korea, replacement demand for high-end SKUs dominates, whereas first-time purchases anchored in rising disposable incomes and rapid urbanization propel growth in Indonesia, Vietnam, and the Philippines. Government trade-in subsidies, buy-now-pay-later (BNPL) schemes, and expanding last-mile logistics collectively protect baseline demand despite raw-material cost volatility. Strategic moves by leading manufacturers include cross-border localization of production to sidestep tariffs and shorten lead times, as well as ecosystem partnerships that integrate appliances with home-energy management platforms.
Key Report Takeaways
- By product type, refrigerators led with 26.98% of Asia-Pacific major home appliance market share in 2025, while smart refrigerators posted the fastest 14.75% CAGR through 2031.
- By distribution channel, specialty stores captured 36.12% of Asia-Pacific major home appliance market share in 2025; e-commerce recorded the strongest 18.92% CAGR through 2031.
- By technology, smart connected appliances accounted for a 32.85% share of the Asia-Pacific major home appliance market size in 2025 and are advancing at a 15.11% CAGR through 2031.
- By geography, China commanded 43.02% share of the Asia-Pacific major home appliance market in 2025, whereas Southeast Asia is projected to expand at a 15.82% CAGR to 2031.
Note: Market size and forecast figures in this report are generated using Mordor Intelligence’s proprietary estimation framework, updated with the latest available data and insights as of 2026.
Market Trends and Insights
Drivers Impact Analysis of Asia-Pacific Major Home Appliance Market*
| Driver | (~) % Impact on CAGR Forecast | Geographic Relevance | Impact Timeline |
|---|---|---|---|
| Rising disposable income & rapid urbanisation | +1.2% | APAC core, spill-over to MEA | Medium term (2-4 years) |
| Explosive growth of e-commerce & last-mile logistics | +0.8% | Global, strongest in ASEAN | Short term (≤ 2 years) |
| Mandatory energy-efficiency rebate & trade-in schemes | +0.6% | China, India, Singapore | Short term (≤ 2 years) |
| Cross-border localisation of Chinese OEM manufacturing | +0.4% | ASEAN, India, Mexico | Medium term (2-4 years) |
| BNPL & embedded-finance-powered affordability | +0.3% | Southeast Asia, India | Short term (≤ 2 years) |
| Uptake of premium built-in / modular kitchen concepts | +0.2% | Urban China, India, Thailand | Long term (≥ 4 years) |
| Source: Mordor Intelligence | |||
Rising Disposable Income & Rapid Urbanisation
Middle-income households across Indonesia and Vietnam grew sharply in 2024 and are projected to exceed 415 million by 2030, driving first-time appliance purchases and accelerating replacement cycles. Urban migration concentrates demand in tier-2 cities where real-estate developers bundle built-in kitchens with residential projects, spurring multi-appliance adoption. Retailers leverage BNPL platforms to convert latent demand into sales by lowering upfront price barriers. Correlation between urbanization velocity and appliance penetration remains strongest in cities where infrastructure outpaces income, creating near-term surges once credit access improves. For manufacturers, aligning product portfolios with aspirational yet affordable SKUs helps balance volume and margin goals.
Explosive Growth of E-Commerce & Last-Mile Logistics
Enhanced logistics networks and omnichannel strategies pushed digital transactions to a 19.84% CAGR for the Asia-Pacific major home appliance market. Regional platforms introduced augmented-reality showrooms that reduce the need for physical touchpoints in high-consideration categories like refrigerators and washers. Cross-border marketplaces allow Chinese brands to reach underserved rural customers, but aggressive discounting compresses margins. Partnerships with third-party logistics players shorten delivery windows to under 48 hours in key ASEAN metro areas, strengthening consumer confidence. Integrated after-sales services and instant refunds further narrow the experiential gap with brick-and-mortar outlets.
Mandatory Energy-Efficiency Rebate & Trade-In Schemes
China’s national trade-in subsidies lifted large-appliance retail sales by 24.8% year-over-year in Q4 2024 [2]. Singapore’s tighter energy labeling rules raised minimum standards, prompting a shift to inverter compressors and heat-pump dryers. These programs induce demand spikes that compel manufacturers to refine production planning and inventory allocation. Retailers synchronize promotional calendars with subsidy windows to maximize sell-through, though sudden surges challenge logistics capacity. Over time, stricter efficiency norms elevate average selling prices and catalyze product innovation.
BNPL & Embedded-Finance-Powered Affordability
Fintech partnerships with banks like ACLEDA in Cambodia democratize appliance ownership by converting lump-sum purchases into micro-installments, expanding addressable markets among Gen-Z and rural customers [3]. Embedded finance at the point of sale reduces friction, raising acceptance rates even for premium SKUs. Manufacturers gain data-driven insights into repayment behavior, enabling tailored marketing and upsell opportunities. While credit risk requires vigilant monitoring, early evidence suggests default rates remain within acceptable limits due to strong employer-linked deductions and digital KYC protocols.
Restraints Impact Analysis of Asia-Pacific Major Home Appliance Market*
| Restraint | (~) % Impact on CAGR Forecast | Geographic Relevance | Impact Timeline |
|---|---|---|---|
| Volatile raw-material & freight costs | -0.9% | Global, acute in import-dependent markets | Short term (≤ 2 years) |
| Margin pressure from low-cost regional OEMs | -0.7% | ASEAN core, India | Medium term (2-4 years) |
| Grid-instability & high tariffs curbing energy-hungry SKUs | -0.4% | India, Indonesia, Philippines | Long term (≥ 4 years) |
| Remote-area logistics & reverse-logistics costs | -0.3% | Rural ASEAN, India tier-3 cities | Medium term (2-4 years) |
| Source: Mordor Intelligence | |||
Volatile Raw-Material & Freight Costs
Steel and copper price volatility compressed manufacturer margins throughout 2024, with galvanized sheet demand from home appliances experiencing mixed performance despite overall production growth exceeding 10%. Raw material cost inflation forces manufacturers to implement dynamic pricing strategies, though consumer price sensitivity limits pass-through effectiveness in competitive segments. Supply chain disruptions from geopolitical tensions and port congestion create inventory management challenges, particularly for companies operating just-in-time production models across multiple geographic markets.
Margin Pressure from Low-Cost Regional OEMs
Aggressive pricing from ASEAN-based manufacturers intensifies competitive pressure in commodity appliance segments, forcing established players to accelerate premium product development and service differentiation strategies. Korean manufacturers like Panasonic adopted private-label production for retailers to maintain volume while preserving brand positioning. This margin compression accelerates industry consolidation as smaller players struggle to maintain profitability amid rising marketing and R&D investment requirements for smart appliance development.
*Our forecasts treat driver/restraint impacts as directional, not additive. The impact forecasts reflect baseline growth, mix effects, and variable interactions.
Asia-Pacific Major Home Appliance Market Segment Analysis
By Product Type:
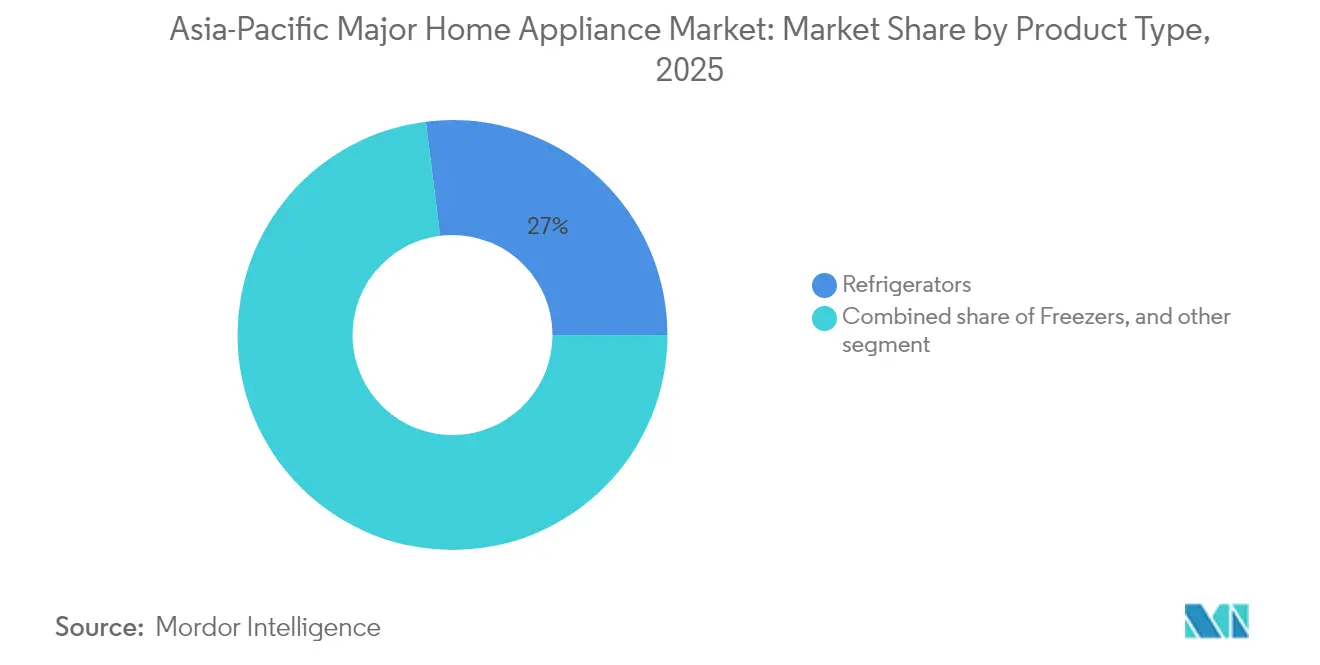
Refrigerators Drive Smart IntegrationRefrigerators captured 26.98 of % Asia-Pacific major home appliance market share in 2025 and continue to anchor connected-home ecosystems through embedded sensors, cameras, and AI-driven food management software. The premium smart-refrigerator segment is forecast to deliver a 14.75% CAGR, reinforcing the Asia-Pacific major home appliance market trajectory toward higher ASPs. Washing machines held an 17.82% stake as inverter motors and water-saving cycles resonate with urban dwellers. Air conditioners contributed 15.34%, benefiting from rising heat-wave frequency but tempered by energy-tariff sensitivities. Dishwashers and freezers remain niche yet are gaining acceptance in high-density urban apartments as lifestyles evolve.
The convergence of IoT with refrigeration repositions the appliance as a household command center capable of choreographing other devices via voice assistants or smartphone apps. Manufacturers deploy predictive maintenance analytics that flag compressor issues before failures, curbing service costs. Built-in French-door models integrated into modular kitchens enlarge design-driven appeal, while compact top-mount units meet small-space constraints. Competitive intensity is elevated, yet differentiated software ecosystems and proprietary AI algorithms help preserve margins for market leaders.

By Distribution Channel:
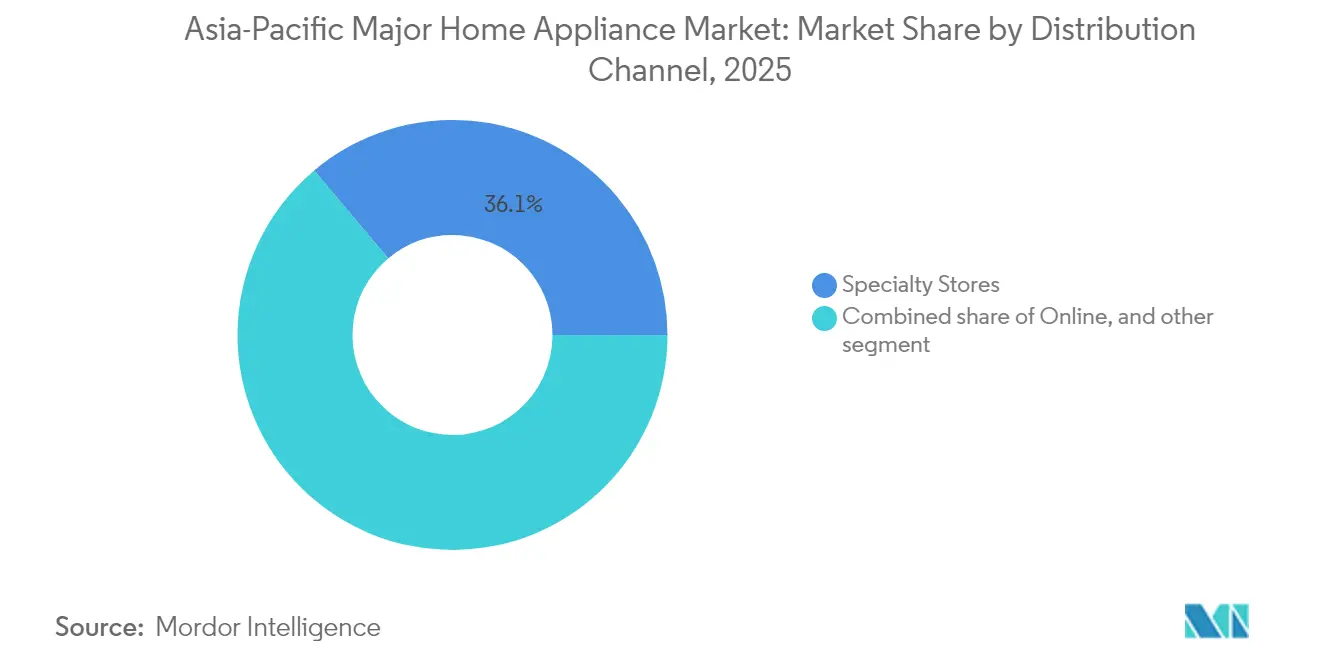
E-Commerce Disrupts Traditional RetailSpecialty stores accounted for a 36.12% share, leveraging hands-on demonstrations and bundled installation to maintain relevance. E-commerce, however, is set to outpace all channels at a 18.92% CAGR, powered by same-day delivery promises and wide product assortments. Multi-brand retailers command 29.18% of the Asia-Pacific major home appliance market, relying on comparative shopping formats and value-added services. Exclusive brand outlets claimed 28.07% through curated customer experiences and loyalty programs.
South Korea’s rental model illustrates channel innovation: the aggregate rental services sector is projected to hit KRW 100 trillion (USD 75.3 billion) by 2025, with 34.5% of large-appliance shoppers opting for subscriptions. Direct-to-consumer portals backed by OEMs use live-stream selling and AR visualization to replicate in-store engagement online. The Asia-Pacific major home appliance market size for online channels is poised to rise further as payment gateways mature and reverse-logistics efficiencies improve.
By Technology:
Smart Connectivity Accelerates AdoptionSmart connected appliances held a 32.85% share in 2025 and are expected to expand at a 15.11% CAGR through 2031, well above the broader Asia-Pacific major home appliance market CAGR. These devices sync with AI hubs such as LG ThinQ ON to learn usage patterns and coordinate operations, enabling up to 23% energy savings according to field trials. Conventional appliances, retaining a 67.15% share, remain favored for entry-level price points and perceived reliability. However, commoditization of Wi-Fi modules and voice control is eroding the price gap, encouraging faster mid-tier diffusion.
Energy-efficient technologies comprise 38% of total units sold, aided by government rebates. Inverter compressors, heat-pump dryers, and R-32 refrigerants are becoming baseline specs. Early adopters of predictive-maintenance algorithms unlock subscription service revenues and extend product lifecycles by dispatching technicians preemptively. Data privacy regulation compliance emerges as a differentiator as governments scrutinize cross-border data flows from connected devices.
Geography Analysis
APAC Major Home Appliance Market
China retained a 43.02% of the Asia-Pacific major home appliance market share in 2025, underpinned by domestic brand dominance and integrated supply chains, yet saturation is slowing unit growth. The Asia-Pacific major home appliance market size in China is moving toward replacement-driven cycles, emphasizing smart upgrades and high-efficiency SKUs. Southeast Asia, propelled by urbanization and youthful demographics, is the fastest-growing sub-region at a forecast 15.82% CAGR. India followed with a 15.42% share in 2025, benefitting from production incentives and a widening middle-class, while Japan sustained a 14.05% slice despite an aging population through premiumization and frequent replacement.
ASEAN and Australia Major Home Appliance Market
Australia and South Korea contribute smaller proportions but demonstrate high per-capita spend and advanced adoption of connected-home ecosystems. Retail expansion by groups such as Harvey Norman signals confidence in Southeast Asia’s long-run demand. Meanwhile, Chinese OEMs are leveraging ASEAN production bases to secure tariff-free access to the Regional Comprehensive Economic Partnership (RCEP) bloc, shortening delivery cycles and tailoring products to tropical climates.
India Major Home Appliance Market
India features a dichotomy of price-sensitive rural customers and premium-oriented urban consumers. LG planned an INR 5,000 crore (USD 600–610 million) manufacturing complex in Andhra Pradesh to tap local sourcing incentives. Urban smart-energy platforms that integrate solar rooftops and time-of-use tariffs catalyze the adoption of AI-enabled appliances capable of dynamic load shifting. However, intermittent grid quality and high GST rates on large appliances constrain penetration in lower-income segments, sustaining latent demand for future conversion.
Regulatory Landscape
Energy-efficiency regulation is tightening across Asia-Pacific, with multiple jurisdictions updating Mandatory Energy Labelling Scheme (MELS) and Minimum Energy Performance Standards (MEPS) frameworks that affect appliance design, certification, and go-to-market timing. In China, GB 12021.2-2025 for household refrigerating appliances took effect on 1 June 2026, raising the bar on maximum allowable energy consumption values and efficiency grades. Singapore has also continued to raise compliance requirements under the Energy Conservation Act, including updated MEPS/MELS enforcement for key categories from April 2025, with a grace period for existing stock ending 31 March 2026.
Several ASEAN markets are formalizing MEPS and labeling implementation roadmaps, increasing compliance workload for OEMs and importers. Malaysia brought the Energy Efficiency and Conservation Act 2024 (Act 861) into operation on 1 January 2025, supported by regulator-issued guidelines that set minimum MEPS ratings (including a 2-star minimum) for multiple energy-using product categories such as air-conditioners and refrigerators. Vietnam implemented Circular 52/2025/TT-BCT effective 1 January 2026, covering the equipment list subject to energy labeling and setting a transition path where certain categories move from voluntary to mandatory labeling from 1 January 2027, reinforcing the need for region-specific certification and SKU planning.
Value Chain Analysis
The Asia-Pacific major home appliance value chain is anchored by component sourcing (compressors, motors, electronic control boards, sensors, plastics, and sheet metal), followed by assembly in large regional manufacturing clusters, then distribution via omnichannel retail, installation, and after-sales service networks. China remains the largest integrated manufacturing base with dense supplier ecosystems and established production clusters, while Southeast Asia is increasingly used for regionalized production footprints that reduce lead times and improve tariff resilience, consistent with cross-border localization by Chinese OEMs.
Downstream, the chain is being reshaped by the expansion of e-commerce and last-mile delivery, which increases the importance of packaging design, reverse logistics, and installation and service partner coverage for bulky categories such as refrigerators and washing machines. At the same time, smart connected appliances increase the value share of software and connectivity modules and elevate dependency on semiconductors and IoT components, where lead times can constrain availability during peak seasons. Competitive pressure from low-cost regional OEMs and rapid premiumization supports dual-track portfolios, with entry-level models optimized for cost and scale and premium SKUs differentiated through energy efficiency, connectivity, and service bundles.
Competitive Landscape
The Asia-Pacific major home appliance market is becoming moderately concentrated as leading brands strengthen their positions through innovation and regional strategies. Haier Smart Home is expanding its presence with a multi-brand approach, including premium lines like CASARTE, supported by a global R&D network. Midea Group has prioritized international expansion, establishing Thailand as a key production hub outside China. LG Electronics continues to build consumer lock-in through its ThinQ AI platform, seamlessly connecting HVAC, kitchen, and laundry appliances. Meanwhile, Samsung emphasizes product design and has expanded its heat-pump dryer offerings to suit various Asian climates, while Panasonic focuses on energy efficiency and product reliability, integrating appliances with home energy storage systems.
Strategic approaches vary by country, with Chinese manufacturers focusing on geographic diversification to mitigate trade risks, Korean firms deepening their AI and software capabilities, and Japanese companies highlighting energy efficiency and high-quality after-sales support. Subscription-based appliance services, which gained popularity in South Korea, are spreading across Southeast Asia, offering recurring revenue opportunities and deeper customer relationships. There is also growing interest in retrofit smart modules that enable basic connectivity in older appliances, catering to price-sensitive consumers. In markets like Japan and South Korea, aging populations are driving demand for user-friendly appliances such as microwaves and washer-dryers with ergonomic designs. These trends are shaping both product development and go-to-market strategies across the region.
The competition is intensifying as companies ramp up patent filings related to AI and sensor technologies. Many manufacturers are collaborating with semiconductor firms to co-develop components that improve energy efficiency and enhance data security. Sustainability is also becoming a key purchasing factor, particularly among institutional buyers, prompting brands to use recycled materials and adopt low-emission logistics solutions. As a result, competitive advantage is shifting beyond pricing to include system integration, responsive service networks, and environmental performance. The future of the market will be shaped by how effectively brands align technological innovation with evolving consumer and regulatory expectations.
Asia-Pacific Major Home Appliance Industry Leaders
-
Haier Smart Home
-
Midea Group
-
LG Electronics
-
Samsung Electronics
-
Panasonic Corporation
- *Disclaimer: Major Players sorted in no particular order
Asia-Pacific Major Home Appliance Market Companies Covered in this Report
- Haier Smart Home
- Midea Group
- Samsung Electronics
- LG Electronics
- Panasonic Corp.
- Whirlpool Corp.
- BSH Hausgeräte (Bosch/Siemens)
- Electrolux AB
- Hisense Home Appliances
- Sharp Corp.
- Hitachi Global Life Solutions
- Toshiba Lifestyle
- Gree Electric Appliances
- Godrej Appliances
- IFB Industries
- TCL Technology
- Arçelik (Beko)
- Fujitsu General
- Videocon Industries
- Skyworth
Read Analysis of Asia-Pacific Major Home Appliance Companies
Market Opportunities and Future Outlook
Policy-backed replacement demand and efficiency upgrades remain a clear area of opportunity for manufacturers that can align product roadmaps with country-specific MEPS, labeling, and trade-in programs. China renewed its consumer goods trade-in program in January 2026 with RMB 62.5 billion in subsidies for energy-efficient appliances, reinforcing near-term demand for compliant, higher-efficiency SKUs across core major categories. In parallel, tighter efficiency and labeling regimes across markets such as Singapore, Malaysia, Vietnam, Japan (METI Top Runner), and India (BEE) increase the premium mix opportunity for inverter-driven, heat-pump, and low-GWP refrigerant product lines that meet evolving thresholds.
Manufacturing localization and capacity additions across Southeast Asia and India also create scope to shorten replenishment cycles, reduce landed costs, and tailor products to local climates and usage patterns. A concrete example is Midea Electronics Indonesia opening a refrigerator manufacturing plant in Karawang in May 2026 with annual capacity exceeding 2 million units, supporting local-for-local supply and regional exports. On the connected-appliance side, ecosystem and AI capabilities are becoming a more measurable differentiator as brands move beyond hardware toward proactive service, diagnostics, and subscription offerings. Haier’s Home Brain White Paper (2026), disclosed via an April 2026 HKEX filing, signals continued investment into spatial intelligence and connected-home paradigms that can support service-led monetization and higher ASP strategies across mature and emerging Asia-Pacific markets.
Recent Industry Developments in Asia-Pacific Major Home Appliance Market
- May 2026: Midea Electronics Indonesia officially opened a new refrigerator manufacturing plant in Karawang, Indonesia, with annual capacity exceeding 2 million units. The facility strengthens local-for-local supply in Southeast Asia and supports faster fulfillment as e-commerce and modern retail expand bulky-appliance volumes. It also deepens Midea's manufacturing footprint outside China, aligning production with regional demand centers and trade considerations.
- April 2026: LG Electronics hosted LG InnoFest 2026 APAC in Busan, South Korea, showcasing AI-connected appliances and outlining region-specific subscription service approaches. The event highlighted the shift from one-time appliance sales toward lifecycle services, with offerings tailored to Asia-Pacific channel dynamics. It also reinforced the competitive focus on ecosystem integration as smart connected appliances become a larger share of category demand.
- November 2024: Samsung and LG introduced premium all-in-one washer-dryer products in South Korea, including LG's Signature model and Samsung's Bespoke AI Combo featuring heat-pump drying technology. These launches highlighted continued premiumization in mature Northeast Asian markets where replacement demand dominates. They also intensified competitive benchmarking around energy-saving drying performance and AI-driven convenience features in laundry appliances.
Asia-Pacific Major Home Appliance Market Report Scope and Research Methodology
Market Definition and Coverage
For this study, the market covers sales of major home appliances across Asia Pacific, counted as the value of appliances sold to end users through offline and online channels within the region.
Scope exclusions: We exclude small kitchen appliances, personal care appliances, parts and consumables, and repair and installation services.
Segments Covered in This Report
- By Product Type
- Refrigerators
- Freezers
- Dishwashing Machines
- Washing Machines
- Ovens
- Air Conditioners
- Other Major Products (Electric Hobs, Ranges, etc.)
- By Distribution Channel
- Multi-Brand Stores
- Exclusive Brand Outlets
- Online
- Other Distribution Channels
- By Technology
- Smart Connected Major Appliances
- Conventional Major Appliances
- By Geography
- India
- China
- Japan
- Australia
- South Korea
- South-East Asia (Singapore, Malaysia, Thailand, Indonesia, Vietnam, Philippines)
- Rest of Asia-Pacific
Data Sources, Market Sizing, and Validation
Desk Research
Desk research sets the boundaries and gives us the starting pool for demand and supply signals. We mainly referred to public statistical and policy sources that help explain household formation, appliance penetration, and trade flows in Asia Pacific. This included national statistics offices and census releases in key countries, UN Comtrade for import and export patterns, World Bank macro indicators, and energy efficiency policy sources such as the International Energy Agency.
To translate these signals into a working market model, we also used company annual reports, investor presentations, and reputable press coverage to understand product mix shifts and pricing direction. In a few places, we used paid company financials and intelligence subscription sources, and an import and export shipment-level database to speed up cross-checks on revenue splits and trade direction, before assumptions were finalized. The desk sources listed here are illustrative, and we also reviewed other public datasets and documents to validate and clarify gaps.
Primary Interviews and Surveys
Primary work was used to pressure-test what desk sources could not confirm cleanly, especially pricing moves, channel mix, and how demand differs between mature and emerging markets in the region. We spoke with manufacturers, distributors, large-format retailers, e-commerce focused sellers, and service ecosystem participants, and then rechecked assumptions with independent industry experts across key Asia Pacific countries. When responses conflicted, we returned to a small set of contacts to close gaps and align on realistic ranges.
Distribution of primary research fieldwork respondents
| Company type | Respondent position |
|---|---|
| Top tier: 25% | CXOs: 14% |
| Mid tier: 58% | Functional/Unit leaders: 31% |
| Smaller Players: 17% | Managers: 55% |
Market-Sizing & Forecasting
Sizing starts with a top-down build where production and trade signals, along with household and housing indicators, are used to reconstruct the addressable sales pool for major home appliances in Asia Pacific. We then form country totals by applying realistic ownership and replacement patterns, followed by a check on whether observed import and local manufacturing dynamics support the implied supply.
In parallel, we ran selective bottom-up approximations to keep totals grounded. These checks used sampled company revenue splits, channel checks from retailers and distributors, and an ASP x volume sanity test for a few anchor categories. Where the gap was explainable, we adjusted the model. Key inputs used as fingerprints (illustrative) included appliance penetration and replacement timing, urban household additions, online versus offline channel share, import intensity for major appliances, and inflation-led ASP movement.
For forecasting, we used scenario analysis with a base case guided by what interviewees expect for demand normalization and pricing over the next few years. Growth paths were shaped by country macro outlook, housing starts and completions, and the pace of energy-efficiency upgrades, and then rolled up to the regional forecast. Where bottom-up inputs were missing, we used conservative ranges and only expanded them when multiple primary responses supported the same direction.
Data Validation & Update Cycle
Validation is done through a set of cross-checks that look for mismatches between the model and independent signals. Outputs are compared against trade direction, macro consumption trends, and category-level demand cues, and any unusual swings are reviewed until the driver is clear.
Before sign-off, the dataset and calculations go through a multi-step analyst review so that assumptions, units, and currency handling are consistent across countries. The report is refreshed annually, and interim updates are made if material events shift demand, pricing, or supply availability. Right before delivery, we complete a fresh analyst pass so clients receive the latest updated view.
Mordor Intelligence's Asia Pacific Home Appliance Market Size Compared Against Other Published Estimates
Published market numbers for home appliances in Asia Pacific can look different because firms do not always count the same product set, geography, or pricing basis, and they also update their inputs on different schedules. Even when the same region is named, the mix of categories included, the use of retail value versus shipment value, and how currencies are converted can move the final number.
The benchmark table shows a spread that is mainly explained by scope and value-capture choices. In Mordor Intelligence's model, the total reflects major home appliances sold in Asia Pacific, and adjacent categories like small appliances and service revenues are not added, which can pull the value down versus broader consumer appliance definitions.
Benchmark comparison
| Source | Market Size | Gaps in Research Methodology |
|---|---|---|
| Mordor Intelligence | USD 262.48 B (2025) | |
| Industry Report A | USD 256.00 B (2024) | Uses a different base year and appears to mix major and selected small appliances in parts of the value, and then backfills history without showing clear currency timing assumptions. |
| Industry Publisher B | USD 348.45 B (2022) | Likely counts a wider electrical appliances basket and may include commercial demand and other adjacent categories, which inflates totals compared with major appliance-only retail value sizing. |
Taken together, the gap is less about math and more about what gets counted and how quickly assumptions are refreshed. Our approach keeps the totals traceable to clear demand signals, practical pricing logic, and repeatable country roll-ups, so users can reconcile differences when comparing figures across sources.
Key Questions Answered in the Report
How large is the Asia Pacific major home appliance market in 2026?
The market is valued at USD 268.21 billion in 2026 with a forecast CAGR of 2.18% through 2031.
Which product category holds the largest share in Asia-Pacific home appliances?
Refrigerators lead with 26.98% share, supported by rapid uptake of smart, energy-efficient models.
Which region within Asia-Pacific is expected to grow quickest for home appliances?
Southeast Asia is projected to expand at a 15.82% CAGR through 2031, driven by urbanization and rising incomes.
What is the outlook for smart connected appliances?
Smart devices already command a 32.85% share and are accelerating at a 15.11% CAGR as AI ecosystems mature across the region.
How are financing innovations influencing appliance demand?
BNPL and embedded-finance platforms lower upfront costs, broadening access among younger and rural consumers while enabling OEMs to capture service-driven revenue streams.