
Market Overview
| Study Period | 2020 - 2031 |
|---|---|
| Forecast Data Period | 2026 - 2031 |
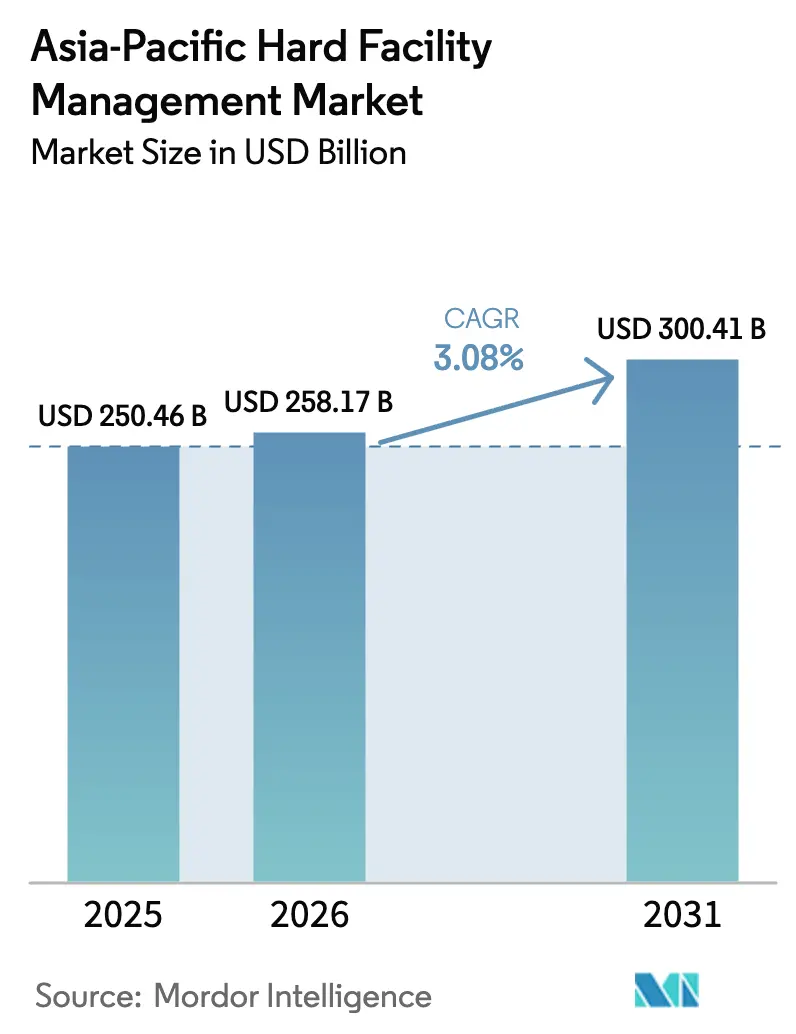
| Base Year Market Size (2025) | USD 250.46 Billion |
| Market Size (2026) | USD 258.17 Billion |
| Market Size (2031) | USD 300.41 Billion |
| Growth Rate (2026 - 2031) | 3.08 % |
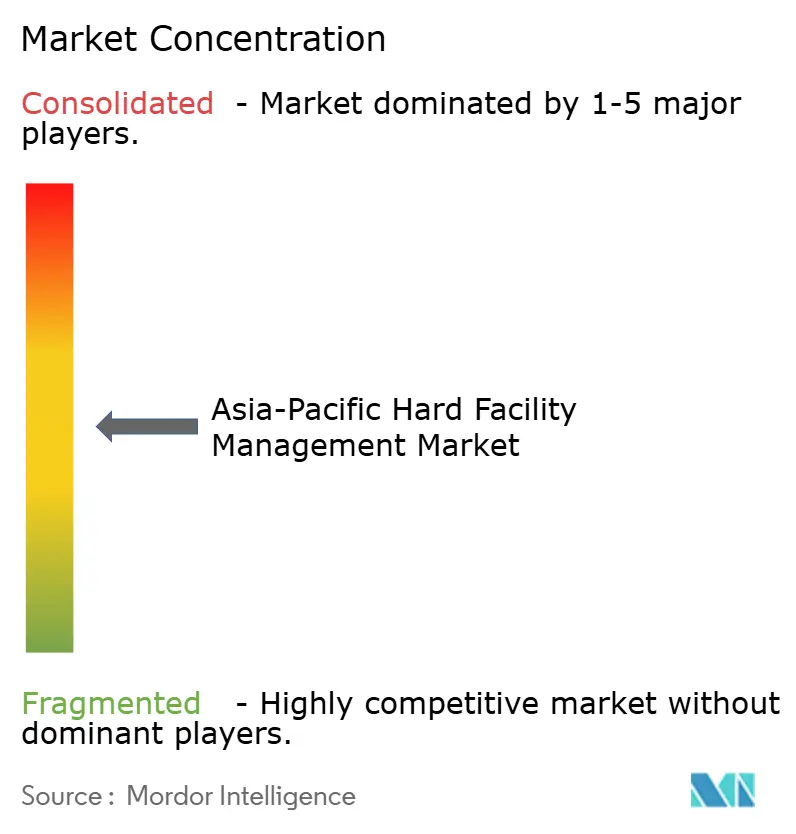
| Market Concentration | Medium |
Major Players *Disclaimer: Major Players sorted in no particular order Image © Mordor Intelligence. Reuse requires attribution under CC BY 4.0. | |
Asia-Pacific Hard Facility Management Market Analysis by Mordor Intelligence
The Asia-Pacific hard facility management market size is expected to grow from USD 250.46 billion in 2025 to USD 258.17 billion in 2026 and is forecast to reach USD 300.41 billion by 2031 at 3.08% CAGR over 2026-2031. Growth is steady rather than spectacular, yet the shift in spending priorities is clear. Budgets are tilting toward energy-management programs, data-center uptime, and microgrid oversight as multinational tenants chase net-zero targets. At the same time, legacy HVAC upkeep remains the single largest service line because tropical climates drive year-round cooling demand. A construction boom in China’s tier-2 cities and industrial corridors across Vietnam and India is widening the installed base that must be serviced, although grid-capacity delays in Singapore and Malaysia are compressing provider margins.[1]
Key Report Takeaways
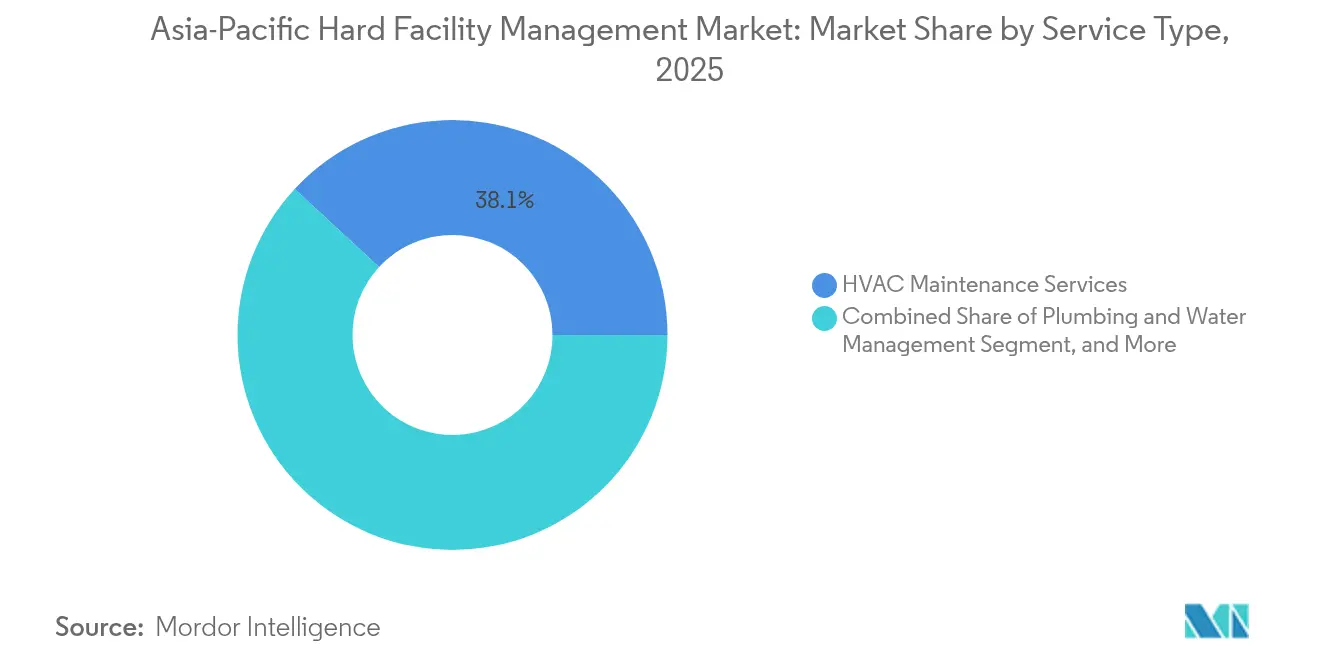
- By service type, HVAC maintenance held 38.12% of the Asia-Pacific hard facility management market share in 2025, while energy management and power systems is on course for the fastest 3.83% CAGR through 2031.
- By end user, commercial facilities led spending with 46.05% of the Asia-Pacific hard facility management market share in 2025, industrial and manufacturing is forecast to expand at a 4.18% CAGR to 2031.
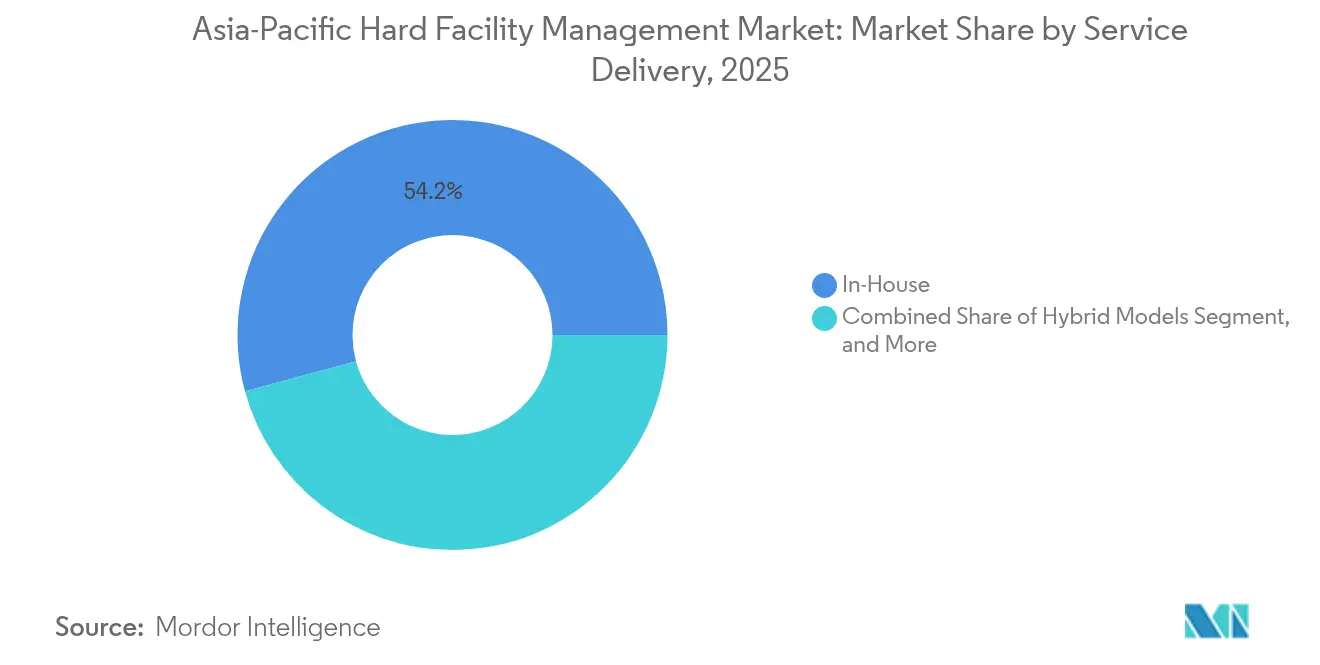
- By service-delivery model, in-house execution retained 54.21% of the Asia-Pacific hard facility management market share in 2025, whereas integrated facilities management contracts are growing at a 4.41% CAGR through 2031.
- By facility type, office and corporate campuses captured 40.02% of the Asia-Pacific hard facility management market share in 2025, yet data centers and critical environments are rising fastest at a 4.17% CAGR through 2031.
- By country, China commanded a dominant 36.35% share of the Asia-Pacific hard facility management market in 2025, whereas India is anticipated to register the fastest growth during the forecast period at a 4.32% CAGR through 2031.
Note: Market size and forecast figures in this report are generated using Mordor Intelligence’s proprietary estimation framework, updated with the latest available data and insights as of 2026.
Asia-Pacific Hard Facility Management Market Trends and Insights
Drivers Impact Analysis*
| Driver | (~) % Impact on CAGR Forecast | Geographic Relevance | Impact Timeline |
|---|---|---|---|
| Expansion of commercial and industrial construction activity | +0.8% | China, India, Vietnam, Indonesia, with spillover to Malaysia and Thailand | Medium term (2-4 years) |
| Rising demand for HVAC and MEP maintenance services | +0.7% | Tropical Asia-Pacific (Singapore, Malaysia, Indonesia, Thailand), urban China and India | Short term (≤ 2 years) |
| Outsourcing shift toward integrated FM contracts | +0.6% | Australia, Singapore, Japan, multinational-occupied facilities across Asia-Pacific | Medium term (2-4 years) |
| Energy-efficiency and green-building regulation push | +0.5% | Singapore, Hong Kong, Australia, Japan, with emerging adoption in China tier-1 cities | Long term (≥ 4 years) |
| Hyperscale data-centre build-out driving critical FM needs | +0.4% | Singapore, Japan, India, Australia, China (tier-2 cities), Indonesia (Jakarta, Batam) | Short term (≤ 2 years) |
| Corporate on-site renewable targets and micro-grid upkeep | +0.3% | Global, with early concentration in Australia, Japan, India, and Singapore | Long term (≥ 4 years) |
| Source: Mordor Intelligence | |||
Expansion of Commercial and Industrial Construction Activity
Emerging industrial corridors are reshaping the Asia-Pacific hard facility management market. Commercial square footage in China’s tier-2 cities increased 18% in 2024, and Vietnam, Indonesia, and Thailand attracted USD 42 billion of manufacturing FDI the same year.[2] Developers often bundle three-year mechanical and electrical maintenance into turnkey packages, shortening the bid cycle and favoring integrators with pre-negotiated supplier networks. Providers are opening satellite depots in Chengdu, Pune, and Hanoi so they can meet service-level agreements within four hours. The result is a geographic realignment that rewards firms with regional logistics planning and local permitting expertise. Those unable to migrate beyond legacy urban cores risk missing a wave of opportunity that could define revenue pools for the rest of the decade.
Rising Demand for HVAC and MEP Maintenance Services
HVAC upkeep remains a key driver of the Asia-Pacific hard facility management market, as tropical humidity and dense urbanization increase cooling loads. Yet demand is becoming more technical than routine. Singapore’s district-cooling systems now require continuous refrigerant-leak detection and remote telemetry, which legacy preventive schedules cannot address. Malaysia’s chiller retrofits come with energy-savings guarantees that shift risk to service vendors. IoT-enabled diagnostics are normalizing forty-eight-hour fault remediation windows, so providers must invest in analytics talent and spare-parts inventory. Without that capability, mid-tier contractors lose premium accounts to firms that can underwrite performance.
Outsourcing Shift Toward Integrated FM Contracts
A broad outsourcing cycle is underway as multinationals consolidate vendor rosters and seek real-time data. Australian corporates led the trend; double-digit IFM contract wins at JLL and CBRE in 2024 flowed from unified dashboards that merge energy, work-order, and asset-life information. Singapore’s public agencies followed by stipulating software interoperability in tender documents. Platforms like Johnson Controls OpenBlue or Siemens Desigo CC are becoming table stakes. Entrance barriers are climbing because the capital and licensing costs of digital infrastructure outstrip the resources of smaller regional players. Consolidation is therefore likely to accelerate, compressing a fragmented supplier base into a hierarchy of scale.
Energy-Efficiency and Green-Building Regulation Push
Regulators have moved from voluntary labels to mandatory performance floors. Singapore’s Minimum Energy Performance Initiative requires a 10% reduction in energy intensity by 2030, with enforcement commencing in 2024.[3] Hong Kong raised building-efficiency standards 20% the same year. Malaysia’s 2024 Energy Efficiency and Conservation Act imposes annual reporting on large facilities. Compliance requirements have lifted demand for sub-metering, façade insulation, and HVAC recommissioning. Providers with in-house energy engineers are sealing multi-site deals that span beyond five years, as landlords prefer turnkey performance contracts over piecemeal upgrades. Smaller contractors risk being relegated to low-margin subcontracting roles if they cannot verify the savings that regulators and owners now expect.
Restraints Impact Analysis*
| Restraint | (~) % Impact on CAGR Forecast | Geographic Relevance | Impact Timeline |
|---|---|---|---|
| Skilled technical-labour shortage | -0.5% | Japan, Australia, Singapore, with emerging pressure in Malaysia and Thailand | Short term (≤ 2 years) |
| Volatile energy and materials costs squeezing margins | -0.4% | Global, with acute impact in import-dependent markets (Singapore, Hong Kong, Philippines) | Short term (≤ 2 years) |
| Fragmented Asia-Pacific compliance and certification landscape | -0.2% | Region-wide, most pronounced in cross-border contract execution | Medium term (2-4 years) |
| Grid-capacity shortfalls delaying facility handovers | -0.3% | Singapore, Malaysia (Johor), India (select states), Indonesia (Java grid) | Medium term (2-4 years) |
| Source: Mordor Intelligence | |||
Skilled Technical-Labor Shortage
Labor scarcity is the most immediate brake on the Asia-Pacific hard facility management market. Singapore reported a 12% deficit of certified HVAC engineers in 2024. Australian electricians experienced 15% wage inflation, while Malaysia’s construction sector faced a 15% headcount shortfall. Large integrators responded by opening training academies; ISS targets 500 graduates a year through its newly launched Southeast Asia center. Smaller companies lack the scale to replicate that model, so staff attrition funnels talent toward higher-paying data-center posts. The skills gap raises service costs and threatens SLA compliance, pushing buyers to favor vendors with formal workforce pipelines.
Grid-Capacity Shortfalls Delaying Facility Handovers
Power infrastructure lag is rippling through project timelines. Singapore capped new data-center connections in 2024 pending substation upgrades. Malaysia’s Tenaga Nasional Berhad delayed energization of Johor industrial parks, and Indian distribution companies postponed last-mile commissioning in several states. These bottlenecks stall construction close-outs and defer the start of maintenance revenue. FM firms now prequalify prospects based on power availability status and include escalation clauses that cover idled labor. Some are installing interim microgrids, allowing developers to test systems before full grid hookup; however, the added capital burden favors well-capitalized integrators over cash-constrained local contractors.
*Our forecasts treat driver/restraint impacts as directional, not additive. The impact forecasts reflect baseline growth, mix effects, and variable interactions.
Segment Analysis
By Service Type: Energy Management Extends Its Lead
Asia-Pacific hard facility management market size for energy management and power systems is poised to reach a significant value, advancing at a 3.83% CAGR, well ahead of legacy HVAC services. Energy-management contracts increasingly include on-site renewables, battery storage, and digital twins that predict load variance. Buyers value verified savings, so vendors who can bundle metering, analytics, and performance guarantees command premium prices. In contrast, HVAC maintenance, although still holding 38.12% of the Asia-Pacific hard facility management market share in 2025, faces slower growth because much of the installed base is aging equipment awaiting phased replacement. Mechanical and electrical maintenance will remain foundational, yet commoditization is likely as IoT sensors reduce the need for routine inspections. Fire and life-safety system upkeep is gaining regulatory tailwinds, while plumbing services climb the agenda in water-stressed geographies..
Routine tasks, such as filter changes, are migrating toward outcome-based pricing, rewarding firms that invest in remote-monitoring hardware. Johnson Controls recorded a 25% jump in Asia-Pacific bookings for performance-guaranteed contracts in 2024, illustrating the link between financial innovation and market capture. Providers that cannot underwrite energy savings will cede ground to platforms with stronger balance sheets. The battle lines are therefore drawn between scale-driven integrators and niche experts who master high-value micro-segments like liquid cooling or greywater recycling.

By End User: Industrial Growth Reconfigures Portfolio Mix
Industrial and manufacturing customers are poised to add notable value through incremental spending, growing at a 4.18% CAGR as supply-chain diversification prompts factories to relocate to Vietnam, Indonesia, and India. Semiconductor fabs and pharma plants require cleanroom HVAC, ultra-pure water, and redundant power, lifting per-square-meter revenue well above that of office towers. In 2025, commercial buildings still accounted for 46.05% of outlays; however, their expansion rate lags behind because saturated CBDs and hybrid work arrangements temper new space demand. Healthcare and education budgets are rising as governments fund hospital refurbishments and research campuses, a trend that insulates cash flows from economic cycles.
Residential complexes remain largely in-house managed, though luxury towers in Singapore and Sydney are trialing predictive-maintenance outsourcing to differentiate amenities. For FM providers, industrial diversification creates a need for regional dispatch hubs, spare parts logistics, and specialized certifications. Those who invested early in local technician training and OEM partnerships are winning multi-year contracts at higher margins. Late movers face a steep learning curve and risk being locked out of complex industrial niches.
By Service Delivery Model: IFM Wins Wallet Share
Integrated contracts are capturing wallet share as clients chase single-pane dashboards and predictive analytics. The Asia-Pacific hard facility management market is tilting toward IFM because platforms unify mechanical, electrical, cleaning, and security services under performance metrics that link directly to building life-cycle cost. In-house teams still dominate at 54.21% share, but their cost advantage erodes when technology investment is required. Hybrid-oversight models are emerging in Japan and Australia where institutional knowledge remains valuable but digital skills are scarce.
OpenBlue, Desigo CC, and Honeywell Forge serve as the digital backbone that enables monthly asset health reports and energy-variance alerts. Contracts increasingly include KPI penalties, so providers that cannot offer real-time data lose negotiating power. Smaller regional players often subcontract under the umbrella of an integrator, compressing their margin and brand visibility. The direction of travel is clear: scale, data, and capital determine competitive durability.
By Facility Type: Data Centers Raise the Technical Bar
Data centers and critical environments deliver the highest revenue per square foot in the Asia-Pacific hard facility management market because 99.99% uptime is non-negotiable. Power density in AI racks surpassed 20 kW in 2024, accelerating the shift to liquid cooling that requires unfamiliar maintenance protocols. Office campuses still hold a 40.02% spending share, but hybrid work and tenant downsizing are moderating new contract values. Industrial logistics parks, especially cold-chain warehouses, create steady work for precision HVAC teams, while airports and seaports secure long-term contracts but require security clearances that often favor incumbents.
Hospitals grant stable margins due to regulatory audits of infection-control systems, although negotiating cycles can be protracted. Hospitality properties remain price sensitive, prioritizing guest-facing investments over back-of-house upgrades. The key takeaway is that technical depth, not footprint size, drives profitability. Firms that can certify liquid-cooling engineers or cleanroom technicians secure an outsized share in the fastest-growing facility segments.
Geography Analysis
China remains the largest slice of the Asia-Pacific hard facility management market, propelled by commercial completions in Chengdu, Wuhan, and Chongqing. Multinationals often partner with state-owned enterprises to navigate local procurement rules, which limits direct exposure but provides volume. Japan follows, characterized by aging assets that need seismic retrofitting and energy-efficiency upgrades. Labor scarcity there raises wage costs and speeds up automation adoption.
India is moving quickly as FDI lands in Gujarat, Maharashtra, and Tamil Nadu. However, fragmented state regulations and uneven power reliability force providers to maintain decentralized depots. Singapore is a mature and competitive market; power-supply caps now prompt hyperscalers to relocate to Johor in Malaysia, creating cross-border service corridors. Australia leads the uptake of IFM, driven by corporate demand for transparency and tied to the broader renewable energy push.
Indonesia benefits from redirected data-center investment but faces grid constraints that require backup-generation strategies. South Korea’s tech giants embed proprietary building management systems that require API interoperability. Taiwan’s semiconductor fabs command premium maintenance prices due to cleanroom stipulations. Thailand’s automotive supply chain lifts industrial volumes, and tourism rebound supports hospitality budgets. Smaller markets such as Vietnam and the Philippines see sharp growth from low bases, though contractor ecosystems remain thin. The geographic picture is bifurcated: advanced economies seek digital twins and carbon accounting, while developing markets value cost efficiency and quick mobilization.
Regulatory Landscape
Hard facility management delivery across Asia-Pacific works within a fragmented compliance map that increasingly links maintenance scope to energy-performance outcomes and auditable reporting. Singapore passed the Energy Conservation (Amendment) Bill on 8 April 2026, extending Minimum Energy Performance Standards (MEPS) and the Mandatory Energy Labelling Scheme (MELS) to regulated goods imported for own use from 1 July 2026, which adds documentation and verification tasks that FM providers often coordinate with building owners and occupiers. In Hong Kong, the Electrical and Mechanical Services Department administers the Building Energy Code (BEC) 2024 under the Buildings Energy Efficiency Ordinance (Cap. 610), setting prescriptive and performance-based compliance pathways for building services installations that shape HVAC, electrical, and controls maintenance regimes.
Beyond national rules, regional programs are also influencing retrofit procurement language and financing. The ASEAN Centre for Energy (ACE) continues to run the Programme for Energy Efficiency in Buildings (PEEB), with steering committee activity in May 2026 focused on aligning energy-efficiency policy approaches across member states. Together, jurisdiction-specific codes such as BEC 2024 and region-level initiatives such as ASEAN PEEB are pushing providers toward more standardized energy-audit, metering, and commissioning playbooks, while still requiring country-by-country certification and reporting capabilities for cross-border contracts.
Value Chain Analysis
In Asia-Pacific, the hard facility management value chain connects asset owners and occupiers (commercial, industrial, public infrastructure, and critical environments), advisory and procurement teams, and prime FM integrators that coordinate multi-trade delivery (HVAC, electrical, fire and life safety, plumbing, and building fabric) through a mix of self-performed labor and specialist subcontractors. Upstream, OEMs and distributors supply equipment, spare parts, and building-management software stacks, while digital platforms (for example, Johnson Controls OpenBlue and Siemens Desigo CC) increasingly sit between the asset layer and field execution to support remote monitoring, fault detection, and performance reporting. Downstream, service outcomes are governed by SLAs, KPI-linked penalties, and energy or uptime commitments, which raises the weight of commissioning, compliance documentation, and analytics in day-to-day maintenance delivery.
Program and capital support are also becoming part of the chain for retrofit-heavy portfolios, where energy savings help finance the work. The ASEAN PEEB initiative links building stakeholders with financing pathways through mechanisms such as an efficiency-focused digital hub, translating policy goals into funded projects that then flow to FM providers as bundled upgrade plus maintain contracts. As a result, the value chain is moving from reactive break-fix and routine preventive schedules toward integrated delivery models that combine compliance reporting, verified savings measurement, and lifecycle asset planning across multi-site portfolios.
Competitive Landscape
Regional revenue is still fragmented as the top ten providers hold roughly 35% to 40% share, leaving the remainder to hundreds of local or single-trade firms. Global integrators leverage brand equity, proprietary platforms, and multinational-client portfolios to secure multi-site contracts. Yet regional specialists defend their share through lower overhead, flexible staffing, and faster permitting. Technology is the biggest separator. Johnson Controls OpenBlue, Siemens Desigo CC, and Honeywell Forge drive predictive maintenance and energy optimization that resonate with finance chiefs focused on controlling operating expenses.
Secondary cities such as Pune, Chengdu, and Hanoi represent white-space territory where demand outstrips qualified supply. ISS acquired three Southeast Asian firms in 2024 to capitalize on this tailwind, and other integrators are expected to follow suit. ISO 14001 and ISO 50001 certifications appear more frequently in tenders, increasing compliance costs and squeezing thin-capitalized players. The Asia-Pacific hard facility management industry, therefore, trends toward a barbell structure: large, digital-native integrators servicing multinational and institutional accounts on one end, and agile local specialists handling single-service domestic contracts on the other. Mid-tier providers with partial scale but limited technology look vulnerable to consolidation or exit.
Competition is also intensifying in niche segments. Liquid-cooling maintenance, microgrid management, and cleanroom services carry high technical entry barriers and premium margins. Early movers who secure OEM training and parts access lock in advantage. Late entrants face steep certification costs and low initial volumes, making organic entry difficult. Partnerships between software-only firms and execution partners are emerging as a workaround, though the jury is out on whether clients will accept split accountability.
Asia-Pacific Hard Facility Management Industry Leaders
-
Jones Lang LaSalle Incorporated (JLL)
-
Sodexo S.A.
-
CBRE Group Inc
-
Johnson Controls International
-
Siemens AG
- *Disclaimer: Major Players sorted in no particular order
Market Opportunities and Future Outlook
Retrofit-led hard FM programs represent a clear whitespace across Asia-Pacific as owners prioritize extending asset life while meeting stricter energy and building-services requirements. JLL notes that 62% of premium office stock in Asia-Pacific is more than 10 years old (2026), which supports demand for HVAC recommissioning, controls upgrades, chiller optimization, and electrical-system modernization bundled into performance-oriented maintenance contracts. At the same time, enforcement-driven compliance work is expanding in mature markets; for example, Singapore extended MEPS and MELS obligations to regulated goods imported for own use from 1 July 2026, increasing the need for FM-led advisory, documentation, and verification workflows alongside ongoing mechanical and electrical upkeep.
A second opportunity area is at the intersection of energy-efficiency policy and accessible project financing, where programs are building pipelines rather than depending on discretionary capex. The ASEAN Centre for Energy (ACE) continues to advance the ASEAN PEEB framework, including 2026 activities that connect property stakeholders and financiers through digital matchmaking. This supports packaged projects such as metering, building-automation upgrades, and energy-management overlays, which then convert into multi-year O&M scopes. For providers, the near-term commercial advantage is centered on integrated delivery that brings together energy reporting, controls interoperability, and field service capacity, especially for portfolios that need standardized governance across multiple countries while complying with codes such as Hong Kong’s BEC 2024.
Recent Industry Developments
- June 2026: Sodexo secured a five-year, 140 million AUD contract to manage five remote mine villages for Westgold Resources in Western Australia, covering village management, maintenance, and facility upgrades. The expansion into remote mining sites strengthens recurring revenue streams and enables the integration of FM with lifecycle upgrades across dispersed assets.
- May 2026: Sodexo awarded a seven-year contract to provide integrated facilities management, including maintenance and refurbishment, for Rio Tinto’s Pilbara region operational sites and accommodation villages in Australia. The contract adds to a major multi-site footprint with energy efficiency upgrades and long-term service scopes.
- February 2026: JLL reappointed as a Property Service Provider for the Whole of Australian Government WoAG under a five-year contract to manage property and portfolio services for 28 Federal Government entities. This anchors JLL in public sector facilities and supports scale and stability for multi-site FM programs.
Research Methodology Framework and Report Scope
Market Definition and Coverage
For this methodology, the Asia-Pacific hard facility management market covers paid services used to keep the physical assets of buildings and sites running safely and reliably, such as HVAC upkeep, electrical works, and other technical maintenance delivered to end users across the region.
Scope exclusions: Soft services like cleaning and security, along with construction and major one-time renovation projects, are excluded from the market value.
Segmentation Overview
- By Service Type
- Mechanical Services Maintenance
- Electrical Services Maintenance
- HVAC Maintenance Services
- Fire and Life-Safety Systems Maintenance
- Plumbing and Water Management
- Building Fabric and Structural Maintenance
- Energy Management and Power Systems
- By End User
- Commercial
- Institutional (Education and Healthcare)
- Public / Infrastructure
- Industrial and Manufacturing
- Residential and Mixed-Use
- By Service Delivery Model
- In-House (Self-Performed)
- Outsourced Single-Service
- Integrated Facilities Management (IFM)
- Hybrid Models
- By Facility Type
- Office and Corporate Campuses
- Industrial and Logistics Facilities
- Data Centres and Critical Environments
- Healthcare Facilities
- Hospitality and Leisure Properties
- Transportation Hubs and Infrastructure
- By Country
- Australia
- China
- India
- Japan
- Indonesia
- Malaysia
- Singapore
- South Korea
- Taiwan
- Thailand
- Rest of Asia-Pacific
Data Sources, Market Sizing, and Validation
Desk Research
Desk research was used to set the market boundary, map the demand pool, and anchor assumptions that can be checked consistently across countries. We relied on public source types that help explain building stock growth and operating needs, including national statistics offices across Asia-Pacific, the World Bank, UN releases, and energy agencies that publish building energy and efficiency indicators.
To translate demand signals into service value, we reviewed regulatory and standards references and technical publications that describe maintenance practices and compliance triggers, along with materials from industry bodies focused on facilities and building services. Company annual reports, investor decks, and reputable press were used to understand contract structures and outsourcing trends. Selected paid subscriptions were also used for company financials, news screening, and patent checks linked to building systems and maintenance tools. These examples are not exhaustive, and many other sources were also consulted for data collection, cross-checks, and clarification during the research.
Primary Interviews and Surveys
Primary work focused on validating what the desk research cannot show cleanly, mainly how technical FM spend is split across building systems, how outsourcing is priced, and how contracts are renewed in different countries. We spoke with a mix of service providers, facility heads from commercial and institutional sites, and operations teams that manage multi-site portfolios. The inputs helped us tighten assumptions on service frequency, coverage, and typical contract terms across Asia-Pacific.
Distribution of primary research fieldwork respondents
| Company type | Respondent position |
|---|---|
| Top tier: 31% | CXOs: 12% |
| Mid tier: 49% | Functional/Unit leaders: 37% |
| Smaller Players: 20% | Managers: 51% |
Market-Sizing & Forecasting
The market was sized using a top-down and bottom-up approach, starting from the regional facility management spend pool and then narrowing it to hard services by applying country-level splits informed by building activity and outsourcing mix. For the top-down build, country demand was reconstructed using indicators such as commercial floor space additions, institutional building stock expansion, industrial site counts in key hubs, HVAC penetration and replacement cycles, and energy efficiency compliance activity that typically drives preventive maintenance.
Those totals were then corroborated with selective bottom-up checks. Sampled contract values, typical area-based pricing logic, and supplier revenue exposure were used to confirm whether implied spend per site looked realistic. When bottom-up signals were thin in smaller countries, we used peer-country proxies and adjusted them based on local wage levels and outsourcing intensity shared by interviewees.
For forecasting, scenario analysis was used because cost inflation, construction activity, and outsourcing adoption can move differently across Asia-Pacific in the short run. Growth drivers and constraints were translated into annual assumptions on service volumes and average pricing, and then validated in short follow-ups to avoid forcing one aggressive path across all countries.
Data Validation & Update Cycle
Validation was done through multiple checks so the final numbers stay consistent with real-world operating signals. We compared model outputs against independent markers like construction completions, building energy policy activity, and disclosed services revenue trends where available, then reviewed outliers at the country and service level before internal sign-off.
If a large variance appeared, we re-checked conversion rates, scope mapping, and the outsourcing split. When the gap could not be explained from documents alone, we re-contacted select experts. Reports are refreshed annually, with interim updates when material events shift pricing, labor availability, or compliance needs, and a final pre-delivery review is completed so clients receive the most current view.
Mordor Intelligence's Asia Pacific Hard Facility Management Market Size Measured Against Other Published Estimates
Published market size numbers for hard facility management in Asia-Pacific can look far apart because each source draws the line differently on what counts as hard services, which countries are included, and whether pricing reflects contracted rates or broader budgeted spend. Timing also matters because inflation, wage resets, and energy-driven maintenance cycles can change value quickly even when volumes do not move much.
Key gap drivers usually come down to scope and conversion choices. This includes whether large one-off retrofit works are counted as maintenance, how in-house labor is valued, and whether integrated contracts are split cleanly between hard and soft services. Currency conversion timing and the base year used as the reference can further shift the number, especially when local currencies move sharply against the US dollar.
Benchmark comparison
| Source | Market Size | Gaps in Research Methodology |
|---|---|---|
| Mordor Intelligence | USD 250.46 B (2025) | |
| Regional Consultancy A | USD 235.00 B (2025) | This estimate appears to apply a narrower hard-services basket by excluding some technical maintenance that is bundled inside multi-service contracts, which can reduce the captured value in markets where integrated outsourcing is common. |
| Industry Association B | USD 270.00 B (2025) | This figure likely includes a broader spend view by counting selected retrofit and system upgrade work under ongoing maintenance budgets, and it may value more in-house activity at replacement cost instead of contracted service rates. |
The table shows a spread that is mainly explained by what gets counted as maintenance versus upgrade work and how bundled contracts are split. In Mordor Intelligence's model, the value is limited to recurring hard FM services delivered for operating assets, with major project-led refurbishments and soft services kept out. With that boundary in place, the final total stays traceable to clear drivers like building stock growth, outsourcing mix, and service pricing, and the same steps can be repeated as new country data comes in.
Key Questions Answered in the Report
What is the 2026 value of the Asia Pacific hard facility management market?
The market stands at USD 258.17 billion in 2026.
How fast is the sector expected to grow by 2031?
It is projected to reach USD 300.41 billion, reflecting a 3.08% CAGR.
Which service type is expanding fastest?
Energy management and power systems lead with a 3.83% CAGR through 2031.
Which end-user segment is growing quickest?
Industrial and manufacturing facilities are forecast to rise at a 4.18% CAGR.
Why are integrated FM contracts gaining traction?
Multinationals prefer single-vendor accountability and data-rich platforms that enable predictive maintenance and cost transparency.