
Market Overview
| Study Period | 2021 - 2031 |
|---|---|
| Forecast Data Period | 2026 - 2031 |
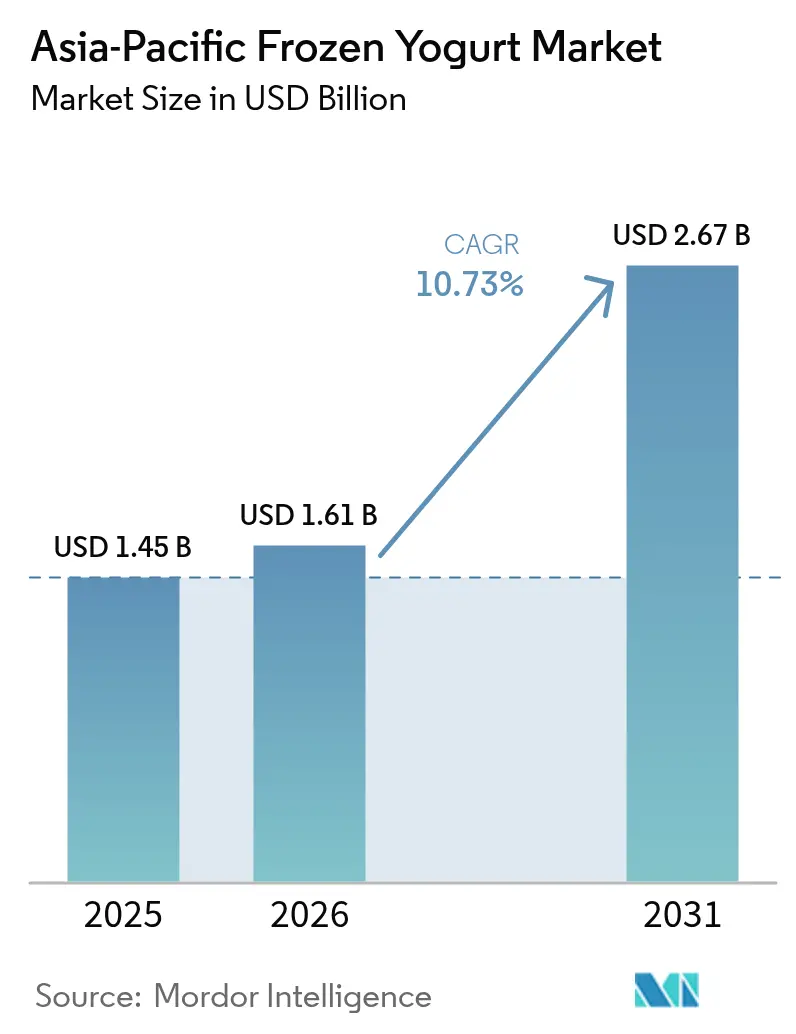
| Base Year Market Size (2025) | USD 1.45 Billion |
| Market Size (2026) | USD 1.61 Billion |
| Market Size (2031) | USD 2.67 Billion |
| Growth Rate (2026 - 2031) | 10.73 % |
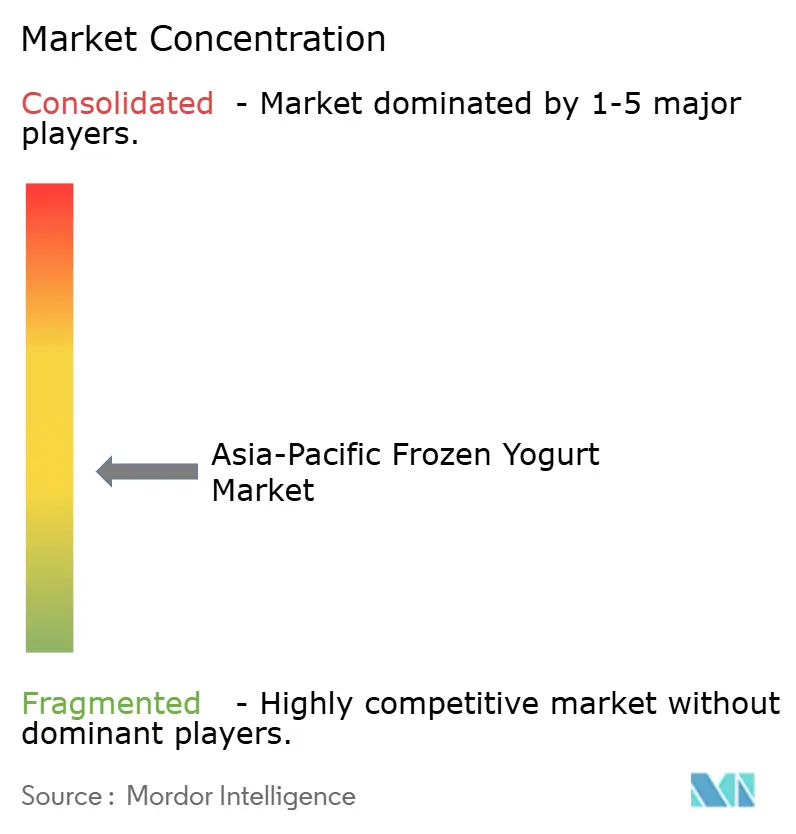
| Market Concentration | Medium |
Major Players *Disclaimer: Major Players sorted in no particular order Image © Mordor Intelligence. Reuse requires attribution under CC BY 4.0. | |
Asia-Pacific Frozen Yogurt Market Analysis by Mordor Intelligence
The Asia-Pacific frozen yogurt market size is expected to grow from USD 1.45 billion in 2025 to USD 1.61 billion in 2026 and is forecast to reach USD 2.67 billion by 2031 at 10.73% CAGR over 2026-2031. Demand accelerates as consumers trade traditional ice cream for probiotic-rich alternatives, driven by favorable labeling regulations and expanded cold-chain coverage. China leads regional value through mature convenience-store networks, while India posts double-digit growth as modern retail spreads to tier-2 cities. Flavor localization, plant-based innovation, and on-the-go formats raise average selling prices, yet price-sensitive shoppers keep the category fragmented. Energy-intensive refrigeration and volatile dairy costs remain the chief profit headwinds.
Key Report Takeaways
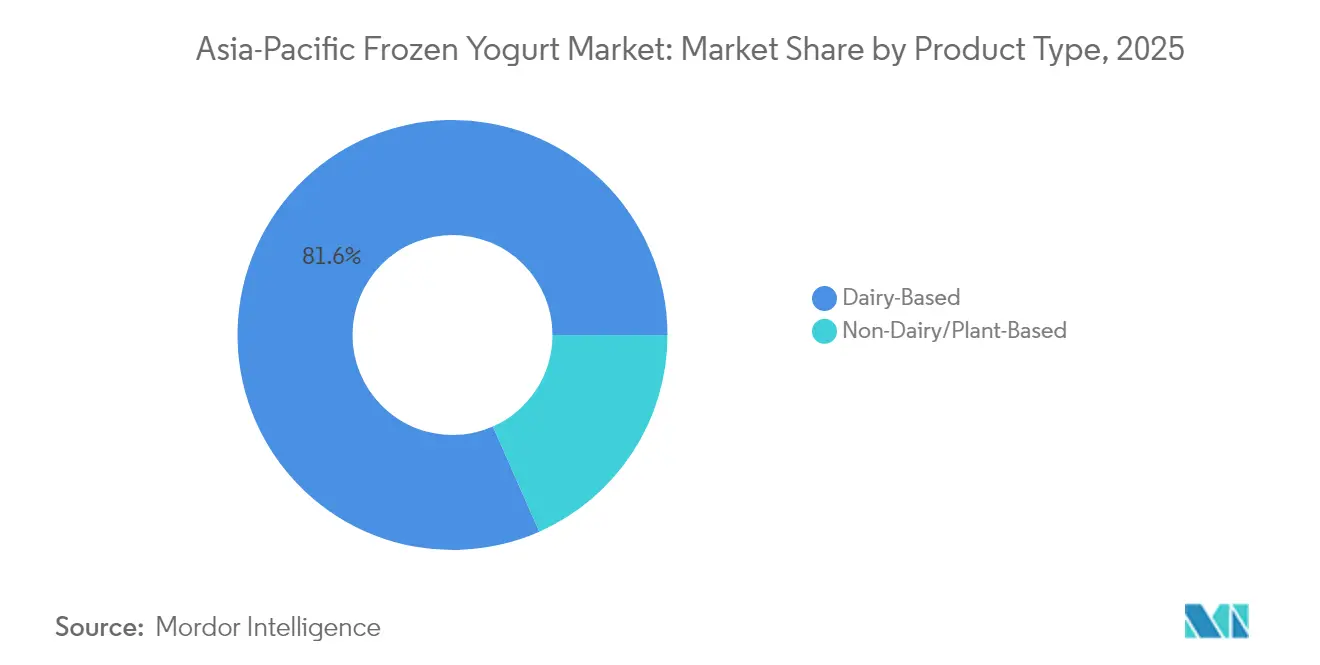
- By product type, dairy-based offerings held 81.62% of the Asia-Pacific frozen yogurt market share in 2025, while plant-based lines are projected to grow at an 11.29% CAGR through 2031.
- By flavor, flavored variants captured an 88.10% share of the Asia-Pacific frozen yogurt market size in 2025 and are projected to advance at a 11.66% CAGR through 2031.
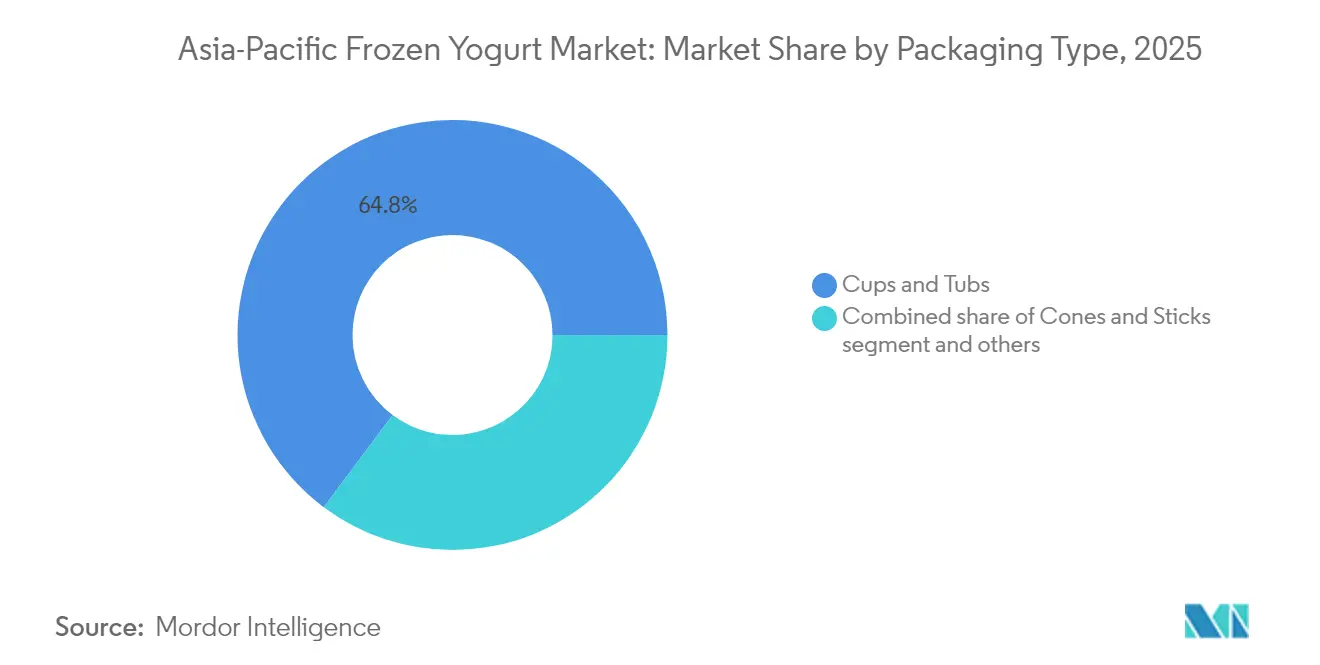
- By packaging type, cups and tubs accounted for 64.78% of the Asia-Pacific frozen yogurt market size in 2025; cones and sticks recorded the fastest forecasted CAGR at 12.63% through 2031.
- By distribution, on-trade outlets are projected to expand at a 12.03% CAGR to 2031, outpacing off-trade channels.
- By geography, China commanded 39.30% of regional value in 2025, while India is set to grow at a 12.31% CAGR through 2031.
Note: Market size and forecast figures in this report are generated using Mordor Intelligence’s proprietary estimation framework, updated with the latest available data and insights as of 2026.
Market Trends and Insights
Drivers Impact Analysis of Asia-Pacific Frozen Yogurt Market*
| Driver | (~) % Impact on CAGR Forecast | Geographic Relevance | Impact Timeline |
|---|---|---|---|
| Rising demand for healthier dessert alternatives | +2.1% | China, Japan, Australia | Medium term (2-4 years) |
| Expansion of plant-based product lines | +1.8% | Urban China, India, Southeast Asia | Long term (≥4 years) |
| Premiumization and flavor innovation | +1.5% | China, Japan, South Korea, Singapore | Short term (≤2 years) |
| Modern retail and cold-chain growth | +1.9% | India, Vietnam, Philippines, Indonesia | Medium term (2-4 years) |
| Functional fortification | +1.6% | Japan, South Korea, Australia, urban China | Medium term (2-4 years) |
| Low-calorie and sugar-conscious variants | +1.4% | South Korea, Japan, Australia, Singapore | Short term (≤2 years) |
| Source: Mordor Intelligence | |||
Rising Demand for Healthier Dessert Alternatives
Retailers are now allocating more freezer space to lighter treats as concerns about obesity rise. Frozen yogurt typically delivers 0.5-6% fat, compared to 10-18% for premium ice cream, while 3-6 g of protein per 100 g is suitable for active lifestyles. South Korea’s adult obesity prevalence reached 38.4% in 2024, prompting chains to curate “better-for-you” aisles according to the National Library of Medicine (NIH)[1]. Australian operator Yo-Chi increased revenue to AUD 53.7 million in 2024 by positioning its parlors as alcohol-free social spaces. Viable probiotic counts are maintained at temperatures below −18 °C, reinforcing gut health claims. India’s 2024 FSSAI update set minimum culture standards that strengthen consumer trust.
Expansion of Plant-Based/Non-Dairy Product Lines
With lactose intolerance affecting 70–90% of adults in East and Southeast Asia, non-dairy frozen yogurt is rapidly transitioning from a niche to a mainstream product, thereby meeting long-term demand for traditional dairy. Established players are responding: in spring 2024, Megmilk Snow Brand launched its Plant Label range, utilizing soy milk cultures, which reflects a broader shift toward plant-based products that command price premiums of 20-30%. Growth is reinforced by strong corporate momentum and cultural alignment[2]. Danone’s protein product sales rose from EUR 400 million in 2021 to EUR 1 billion in 2023, with brands such as Alpro and Silk gaining traction in APAC markets, where plant-forward diets are resonating. Ingredient innovation in almond, coconut, and oat bases is closing the sensory gap with dairy, supporting an 11.53% CAGR through 2030. Meanwhile, wider retail adoption, such as GS25 stocking 12 plant-based frozen dessert SKUs by mid-2024, signals the normalization of the category. Sustainability further accelerates uptake, as oat milk’s lower CO₂ footprint strongly appeals to urban Asian consumers.
Premiumization and Flavor Innovation Across APAC
Flavor differentiation has emerged as a key lever for justifying price premiums of 15-25% over commodity vanilla and chocolate. Manufacturers are leaning into regional palates, such as Meiji’s matcha frozen yogurt in Japan, Amul’s mango-kulfi hybrid in India, and Nestlé’s durian variant in Malaysia, to create localized SKUs that are difficult for global competitors to replicate. South Korea illustrates rapid premiumization: Lalasweet sold 4.4 million units of its Greek-yogurt ice cream in the first four months of 2024, up 76× year-on-year, priced at KRW 3,000 versus KRW 1,500 for standard ice cream, reflecting a broader “affordable luxury” consumption trend. Beyond flavor, texture innovation is reinforcing differentiation. Nitrogen-infused frozen yogurt, offering a denser and creamier mouthfeel, is gaining traction in premium outlets across Singapore and Hong Kong. Simultaneously, nostalgia-driven flavors such as ube in the Philippines and black sesame in China are resurfacing, leveraging emotional resonance to build brand loyalty in a category characterized by low switching costs.
Modern Retail and Cold-Chain Infrastructure Growth
Cold-chain expansion is unlocking frozen-yogurt distribution in markets previously limited by heat and unreliable power. Vietnam’s cold-storage capacity reached 1.5 million tons in 2023, growing at a rate of 12% annually, which enabled year-round frozen yogurt availability in major cities. In India, organized retail expanded 8.2% in 2024, with modern formats now accounting for 18% of grocery sales, disproportionately benefiting frozen categories that require continuous refrigeration. Parallel gains are evident in the foodservice and logistics sectors[3]. The Philippines recorded seven frozen-yogurt parlor openings in April 2025 alone, driven by mall-led experiential dining strategies. On the logistics side, Yili’s 2024 probiotic stabilization technology enables frozen yogurt to withstand brief cold-chain disruptions, resulting in a 15–20% reduction in spoilage in infrastructure-challenged markets. Rising e-commerce further reinforces investment, with Nestlé India’s online sales share increasing to 6.7% in 2024, prompting innovations such as refrigerated metro-station lockers for frozen-food click-and-collect.
Restraints Impact Analysis of Asia-Pacific Frozen Yogurt Market*
| Restraint | (~) % Impact on CAGR Forecast | Geographic Relevance | Impact Timeline |
|---|---|---|---|
| Seasonality and climate-dependent consumption | -0.9% | Tropical Southeast Asia, Southern China, India | Short term (≤ 2 years) |
| Intense price sensitivity in emerging Asia-Pacific markets | -1.2% | India, Indonesia, Philippines, Vietnam | Medium term (2-4 years) |
| Cold-chain energy and sustainability concerns | -0.7% | Global, acute in energy-deficit markets (Vietnam, Philippines) | Long term (≥ 4 years) |
| Limited availability of high-quality dairy inputs | -0.8% | India, Southeast Asia (excluding Australia, New Zealand) | Medium term (2-4 years) |
| Source: Mordor Intelligence | |||
Seasonality and Climate-Dependent Consumption
Frozen yogurt sales in tropical APAC markets remain highly seasonal, with monsoon rains and cooler months reducing impulse demand by 25–35% versus summer peaks. In India, where frozen yogurt competes with ice cream, nearly 60% of annual revenue is generated between March and June, forcing manufacturers to absorb elevated inventory and working capital costs during off-peak periods[4]. Similarly, the Philippines’ surge of frozen-yogurt parlor openings in April 2025 aligns with peak heat demand but exposes operators to cash-flow pressure during the cooler November–February window. Climate volatility exacerbates this challenge. Unseasonably cool summers in Japan led to an 8% decline in ice cream exports in H1 2024, disproportionately affecting frozen-yogurt SKUs positioned as refreshments rather than indulgences. Despite widespread air-conditioned retail, consumer perceptions still strongly link frozen desserts to heat relief, limiting year-round consumption. While manufacturers are testing counter-seasonal positioning, such as Nestlé Thailand’s reframing of frozen yogurt as a post-meal palate cleanser, behavioral shifts are progressing slowly.
Intense Price Sensitivity in Emerging Asia-Pacific Markets
Per-capita frozen-dessert consumption in India is just 450 mL annually, one-tenth of Japan’s, largely due to affordability, with 70% of households earning below USD 10,000. Frozen yogurt’s 15-25% price premium limits adoption in tier-2 and tier-3 cities, where consumers prioritize calories over probiotics. In Indonesia, froyo parlors are concentrated in Jakarta and Bali, leaving 250 million consumers underserved, while Vietnam’s 8% rise in industrial electricity tariffs in 2024 squeezes margins for smaller operators amid 4.5% food inflation. Price competition is intensifying: GS25’s Seoul Milk Ice Cream launched at KRW 1,500 in June 2025, undercutting premium frozen yogurt by 40–50%, pressuring independent parlors and contributing to a 30% closure rate of Philippine froyo startups within 18 months.
*Our forecasts treat driver/restraint impacts as directional, not additive. The impact forecasts reflect baseline growth, mix effects, and variable interactions.
Asia-Pacific Frozen Yogurt Market Segment Analysis
By Product Type:
Dairy Anchors Volume, Plant-Based Captures ValueIn 2025, dairy-based frozen yogurt held an 81.62% market share, supported by established supply chains, lower costs, and consumer familiarity. Non-dairy alternatives are projected to grow at a 11.29% CAGR through 2031, driven by lactose intolerance (affecting 70-90% of East Asian adults) and premiumization strategies that position plant-based SKUs as wellness products rather than substitutes. Megmilk Snow Brand’s Plant Label line, launched in spring 2024 with Lactobacillus gasseri SBT2055 on soy milk, captures 20-30% price premiums while mitigating portfolio risk.
Ingredient innovations, including almond, coconut, and oat bases, as well as nitrogen infusion, are closing the sensory gap with dairy, enabling plant-based yogurt to compete outside health-food niches. Danone’s Alpro and Silk brands accounted for a significant portion of its EUR 1 billion in protein product revenue in 2023, with the APAC region representing 22% of volume, despite comprising only 15% of the global population. Sustainability also supports adoption: oat milk emits 0.9 kg of CO₂ per liter, compared to 3.2 kg for dairy, which appeals to environmentally conscious urban consumers. Distribution is expanding, with GS25 in South Korea stocking 12 plant-based frozen-dessert SKUs by mid-2024, signaling mainstream acceptance.

By Flavor:
Regional Tastes Drive PremiumizationFlavored frozen yogurt dominated the market with an 88.10% share in 2025 and is projected to grow at a 11.66% CAGR through 2031, outpacing plain variants as manufacturers incorporate regional ingredients to justify price premiums of 15–25%. Localized SKUs, such as Meiji’s matcha in Japan, Amul’s mango kulfi in India, and Nestlé’s durian in Malaysia, create unique offerings that are difficult for global competitors to replicate. South Korea illustrates rapid premiumization: Lalasweet sold 4.4 million units of Greek-yogurt ice cream in the first four months of 2024, 76× year-on-year, at KRW 3,000 versus KRW 1,500 for standard ice cream, tapping into “small luxury” consumer trends.
Plain frozen yogurt retains a niche among health-focused consumers, but its share is declining as functional ingredients enter flavored SKUs, e.g., Yili’s lactoferrin strawberry yogurt in China. Nostalgia flavors such as ube in the Philippines and black sesame in China further drive emotional loyalty, while texture innovations, like nitrogen-infused yogurt, enhance creaminess in premium parlors across Singapore and Hong Kong. Seasonal limited editions, such as Nestlé Thailand’s YenYen × La Frutta collaboration, generate trial and social-media buzz, often outperforming paid advertising by 4:1.
By Packaging Type:
Portability Reshapes Format MixCups and tubs dominated the market, accounting for a 64.78% share in 2025, reflecting their appeal in off-trade channels due to their resealability and multi-serve convenience. Cones and sticks are growing at 12.63% CAGR through 2031, driven by on-the-go consumption in metro corridors, night markets, and convenience stores; GS25’s Seoul Milk Ice Cream stick, launched at KRW 1,500 in June 2025, undercuts premium frozen-yogurt cups by 40-50%, highlighting portable formats as traffic drivers.
Sustainability is reshaping packaging: Unilever aims for 100% recyclable or compostable materials by 2027, replacing polystyrene cups with paperboard capable of withstanding -18°C, while Australia’s Yo-Chi transitioned 60% of packaging to plant-based PLA in 2024 despite a 12% cost increase to appeal to Gen Z. Emerging formats, pouches and squeeze tubes, are gaining traction in humid Southeast Asia, and portion sizes reflect local income: single-serve cups average 65 g in India versus 120 g in Australia to meet sub-USD 1 price points in tier-2 cities.
By Distribution Channel:
On-Trade Gains as Social VenuesOff-trade channels accounted for 46.12% of frozen yogurt sales in 2025, led by supermarkets and hypermarkets that leveraged cold-chain scale to offer prices 20-30% lower than those of specialty parlors. On-trade outlets, cafés, food courts, and self-serve parlors are projected to grow at a 12.03% CAGR through 2031, driven by Gen Z consumers treating frozen-yogurt venues as alcohol-free social hubs. Yo-Chi in Australia generated AUD 53.7 million in 2024 by repositioning stores as “third places,” while South Korea’s Yoajung charges KRW 4,500–8,000 per serving in experiential locations where ambiance justifies premium pricing.
E-commerce is rapidly expanding within off-trade: Nestlé India’s online sales rose to 6.7% in 2024 from 4.1% in 2022, supported by refrigerated lockers for click-and-collect orders. Convenience stores are emerging as hybrid channels, with GS25 operating 355 stores in Vietnam and 270 in Mongolia, aiming for 1,500 international locations by 2027 and using frozen desserts as impulse drivers. Vending machines and food trucks remain marginal but are growing in Japan, where 58,000 convenience stores, or konbini, provide 24/7 access in areas without dedicated parlors.
Geography Analysis
China Frozen Yogurt Market
China led the APAC frozen yogurt market with a 39.30% share in 2025, supported by its scale, cold-chain infrastructure, and strong demand for functional foods. Yili Group’s CNY 115.8 billion revenue base, probiotic stabilization technology (2024), and overseas brand expansion reinforce category resilience, while new plants from Meiji signal continued multinational investment. Regulatory tailwinds, including China’s Nutri-Grade labeling rollout, which is expected by 2026, are encouraging lower-sugar reformulation and premium functional positioning.
India Frozen Yogurt Market
India is the fastest-growing major market, with a 12.31% CAGR forecast through 2031, driven by the expansion of organized retail and rising incomes in tier-2 cities. Per-capita frozen-dessert consumption remains low at 450 mL annually, indicating long-term headroom; however, penetration is constrained by price sensitivity and the 15–25% premium of frozen yogurt over ice cream. Regulatory liberalization of permitted ingredients and strong cooperative players, such as Amul and Mother Dairy, support innovation, although milk-quality constraints limit the consistent premium texture.
APAC Frozen Yogurt Market
Japan, Australia, and South Korea are mature markets characterized by incremental and premium-led growth. Japan acts as a regional innovation hub for flavors and textures; Australia’s Yo-Chi exemplifies experiential, high-margin expansion; and South Korea’s rapid shift toward high-protein, low-sugar products mirrors broader zero-calorie beverage trends now extending into frozen yogurt. Southeast Asia represents the next growth frontier as cold-chain capacity improves. The Philippines and Vietnam are seeing rapid parlor and retail expansion, Malaysia is supporting premium artisanal launches, and Indonesia remains concentrated in Jakarta and Bali due to affordability and logistics gaps. Regional convenience-store expansion by GS25 and CU underscores frozen yogurt’s transition toward impulse-led, mass-access formats.
Regulatory Landscape
Frozen yogurt in Asia-Pacific is governed under broader frozen confection and fermented milk frameworks, with regulators focusing on microbiological limits, validated heat treatment, hygienic dispensing, and cold-chain control. In Hong Kong, the Centre for Food Safety (CFS) sets detailed compliance expectations for frozen confections, including microbiological limits and specific time-temperature equivalents for heat treatment (for example, 66C for 30 minutes, 71C for 10 minutes, or 79C for 15 seconds). This pushes manufacturers and self-serve operators toward HACCP-aligned controls across storage, transport, and equipment sanitation.
China is tightening definitions and labeling rules for yogurt-based products. GB 19302-2025 (Fermented Milk) took effect on September 16, 2025, clarifying yogurt categories and related compliance expectations for fermented dairy inputs used in frozen yogurt. China also issued GB 7718-2025 (Labeling of Prepackaged Foods) on March 16, 2025, with implementation on March 16, 2027, creating a clear timeline for exporters and regional brand owners to redesign labels and claims. In India, FSSAI licensing via the FoSCoS portal remains a practical market-entry gate for manufacturers, retailers, and distributors, while import economics can be influenced by classification and tariffs, such as Japan classifying relevant yogurt products under HS 0403.20 with a general import tariff rate listed at 35% (subject to EPA or concession schedules).
Competitive Landscape
The Asia-Pacific frozen yogurt market is moderately fragmented, with global multinationals such as Unilever, Nestlé, Danone, and General Mills operating alongside regional leaders including Yili, Meiji, and Amul, as well as a large base of independent self-serve parlors that compete through lower labor costs. While scale players benefit from procurement and distribution efficiencies, as evidenced by Yili’s 19% share of China’s broader ice cream market and Unilever’s Walls brand holding 15%, no company dominates the frozen yogurt market specifically. The category remains under-indexed compared to premium ice cream and traditional frozen desserts, such as kulfi, particularly in South Asia, which limits concentration and sustains competitive diversity.
Strategic activity is concentrated around probiotic differentiation, plant-based expansion, and experiential retail. Yili’s ambient-temperature probiotic stabilization technology, commercialized in 2024, enables frozen yogurt to withstand brief cold-chain disruptions without loss of Lactobacillus viability, reducing spoilage by 15–20% in infrastructure-challenged markets and creating a defensible R&D advantage. In parallel, Danone’s protein product sales doubled from EUR 400 million in 2021 to EUR 1 billion in 2023, with plant-based brands Alpro and Silk contributing disproportionately in APAC, where lactose intolerance affects 70–90% of adults, supporting a premium wellness positioning.
White-space opportunities persist in tier-2 and tier-3 cities across India, Indonesia, and the Philippines, where organized retail penetration remains below 20% and frozen-yogurt availability is uneven. Smaller players such as Yo-Chi are challenging incumbents by positioning frozen yogurt as a social experience rather than a dessert, with its 165-seat Barangaroo flagship in Sydney generating AUD 2.1 million in its first quarter and delivering 30–40% higher per-customer spending than traditional parlors. However, technology adoption remains uneven: AI-driven demand forecasting and digital promotions are common among multinationals but rare among independents, a gap likely to widen as e-commerce expands. Unilever’s March 2024 spin-off of its EUR 7.9 billion ice cream division further signals potential consolidation opportunities in this fragmented landscape.
Asia-Pacific Frozen Yogurt Industry Leaders
-
Unilever plc
-
Nestlé S.A.
-
General Mills Inc.
-
Danone S.A.
-
Yili Group
- *Disclaimer: Major Players sorted in no particular order
Asia-Pacific Frozen Yogurt Market Companies Covered in this Report
- Unilever plc
- Nestlé S.A.
- General Mills, Inc.
- Danone S.A.
- Ben & Jerry’s Homemade Inc.
- Frosty Boy
- Yili Group
- Lick Frozen Yogurt
- Wholefarm Australia Pty Ltd
- Menchie’s Frozen Yogurt
- Yogurtland Inc.
- TCBY
- Red Mango Inc.
- 16 Handles LLC
- Yogen Früz
- Mother Dairy
- Amul (GCMMF)
- Blue Bell Creameries
- Meiji Holdings
- Bright Dairy & Food
Market Opportunities and Future Outlook
Portfolio consolidation and capability upgrades around functional dairy are creating practical routes to scale frozen yogurt across Asia-Pacific, particularly where probiotic positioning, protein claims, and plant-based bases support premium pricing. In June 2026, Danone signed definitive agreements to acquire Australia-based MADE Group and to buy the remaining 49% stake in its fresh dairy joint venture with Saputo Dairy Australia, strengthening regional access to functional nutrition and yogurt platforms that can be extended into frozen formats across modern retail and foodservice.
In parallel, brand-led expansion in Southeast Asia and China is opening whitespace for franchise, QSR, and convenience-driven distribution models that reach beyond premium parlors. In June 2026, PT Sarimelati Kencana Tbk (PZZA) acquired 52% of PT Halal Artisan Yummies (Hayo Frozen Yogurt) and paired the move with a 2026 capex plan to renovate 60 to 70 outlets and open five new stores, showing how cross-category operators use frozen yogurt to diversify dessert traffic and improve store economics. In China, Yoajung publicly set a 100-store target by end-2026 through a master franchise approach, reinforcing how scalable franchising and mall-based sites can support faster on-trade penetration, while improved cold-chain coverage and technologies that reduce spoilage during brief temperature excursions support broader geographic expansion in infrastructure-challenged markets.
Recent Industry Developments in Asia-Pacific Frozen Yogurt Market
- July 2026: Yoajung announced a target to reach 100 stores across China by the end of 2026 using a master franchise model. The plan formalizes a rapid rollout playbook tied to high-traffic urban retail locations, increasing pressure on independent parlors and local chains in major Chinese cities.
- August 2025: Yo-Chi opened its first international store in Singapore's Orchard Central through a 50:50 joint venture, expanding beyond Australia. The self-serve format with multiple flavors and toppings extends the brand's experiential positioning into a new premium retail hub, supporting cross-border replication of its on-trade model.
- December 2024: Yo-Chi opened a 165-seat flagship store in Sydney's Barangaroo precinct, its largest location globally. The large-format venue emphasizes communal seating and an expanded toppings bar, reinforcing frozen yogurt as a social destination and a higher-ticket on-trade proposition.
Asia-Pacific Frozen Yogurt Market Report Scope and Research Methodology
Market Definition and Coverage
This market covers sales of frozen yogurt products across Asia Pacific, measured in value in USD across retail and foodservice. It includes dairy-based and non-dairy frozen yogurt sold through stores and online channels within the covered countries.
Scope exclusions: We exclude ambient yogurt, chilled spoonable yogurt, ice cream that is not marketed as frozen yogurt, and toppings or accessories sold separately.
Segments Covered in This Report
- By Product Type
- Dairy-Based
- Non-Dairy/Plant-Based
- By Flavor
- Plain
- Flavored
- By Packaging Type
- Cups and Tubs
- Cones and Sticks
- Others
- By Distribution Channel
- On-Trade
- Off-Trade
- Supermarkets/Hypermarkets
- Convenience Stores
- Online Retail
- Other Distribution Channels
- By Geography
- China
- India
- Japan
- Australia
- South Korea
- Rest of Asia-Pacific
Data Sources, Market Sizing, and Validation
Desk Research
Desk research starts by building the consumption and supply context for frozen yogurt in Asia Pacific, and then narrowing it to the frozen dessert and cultured dairy space. We relied on public, non-paywalled references such as national statistics offices and food manufacturing surveys, customs and tariff databases for trade flows, and food safety and labeling guidance from regulators in key countries. We also used sources such as FAO dairy statistics, OECD consumer and price indicators, and peer-reviewed nutrition and dairy processing journals to understand product definitions and demand signals.
To ground the commercial side, we reviewed company annual reports, investor presentations, and press releases for distribution expansion, product launches, and pricing direction. Supporting datasets from paid subscriptions were used selectively for company financials and intelligence, news and financials, and shipment-level import or export checks when a public series was incomplete. These desk sources are not exhaustive, and many other public references were also used for data collection, validation, and clarification during the study.
Primary Interviews and Surveys
Primary work was used to test what we saw in desk research, especially for channel mix shifts, price bands, and how dairy-based and plant-based frozen yogurt are positioned in different countries. We spoke with a mix of manufacturers, ingredient suppliers, distributors, and retail and foodservice stakeholders across major Asia Pacific markets, and responses were used to confirm assumptions and adjust the model where gaps remained.
Distribution of primary research fieldwork respondents
| Company type | Respondent position |
|---|---|
| Top tier: 27% | CXOs: 13% |
| Mid tier: 56% | Functional/Unit leaders: 31% |
| Smaller Players: 17% | Managers: 56% |
Market-Sizing & Forecasting
Sizing is built using a top-down and bottom-up model where country-level dairy dessert consumption signals and trade data are reconstructed into an addressable frozen yogurt demand pool, and then filtered by channel availability and product presence. To keep the math practical, we used inputs such as urban and modern trade penetration, cold-chain readiness indicators, foodservice outlet expansion, observed price ranges by pack type, and the share of dairy-based versus non-dairy options in freezer sets (illustrative drivers that vary by country). Where a data series was missing, nearby proxy indicators were used, and then corrected through interview feedback so totals did not drift away from market reality.
Once the country totals were built, selective bottom-up checks were run to corroborate the outcome, such as sampled price per unit multiplied by observed volume bands for key channels, and supplier and distributor roll-ups for a few higher visibility markets. Forecasting uses scenario analysis supported by a light multivariate regression, where drivers like disposable income movement, retail footprint growth, and input cost pressure are translated into volume and price paths. Assumptions were reviewed with primary respondents to ensure the growth profile is credible for the region.
Data Validation & Update Cycle
Outputs are validated through multiple checks so the final numbers are internally consistent and externally explainable. We compare country results against independent signals such as dairy category growth, frozen dessert shelf expansion, and trade direction, and then review variances that look out of line with known channel or pricing realities. If a mismatch is material, interviews are revisited and assumptions like channel split or average selling price progression are reworked before sign-off.
Each report is refreshed annually, and interim updates are triggered when there are material events such as sharp input cost swings, regulatory labeling shifts, or major distribution changes. Before delivery, the model gets a final pass so clients receive an updated view based on the latest available data and confirmations.
Mordor Intelligence's Asia Pacific Frozen Yogurt Market Estimate Compared With Other Published Estimates
Published market sizes for Asia Pacific frozen yogurt can vary a lot, even when they look like they are talking about the same product. Differences usually come from what is included as frozen yogurt, which countries are counted, the year used as the base, and how pricing and channel mix are carried forward in the forecast.
The table highlights a wide spread that is mainly driven by scope and build-up logic. Some estimates appear to be closer to a narrow retail-only view or use a conservative price progression, while others lean on broader category mapping that can lift the number if adjacent frozen desserts are mixed in. Currency timing also matters, because converting local prices at different average exchange rates can shift the total for the same year.
Benchmark comparison
| Source | Market Size | Gaps in Research Methodology |
|---|---|---|
| Mordor Intelligence | USD 1.45 B (2025) | |
| Regional Consultancy A | USD 0.45 B (2025) | This figure appears to undercount foodservice and specialty outlets and may rely on a tighter definition that emphasizes packaged retail sales, which can reduce both volume and realized pricing in the total. |
| Global Consultancy B | USD 2.27 B (2023) | The base year and scope likely differ, and the estimate may include a wider frozen dessert mapping or broader channel capture across APAC, which can inflate totals when compared with a frozen-yogurt-only build. |
The table shows that the largest gap comes from what is counted as frozen yogurt and how channel coverage is treated, and in Mordor Intelligence's model, value is counted only for frozen yogurt sold through the defined retail and foodservice channels in the covered Asia Pacific countries, with dairy-based and non-dairy products separated so adjacent frozen desserts are not pulled in. With clear year labeling, repeatable variables, and check-backs from interviews, the resulting number stays easier to reconcile against country and channel realities.
Key Questions Answered in the Report
What is the forecast value of the Asia-Pacific frozen yogurt market in 2031?
The market is projected to reach USD 2.67 billion by 2031.
Which country currently leads regional sales?
China held 39.30% of value in 2025.
Which product type is growing fastest?
Plant-based frozen yogurt is expected to expand at an 11.29% CAGR through 2031.
Why are on-trade outlets gaining share?
Gen Z consumers treat frozen-yogurt parlors as social venues, lifting on-trade growth to 12.03% CAGR.
What technology reduces cold-chain spoilage?
Yili’s ambient-temperature probiotic stabilization lets products survive brief power outages without losing viability.