Market Overview
| Study Period | 2018 - 2031 |
|---|---|
| Base Year For Estimation | 2025 |
| Forecast Data Period | 2026 - 2031 |
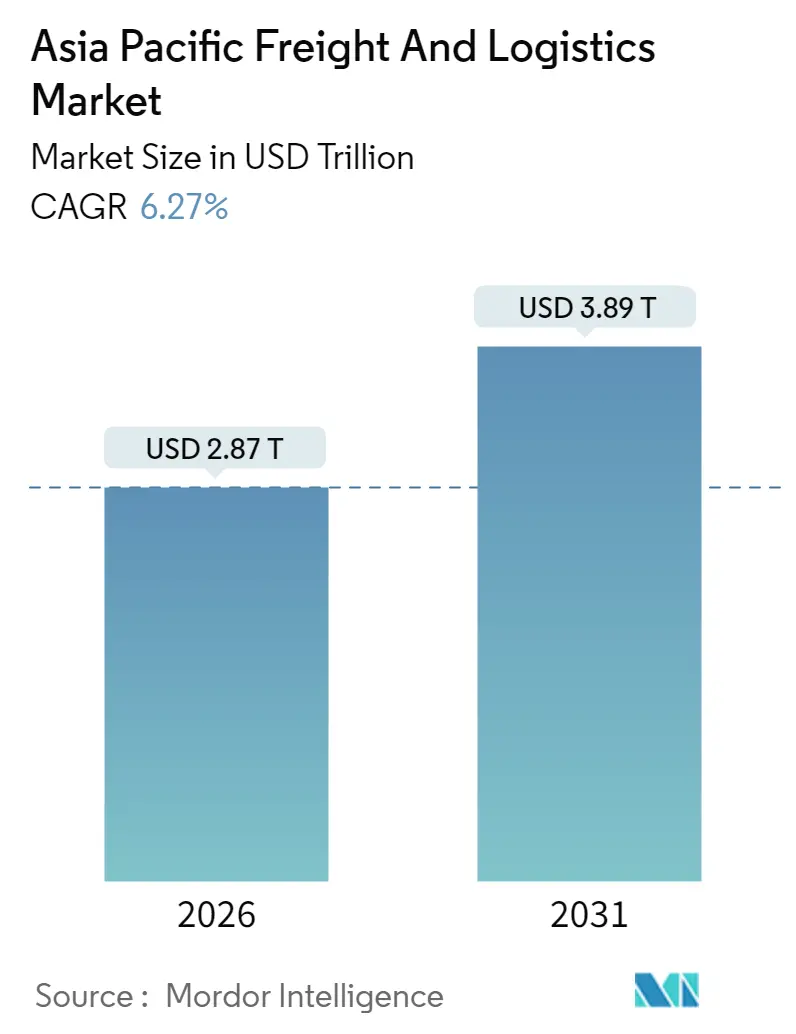
| Market Size (2026) | USD 2868.36 Trillion |
| Market Size (2031) | USD 3887.58 Trillion |
| Growth Rate (2026 - 2031) | 6.27% CAGR |
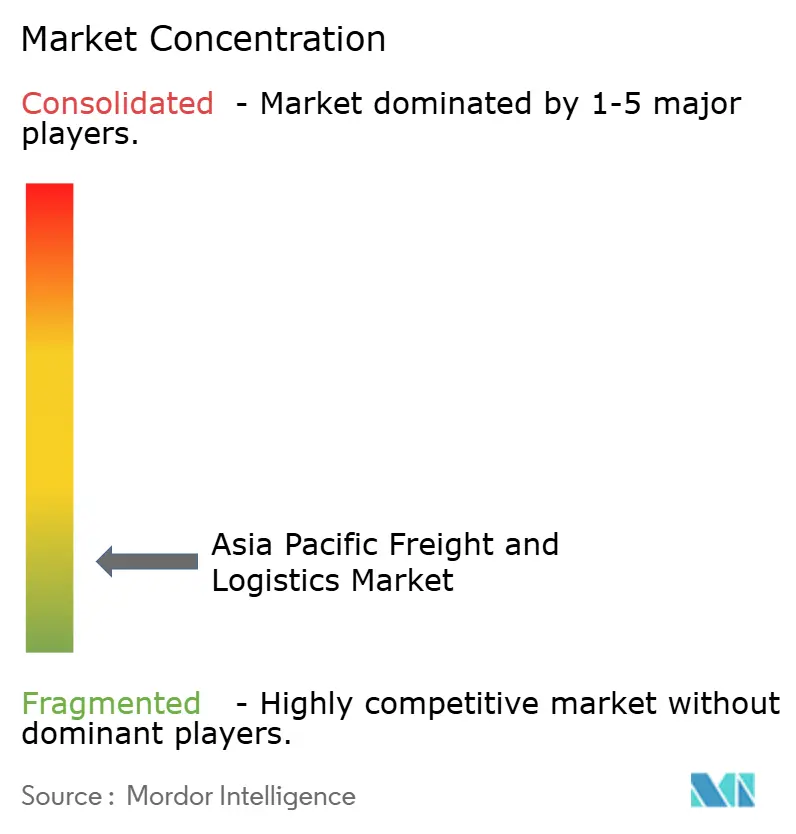
| Market Concentration | Low |
Major Players *Disclaimer: Major Players sorted in no particular order Image © Mordor Intelligence. Reuse requires attribution under CC BY 4.0. | |
Asia Pacific Freight And Logistics Market Analysis by Mordor Intelligence
Asia-Pacific freight and logistics market size in 2026 is estimated at USD 2,868.36 billion, growing from 2025 value of USD 2,698.38 billion with 2031 projections showing USD 3,887.58 billion, growing at 6.27% CAGR over 2026-2031. Robust intra-Asian trade, the re-ordering of global supply chains, and policy-driven infrastructure upgrades position the Asia-Pacific freight and logistics market for sustained expansion. Manufacturing relocations into Southeast Asia, coupled with rising cross-border e-commerce volumes, are reshaping route density and service mix while tempering reliance on the traditional East-West mainline. At the same time, public-sector megaprojects are unlocking latent capacity in ports, highways, and rail links, reinforcing the long-term competitiveness of the Asia-Pacific freight and logistics market. Heightened climate and security risks are prompting shippers to diversify nodes and invest in digital visibility, supporting demand for higher-margin end-to-end logistics solutions across the Asia-Pacific freight and logistics market.
Key Report Takeaways
- By logistics function, freight transport commanded 60.12% of the Asia-Pacific freight and logistics market share in 2025, whereas courier, express, and parcel (CEP) services are advancing at a 6.74% CAGR between 2026-2031.
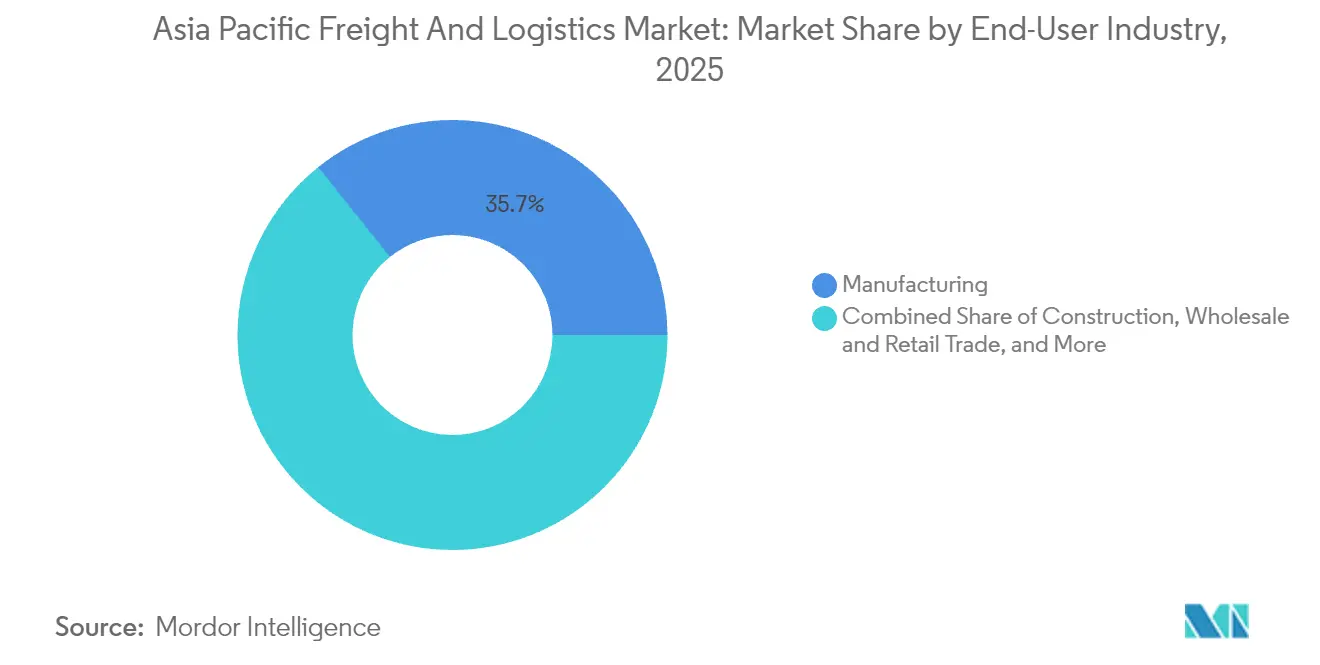
- By end user industry, manufacturing captured 35.74% of the Asia-Pacific freight and logistics market size in 2025, while wholesale and retail trade is projected to post the fastest 6.62% CAGR between 2026-2031.
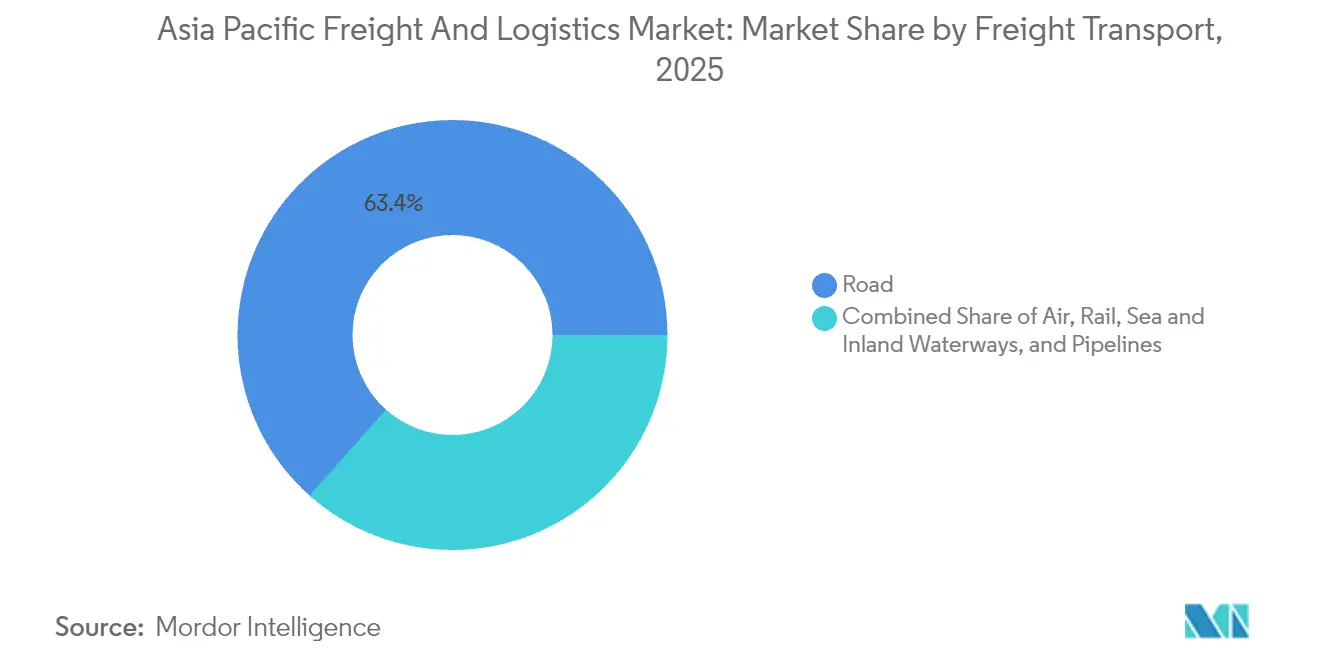
- By freight transport mode, road freight transport held 63.41% of the revenue share in 2025; air freight is the quickest-expanding mode with a 7.02% CAGR between 2026-2031.
- By freight forwarding mode, sea and inland waterway freight forwarding controlled 65.62% of 2025 revenue, yet air freight forwarding is growing at a 6.54% CAGR between 2026-2031.
- By CEP destination, domestic CEP made up 64.15% of revenue share in 2025; international CEP is set to climb at a 6.96% CAGR between 2026-2031.
- By warehousing and storage, non-temperature controlled warehousing dominated with a 91.44% stake in 2025, whereas temperature controlled warehousing will rise 6.44% CAGR between 2026-2031.
- By country, China led geographically with 48.05% of 2025 revenue; India is projected to grow the fastest at 9.21% CAGR between 2026-2031.
Note: Market size and forecast figures in this report are generated using Mordor Intelligence’s proprietary estimation framework, updated with the latest available data and insights as of January 2026.
Asia Pacific Freight And Logistics Market Trends and Insights
Drivers Impact Analysis
| Driver | (~) % Impact on CAGR Forecast | Geographic Relevance | Impact Timeline |
|---|---|---|---|
| Exploding e-commerce parcel volumes | +1.8% | China, India, Southeast Asia | Short term (≤ 2 years) |
| Manufacturing shift and near-shoring into SE Asia | +1.2% | Vietnam, Thailand, Indonesia | Medium term (2-4 years) |
| Government megaprojects upgrading ports, rail and roads | +0.9% | Thailand, Vietnam, Indonesia, Malaysia | Long term (≥ 4 years) |
| End-to-end supply-chain digitalization and visibility tools | +0.7% | Singapore, Japan, South Korea | Medium term (2-4 years) |
| Cross-border B2B2C hubs enabling 3-5-day delivery | +0.5% | ASEAN+3 corridors | Short term (≤ 2 years) |
| ESG-linked green-corridor incentives and sustainable-fuel credits | +0.3% | Japan, Australia, Singapore | Long term (≥ 4 years) |
| Source: Mordor Intelligence | |||
Understand The Key Trends Shaping This Market
Download PDF
Exploding E-commerce Parcel Volumes
Surging mobile adoption and marketplace penetration are pushing parcel counts to record highs across urban Asia. Leading CEP operators reported double-digit shipment growth in 2025, prompting rapid roll-out of automated sortation centers and micro-fulfillment hubs. Larger parcel densities are compressing unit delivery costs, enabling competitive pricing that further accelerates online spending. Urban governments are responding with curbside delivery zones and off-peak freight rules to manage congestion, indirectly reinforcing demand for technology-enabled last-mile platforms. Together, these forces are moving the Asia-Pacific freight and logistics market toward a higher-frequency, small-lot delivery paradigm.
Manufacturing Shift and Near-shoring into Southeast Asia
Foreign direct investment into ASEAN surpassed USD 329 billion in 2024, as electronics, automotive, and renewable-energy firms diversified production footprints away from single-country concentration[1]ASEAN Secretariat, “ASEAN FDI Inflows Reach Record High of US $329 Billion in 2024,” asean.org. Vietnam’s export growth and Thailand’s Eastern Economic Corridor exemplify how modern industrial clusters are creating fresh flows of components and finished goods that require bonded warehousing, special-handling protocols, and synchronized multimodal capacity. As near-shored plants mature, backhaul imbalances are narrowing, unlocking rate efficiencies for carriers and forwarding agents across the Asia-Pacific freight and logistics market.
Government Megaprojects Upgrading Ports, Rail and Roads
Regional governments are deploying multi-billion-dollar programs that expand berth depth, dual-track rail, and expressway systems. Thailand’s THB 2.68 trillion (USD 77.8 billion) transport blueprint and Vietnam’s planned high-speed rail line are illustrative. These projects generate immediate heavy-lift cargo demand while laying structural foundations that lift capacity ceilings and reduce transit times over the long term[2]Cello Square, “2025 Logistics Trends in Southeast Asia,” cellosquare.com. The prospective Thai land bridge, for example, could shave several days off Asia-Europe corridors, spurring network redesign and incremental throughput across the Asia-Pacific freight and logistics market.
End-to-End Supply-chain Digitalization and Visibility Tools
Logistics providers are moving from basic track-and-trace to predictive orchestration using IoT sensors and AI analytics. In Vietnam, industry investment in digital tools reached USD 750 million in 2024, with early adopters cutting operating costs by up to 40%[3]Vietnam Logistics Association, “Digital Transformation in Vietnam Logistics 2024,” vla.com.vn. Blockchain trials at regional ports demonstrate tangible clearance-time reductions, while integrated control towers improve on-time performance and exception handling. Widespread adoption is expected to widen the performance gap between digitally advanced operators and legacy rivals.
Restraints Impact Analysis
| Restraint | (~) % Impact on CAGR Forecast | Geographic Relevance | Impact Timeline |
|---|---|---|---|
| Fragmented customs regimes and paperwork | -0.8% | ASEAN core, China-ASEAN corridors | Medium term (2-4 years) |
| Chronic congestion at tier-1 ports / airports | -1.1% | Singapore, Hong Kong, Shanghai, Mumbai | Short term (≤ 2 years) |
| Carbon-pricing schemes hiking export freight costs | -0.4% | Japan, Australia, Singapore | Long term (≥ 4 years) |
| Digital-talent shortages in tier-2/3 logistics nodes | -0.6% | Indonesia, Philippines, Thailand interior | Medium term (2-4 years) |
| Source: Mordor Intelligence | |||
Fragmented Customs Regimes and Paperwork
Despite the ASEAN Single Window, disparate documentation rules still add several days to intra-regional transit. Logistics costs in some markets exceed 16% of GDP, driven largely by clearance delays and manual processes. While blockchain pilots and trusted-trader programs show promise, uneven implementation hinders scalability. Smaller exporters shoulder disproportionate compliance burdens, constraining their participation in the Asia-Pacific freight and logistics market. Progress toward harmonized digital customs standards remains a medium-term necessity.
Chronic Congestion at Tier-1 Ports / Airports
Throughput at Singapore surpassed 40 million TEU in 2024, pushing vessel wait times up to a week during peak surges[4]Phillip Hazell, “DP World Opens Singapore Warehouse to Boost APAC Logistics,” mhdsupplychain.com.au. Rerouted cargo from geopolitical disruptions compounds yard congestion and stretches equipment cycles. Similar choke points afflict Shanghai and Hong Kong, while major air gateways struggle to add cold-chain and express-parcel docks fast enough. Costly schedule buffers erode carrier margins and undermine time-definite service commitments, making decongestion a high-priority operational challenge for the Asia-Pacific freight and logistics market.
Segment Analysis
By End User Industry: Manufacturing Leads While Retail Accelerates
Manufacturing’s 35.74% revenue share in 2025 derives from electronics, automotive, and machinery chains requiring synchronized cross-border logistics. The segment anchors contract rates and builds base density for forwarders, warehousing providers, and carriers.
Wholesale and retail trade, however, is the fastest-expanding customer pool with a 6.62% CAGR (2026-2031). Omnichannel retailers rely on responsive fulfillment frameworks, driving investment in regional distribution centers, inventory postponement strategies, and returns management capacity. These needs are recasting service menus across the Asia-Pacific freight and logistics market.
Note: Segment shares of all individual segments available upon report purchase
Get Detailed Market Forecasts at the Most Granular Levels
Download PDF
By Logistics Function: Freight Transport Dominance Faces CEP Disruption
Freight transport accounted for 60.12% of 2025 revenue share, underscoring its anchor role in the Asia-Pacific freight and logistics market size. Bulk flows of manufacturing inputs and finished goods keep full-truckload and container lanes dense, yet growth is tapering as demand shifts toward smaller, faster consignments.
Courier, express, and parcel revenues are projected to rise 6.74% CAGR between 2026-2031, powered by digital-commerce momentum and rising consumer service expectations. Integrators are retrofitting hubs with high-speed sorters and autonomous guided vehicles to process soaring parcel counts. Over time, modal allocation is expected to tilt further toward CEP, moderating freight transport’s share of the Asia-Pacific freight and logistics market.
By CEP Destination: Domestic Density Propels International Expansion
Domestic parcels accounted for 64.15% of 2025 revenue share, supported by dense urban populations and sophisticated e-commerce ecosystems. High stop densities enable route optimization and cost efficiencies for last-mile fleets.
International CEP is the fastest-growing niche at 6.96% CAGR (2026-2031), as small sellers tap cross-border marketplaces. Customs simplification and trade-lane collaboration will be essential to unlocking full potential, positioning CEP as an increasingly pivotal pillar of the Asia-Pacific freight and logistics market.
By Warehousing and Storage: Temperature Control Expansion Accelerates
Non-temperature-controlled warehouses dominate with a 91.44% revenue share in 2025, housing general merchandise and industrial goods across the region. Network expansion in secondary cities is improving spatial coverage and lowering transport lead times.
Cold-chain capacity is set to advance at a 6.44% CAGR between 2026-2031, driven by vaccine distribution, biologics manufacturing, and fresh-food e-grocery fulfillment. Operators are installing real-time temperature monitoring and redundant power to meet stringent compliance standards, heightening capital barriers yet yielding premium margins in the Asia-Pacific freight and logistics market.
By Freight Transport Mode: Road Networks Dominate Amid Rising Air Demand
Road freight services controlled 63.41% of 2025 revenue, benefiting from last-mile reach and flexible routings across dense metropolitan clusters. Investments in expressways and cross-border corridors are expected to sustain road dominance for short-haul and domestic moves.
Air freight, projected to expand at a 7.02% CAGR between 2026-2031, is winning high-value components and e-commerce payloads. Airport infrastructure upgrades and dedicated freighter conversions are narrowing capacity gaps, though slot constraints remain acute. The resulting modal split will continue to evolve, reinforcing the integrated nature of the Asia-Pacific freight and logistics market.
Note: Segment shares of all individual segments available upon report purchase
Get Detailed Market Forecasts at the Most Granular Levels
Download PDF
By Freight Forwarding Mode: Sea Lanes Remain Core Despite Air Competition
Sea and inland waterway freight forwarding contributed 65.62% of revenue in 2025, reflecting favorable cost economics for large-volume shipments. Carrier alliances, mega-vessels, and expanded terminals anchor this supremacy.
Air freight forwarding is maintaining a 6.54% CAGR growth between 2026-2031 as just-in-time production and critical spare parts logistics prioritize speed over freight rates. Digital rate-search platforms are enhancing price transparency, intensifying competition, and broadening access for SMEs across the Asia-Pacific freight and logistics market.
Geography Analysis
China held 48.05% of regional revenue in 2025, underpinned by its manufacturing depth, integrated infrastructure, and large domestic consumption base. Ongoing e-commerce sophistication is catalyzing automation investments in fulfillment centers, while exporters leverage direct-to-consumer channels into neighboring economies, expanding service scope within the Asia-Pacific freight and logistics market.
India is poised for the fastest 9.21% CAGR between 2026-2031, fueled by industrial corridor initiatives, digital-commerce uptake, and policy measures aimed at trimming logistics costs toward a single-digit GDP share. Capital inflows into multimodal parks and electronic toll collection systems are smoothing interstate flows and widening value-added logistics demand across the subcontinent.
Southeast Asia, led by Vietnam, Thailand, Malaysia, and Indonesia, is capturing manufacturing spillovers that diversify global supply lines. Mega-projects like Vietnam’s deep-water terminals and Thailand’s land bridge underline the sub-region’s strategic posture, while Australia and Japan focus on automation and sustainability retrofits to offset labor shortages. Collectively, these dynamics reinforce the distributed growth profile of the Asia-Pacific freight and logistics market.
Competitive Landscape
Market structure remains fragmented, with global integrators, regional champions, and digital disruptors vying for share. DHL, FedEx, and UPS retain strongholds in premium express and international freight, yet local specialists leverage intimate market knowledge and governmental support to out-maneuver incumbents in last-mile and domestic segments.
Technology is the key differentiator. CJ Logistics has deployed robotics and autonomous driving pilots that trim handling times and boost throughput. Blockchain adoption at Vietnamese ports and AI-driven route optimization at Singaporean hubs illustrate how advanced tools elevate service reliability and transparency across the Asia-Pacific freight and logistics market.
Strategic consolidation is accelerating. DSV’s agreement to acquire DB Schenker for USD 15.8 billion will create a formidable scale player with enhanced procurement power and network reach. Niche opportunities persist in cold-chain, renewable-energy project cargo, and cross-border e-commerce fulfillment, where technical and regulatory entry barriers allow specialized providers to earn above-market margins.
Asia Pacific Freight And Logistics Industry Leaders
DHL Group
Kuehne+Nagel
Sinotrans, Ltd.
SF Express (KEX-SF)
NYK (Nippon Yusen Kaisha) Line
- *Disclaimer: Major Players sorted in no particular order
Need More Details on Market Players and Competitors?
Download PDF
Recent Industry Developments
- May 2025: DP World inaugurated a multipurpose warehouse in Singapore, linking its port and rail assets to offer integrated solutions for e-commerce merchants.
- December 2024: CJ Logistics set out five priorities, including automation scale-up, Southeast Asian network expansion via local alliances, and initial deployment of hydrogen-powered trucks.
- August 2024: DHL partnered with Microsoft, Google Cloud, and Salesforce to embed AI route optimization, carbon tracking, and renewable power sourcing throughout its regional operations.
- January 2024: Kerry Logistics Network cut Asia–Europe lead times through network reconfiguration and process upgrades, improving competitive positioning in time-sensitive forwarding.
Asia Pacific Freight And Logistics Market Report Scope
Agriculture, Fishing, and Forestry, Construction, Manufacturing, Oil and Gas, Mining and Quarrying, Wholesale and Retail Trade, Others are covered as segments by End User Industry. Courier, Express, and Parcel (CEP), Freight Forwarding, Freight Transport, Warehousing and Storage are covered as segments by Logistics Function. Australia, China, India, Indonesia, Japan, Malaysia, Thailand, Vietnam are covered as segments by Country.End User Industry
| Agriculture, Fishing, and Forestry |
| Construction |
| Manufacturing |
| Oil and Gas, Mining and Quarrying |
| Wholesale and Retail Trade |
| Others |
Logistics Function
| Courier, Express, and Parcel (CEP) | By Destination Type | Domestic |
| International | ||
| Freight Forwarding | By Mode of Transport | Air |
| Sea and Inland Waterways | ||
| Others | ||
| Freight Transport | By Mode of Transport | Air |
| Pipelines | ||
| Rail | ||
| Road | ||
| Sea and Inland Waterways | ||
| Warehousing and Storage | By Temperature Control | Non-Temperature Controlled |
| Temperature Controlled | ||
| Other Services | ||
Country
| Australia |
| China |
| India |
| Indonesia |
| Japan |
| Malaysia |
| Thailand |
| Vietnam |
| Rest of Asia-Pacific |
| End User Industry | Agriculture, Fishing, and Forestry | ||
| Construction | |||
| Manufacturing | |||
| Oil and Gas, Mining and Quarrying | |||
| Wholesale and Retail Trade | |||
| Others | |||
| Logistics Function | Courier, Express, and Parcel (CEP) | By Destination Type | Domestic |
| International | |||
| Freight Forwarding | By Mode of Transport | Air | |
| Sea and Inland Waterways | |||
| Others | |||
| Freight Transport | By Mode of Transport | Air | |
| Pipelines | |||
| Rail | |||
| Road | |||
| Sea and Inland Waterways | |||
| Warehousing and Storage | By Temperature Control | Non-Temperature Controlled | |
| Temperature Controlled | |||
| Other Services | |||
| Country | Australia | ||
| China | |||
| India | |||
| Indonesia | |||
| Japan | |||
| Malaysia | |||
| Thailand | |||
| Vietnam | |||
| Rest of Asia-Pacific | |||
Need A Different Region or Segment?
Customize Now
Market Definition
- Agriculture, Fishing, and Forestry (AFF) - This end user industry segment captures the external (outsourced) logistics expenditure incurred by the AFF industry players. The end user players considered are the establishments primarily engaged in growing crops, raising animals, harvesting timber, harvesting fish & other animals from their natural habitats and providing related support activities. Herein, Logistics Service Providers (LSPs) play a crucial role in acquisition, storage, handling, transportation, and distribution activities for the optimal & continuous flow of inputs (seeds, pesticides, fertilizers, equipment, and water) from manufacturers or suppliers to the producers and smooth flow of output (produce, agro-goods) to distributors/ consumers. This includes both termperature controlled and non-temperature controlled logistics, as and when required according to the shelf life of goods being transported or stored.
- Construction - This end user industry segment captures the external (outsourced) logistics expenditure incurred by the construction industry players. The end user players considered are the establishments primarily engaged in constructing, repairing and renovating residential & commercial buildings, infrastructure, engineering works, subdividing and developing land. Logistics Service Providers (LSPs) play a crucial role in increasing profitability of construction projects by maintaing the inventory of raw materials & equipment, time-critical supplies and by providing other value added services for effective project management.
- Courier, Express, and Parcel - The Courier, Express, and Parcel services, often called as CEP Market, refers to the logistics and postal service providers which specialize in moving small goods (parcels/packages). It captures the overall market size (USD) and market volume (number of parcels) of (1) the shipments/parcels/packages which are under 70kgs/ 154lbs weight, (2) Business Customer packages viz. Business-to-Business (B2B) & Business-to-Consumer (B2C) as well as private customer packages (C2C), (3) non-express parcel delivery services (Standard and Deferred) as well as express parcel delivery services (Day-Definite-Express and Time-Definite-Express), (4) domestic as well as international parcels.
- Demographics - To analyse total addressable market demand, population growth & forecasts have been studied and presented in this industry trend. It represents population distribution across categories like gender (male/female), development area (urban/rural), major cities among other key parameters like population density and final consumption expenditure (growth and share % of GDP). This data has been used for assessing the fluctations in demand & consumption expenditure, and the major hotspots (cities) of potential demand.
- Export Trends and Import Trends - Overall logistics performance of an economy is positively and significantly (statistically) correlated to its trade performance (exports and imports). Hence, in this industry trend, total value of trade, major commodities/ commodity groups and the major trade partners, for the studied geography (country or region as per the scope of report) have been analysed alongside the impact of major trade/logistics infrastructure investments & regulatory environment.
- Freight Forwarding - Freight forwarding which herein refers to the freight transportation arrangement (FTA) industry includes establishments primarily engaged in arranging & tracking transportation of freight between shippers and carriers. Logistics Service Providers (LSPs) considered are freight forwarders, NVOCCs, custom brokers and marine shipping agents. Others segment under Freight Forwarding captures the revenue earned through value added services of FTA like custom brokerage/clearance activities, preparation of freight related documentation, consolidation-deconsolidation of goods, cargo insurance & compliance, arrangement of warehousing & storage, liasing with shippers, and freight forwarding through other modes of transport viz. road and rail.
- Freight Pricing Trends - Freight pricing by mode of transport (USD/tonkm), over the review period, has been presented in this industry trend. The data has been used in assessing the inflationary environment, impact on trade, freight turnover (tonkm), freight and logistics market demand by mode of transport segments and hence the overall freight and logistics market size.
- Freight Tonnage Trends - Freight tonnage (weight of goods in tons) handled by mode of transport, over the review period, has been presented in this industry trend. The data has been used as one of the parameters apart from average distance per shipment (km), freight volume (tonkm), and freight pricing (USD/tonkm) to assess the freight transport market size.
- Freight Transport - Freight Transport refers to the hiring of a logistics service provider (outsourced logistics) for the transport of commodities (raw materials/final/intermediate/finished goods including both solids and fluids) from the origin to a destination within the country (domestic) or cross-border (international).
- Freight and Logistics - External expenditure on (or outsourced) facilitation of freight transport (freight transportation), arrangement of freight transport through an agent (freight forwarding), warehousing and storage (temperature controlled or non-temperature controlled), CEP (domestic or international courier, express and parcel) and other value-added logistics services involved in the transportation of commodities (raw materials or finished goods including both solids and fluids) from the origin to a destination within the country (domestic) or cross-border (international), through one or more modes of transportation viz. road, rail, sea, air and pipelines constitute freight and logistics market.
- Fuel Price - Fuel price spikes can cause delays and diruption for logistics service providers (LSPs), while drops in the same can result in higher short-term profitability and increased market rivalry to offer consumers with the best deals. Hence, the fuel price variations have been studied over the review period and presented along with the causes as well as market impacts.
- GDP Distribution by Economic Activity - Nominal Gross Domestic Product and distribution of the same, across major economic sectors in the geography studied (country or region as per scope of the report) have been studied and presented in this industry trend. As GDP is positively related to the profitability and growth of logistics industry, this data has been used in adjunction to the input-output tables/ supply-use tables for analyzing the potential major contributing sectors towards the logistics demand.
- GDP Growth by Economic Activity - Growth of Nominal Gross Domestic Product across major economic sectors, for the geography studied (country or region as per scope of the report) have been presented in this industry trend. This data has been utilized for assessing the growth of logistics demand from all the market end users (economic sectors considered here).
- Inflation - Variations in both Wholesale Price Inflation (YoY change in producer price index) and Consumer Price Inflation have been presented in this industry trend. This data has been used to assess the inflationary environment as it plays a vital role in smooth functioning of the supply chain, directly impacting the logistics operational cost components e.g., pricing of tyres, driver wages & benefits, energy/fuel prices, maintenace costs, toll charges, warehousing rents, custom brokerage, forwarding rates, courier rates etc. hence impacting the overall freight and logistics market.
- Infrastructure - As infrastructure plays a vital role in an economy's logistics performance, variables like length of roads, distribution of road length by surface category (paved v/s unpaved), distribution of road length by road classification (expressways v/s highways v/s other roads), rail length, volume of containers handled by major ports and tonnage handled by major airports have been analysed and presented in this industry trend.
- Key Industry Trends - The report section named "Key Industry Trends" include all the key variables/parameters studied to better analyze the market size estimates and forecasts. All the trends have been presented in the form of data points (time series or latest available data points) along with analysis of the paramter in the form of concise market relevant commentary, for the geography studied (country or region as per the scope of report).
- Key Strategic Moves - The action taken by a company to differentiate from its competitor or used as a general strategy is referred to as a key strategic move (KSM). This includes (1) Agreements (2) Expansions (3) Financial Restructuring (4) Mergers and Acquisitions (5) Partnerships, and (6) Product Innovations. Key players (Logistics Service Providers, LSPs) in the market have been shortlisted, their KSM have been studied and presented in this section.
- Liner Shipping Bilateral Connectivity Index - It indicates a country pair's integration level into global liner shipping networks and plays a crucial role in determining bilateral trade, which in turn potentially contributes toward the prosperity of a country and its surrounding region. Hence the major economies connected to the country/ region as per scope of the report, have been analyzed and presented in "Liner Shipping Connectivity" industry trend.
- Liner Shipping Connectivity - This industry trend analyses the state of connectivity to the global shipping networks based on the status of maritime transport sector. It includes the analysis of liner shipping connectivity, bilateral shipping connectivity, and port liner shipping connectivity indices for the geography (country/ region as per scope of the report) over the review period.
- Liner Shipping Connectivity Index - It indicates how well countries are connected to global shipping networks based on the status of their maritime transport sector. It is based on five components of the maritime transport sector: (1) The number of shipping lines servicing a country, (2) The size of the largest vessel used on these services (in TEUs), (3) The number of services connecting a country to the other countries, (4) The total number of vessels deployed in a country, (5) The total capacity of those vessels (in TEUs).
- Logistics Performance - Logistics Performance and Logistics Costs are the backbone of trade, and influences trade costs, making countries compete globally. Logistics performance is influenced by market wide adopted supply chain management strategies, government services, investments & policies, fuel/ energy costs, inflationary environment etc. Hence, in this industry trend, the logistics performance of the geography studied (country/ region as per the scope of report) has been analysed and presented over the review period.
- Major Truck Suppliers - Market share of truck brands is influenced by factors like geographical preferences, portfolio of truck types, truck prices, local production, truck repair & maintenance service peneteration, customer support, technological innovations (like electric vehicles, digitalization, autonomous trucks), fuel efficiency, financing options, annual maintenance costs, availability of substitutes, marketing startegies etc. Hence, the distribution (share % for base year of the study) of truck sales volume for leading truck brands and commentary on current market scenario & market anticipation over the forecast period have been presented in this industry trend.
- Manufacturing - This end user industry segment captures the external (outsourced) logistics expenditure incurred by the Manufacturing industry players. The end user players considered are the establishments primarily engaged in the chemical, mechanical or physical transformation of materials or substances into new products. Logistics Service Providers (LSPs) play a crucial role in maintaining a smooth flow of raw materials across the supply chain, enabling timely delivery of finished goods to distributors or end customers and storing & supplying the raw materials to clients for just-in-time manufacturing.
- Maritime Fleet Load Carrying Capacity - Maritime fleet load carrying capacity depicts the development state of an economy's maritime infrastructure & trade. It is influenced by factors like volume of production, international trade, major end user industries, maritime connectivity, environmental regulations, investments in port infrastructure development, port container cargo handling capacity etc. This industry trend represents the maritime fleet load carrying capacity by type of ship viz. container ships, oil tankers, bulk carriers, general cargo, among other types alongwith the influencing factors for the geography studied (country/ region as per scope of the report), over the review period.
- Modal Share - Freight Modal Share is influenced by factors like modal productivity, government regulations, containerization, distance of shipment, temperature control requirements, type of goods, international trade, terrain, speed of delivery, shipment weight, bulk shipments, etc. Also, modal share by tonnage (tons) and modal share by freight turnover (ton-km) differ as per average distance of shipments, weight of major commodity groups transported in the economy and number of trips. This industry trend represents the distribution of freight transported by mode of transport (tons as well as ton-km), for the study base year.
- Oil and Gas, Mining and Quarrying - This end user industry segment captures the external (outsourced) logistics expenditure incurred by the extraction industry players. The end user players considered are the establishments that extract naturally occurring mineral solids, such as coal and ores; liquid minerals, such as crude petroleum; and gases, such as natural gas. Logistics Service Providers (LSPs) covers entire phases from upstream to downstream and plays a crucial role in the transportation of machinery, drilling equipments, extracted minerals, crude oil & natural gas and refined/ processed products from one place to another.
- Other End Users - Other end user segment captures the external (outsourced) logistics expenditure incurred by the financial services (BFSI), real estate, educational services, healthcare, and professional services (administrative, waste management, legal, architectural, engineering, design, consulting, scientific R&D). Logistics Service Providers (LSPs) plays a crucial role in the reliable movement of supplies and documents to/from these industries such as transporting any equipment or resources required, shipping confidential documents and files, movement of medical goods & supplies (surgical supplies and instruments, including gloves, masks, syringes, equipment) to name a few.
- Other Services - Other Services segment captures revenue earned through (1) Value added services (VAS) for freight transportation by road, rail, air and sea & inland waterways, (2) VAS for marine cargo transportation (operation of terminal facilities such as harbours and piers, operation of waterway locks, navigation, pilotage and berthing activities, lighterage, salvage activities, lighthouse activities, among other miscellaneous support activities), (3) VAS for land freight transportation (operation of terminal facilities such as railway stations, stations for the handling of goods, operation of railroad infrastructure, switching and shunting, towing and road side assistance, liquefaction of gas for transportation purposes, among other miscellaneous support activities), (4) VAS for air cargo transportation (operation of terminal facilities such as airway terminals, airport and air-traffic-control activities, ground service activities on airfields, runway maintenance, inspection/ ferrying/ maintenance/ testing of aircrafts, aircraft fuelling services, among other miscellaneous support activities), (5) VAS for warehousing and storage service (operation of grain silos, general merchandise warehouses, refrigerated warehouses, storage tanks etc., storage of goods in foreign trade zones, blast freezing, crating goods for shipping, packing and preparing goods for shipping, labelling and/or imprinting the package, kit assembling and packaging services, among other miscellaneous support activities), and (6) VAS for courier, express and parcel service (pickup, sorting).
- Port Calls and Performance - The performance of ports is key to an economy's freight movement, trade, global connectivity, successful growth strategies, investment attractiveness for production & distribution systems, and thus affects GDP, employment, per capita income and industrial growth. Hence, the port perfomance parameters like median time spent by vessels in the ports; average age, size, cargo carrying capacity, container carrying capacity, of vessels entering the ports, port calls, and container port throughput have been analysed and presented in this industry trend.
- Port Liner Shipping Connectivity Index - It reflects a port's position in the global liner shipping network, wherein a higher value of index is associated with better connectivity. Efficient and well-connected ports (1) contribute towards minimizing transport costs, linking supply chains and supporting international trade, (2) pave the way for economies of scale and development of expertise by permitting producers to better exploit possibilities in domestic as well as foreign markets. Hence the major ports of strategic importance, in the country/ region as per scope of the report, have been analyzed and presented in "Liner Shipping Connectivity" industry trend.
- Port Throughput - It reflects the amount of cargo or number of vessels a port handles annually. It can be related to (1) cargo tonnage, (2) container TEU, and (3) vessel calls. Port throughput in terms of total containers handled (TEU's), has been presented in the "Port Calls and Performance" industry trend.
- Producer Price Inflation - It indicates inflation from viewpoint of the producers viz. the average selling price received for their output over a period of time. Annual change (YoY) of producer price index is reported as wholesale price inflation in the "Inflation" industry trend. As WPI captures dynamic price movements in most comprehensive way, it is widely used by governments, banks, industry, business circles and is deemed important in formulation of trade, fiscal and other economic policies. The data has been used in adjunction to consumer price inflation for better understanding the inflationary environment.
- Rest of Asia Pacific - Rest of Asia Pacific captures the outsourced logistics market for (1) Afghanistan, (2) Bangladesh, (3) Bhutan (4) Cambodia (5) Cook Islands (6) Federated State of Micronesia (7) Fiji (8) Kiribati (9) Mongolia (10) Nepal (11) New Caledonia (12) New Zealand (13) Niue (14) North Korea (15) Pakistan (16) Palau (17) Papua New Guinea (18) Philippines (19) Singapore (20) Solomon Islands (21) South Korea (22) Sri Lanka (23) Taiwan (24) Tajikistan (25) Timor-Leste (26) Tonga (27) Turkmenistan (28) Tuvalu (29) Uzbekistan, and (30) Vanuatu
- Segmental Revenue - Segmental Revenue has been triangulated or computed and presented for all the major players in the market. It refers to the freight and logistics market specific revenue earned by the company, over the base year of study, in the geography studied (country or region as per the scope of report). It is computed through the study and analysis of major parameters like financials, service portfolio, employee strength, fleet size, investments, number of countries present in, major economies of concern, etc. that have been reported by the company in its annual reports, webpage. For companies having scarce financial disclosures, paid databases like D&B Hoovers, Dow Jones Factiva have been resorted to and verified through industry/expert interactions.
- Transport and Storage Sector GDP - Value and growth of Transport and Storage Sector GDP has a direct relation to the freight and logistics market size. Hence, this variable has been studied and presented over the review period, in value terms (USD) and as share % of total GDP, in this industry trend. The data has been supported by concise and relevant commentary around the investments, developments, and current market scenario.
- Trends in E-Commerce Industry - Enhanced internet connectivity and boom in smartphone penetration, coupled with increasing disposable incomes, has led to a phenomenal growth in the e-commerce market globally. Online shoppers require fast and efficient delivery of their orders leading to an increase in the demand for logistics services especially e-commerce fulfilment services. Hence, the Gross Merchandise Value (GMV), historial and projected growth, breakup of major commodity groups in e-commerce industry for the studied geography (country or region as per scope of the report) have been analysed and presented in this industry trend.
- Trends in Manufacturing Industry - Manufacturing industry involves the transformation of raw materials into finished products, while logistics industry ensures the efficient flow of raw materials to the factory, and the transport of manufactured products to the distributors & consumers. Demand-Supply of both industries are highly cross-linked and critical for a seamless supply chain. Hence, the Gross Value Added (GVA), breakup of GVA into major manufacturing sectors, and growth of manufacturing industry over the review period have been analysed and presented, in this industry trend.
- Trucking Fleet Size By Type - Market share of truck types is influenced by factors like geographical preferences, major end user industries, truck prices, local production, truck repair & maintenance service peneteration, customer support, technological disruptions (like electric vehicles, digitalization, autonomous trucks) etc. Hence, the distribution (share % for base year of study) of truck parc volume by type of truck, market disruptors, truck manufacturing investments, truck specifications, truck use & import regulations, and market anticipation over the forecast period have been presented in this industry trend.
- Trucking Operational Costs - The prime reasons for measuring/ benchmarking logistics performance of any trucking company are to reduce operational costs and increase profitability. On the other hand, measuring operational costs helps to identify whether and where to make operational changes to control expenses and identify areas for improved performance. Hence, in this industry trend, trucking operational costs and the variables involved viz. driver wages & benefits, fuel prices, repairs & maintenance costs, tyre costs etc. have been studied over the base year of study, and presented for the geography studied (country or region as per the scope of report).
- Warehousing and Storage - Warehousing and storage segment captures revenue earned through the operation of general merchandise, refrigerated and other types of warehousing & storage facilities. These establishments take responsibility for storing the goods and keeping them secure in lieu of charges. Value added services (VAS) they may provide are considered to be a part of the "other services" segment. Here VAS refer to a range of services, related to the distribution of a customer's goods and can include labelling, breaking bulk, inventory control & management, light assembly, order entry & fulfillment, packaging, pick & pack, price marking & ticketing and transportation arrangement.
- Wholesale and Retail Trade - This end user industry segment captures the external (outsourced) logistics expenditure incurred by the wholesalers and retailers. The end user players considered are the establishments primarily engaged in wholesaling or retailing merchandise, generally without transformation, and rendering services incidental to the sale of merchandise. Logistics Service Providers (LSPs) plays a crucial role in the reliable movement of supplies to and finished products from production houses to the distributors and finally to the end customer covering activites like material sourcing, transportation, order fulfillment, warehousing & storage, demand forecasting, inventory management etc.
| Keyword | Definition |
|---|---|
| Axle Load | The axle load of a wheeled vehicle is the total weight bearing on the roadway for all wheels connected to a given axle. |
| Back Haul | Backhaul is the return movement of a transport vehicle from its original destination to its original point of departure. |
| Bill of Lading | A bill of lading is a legal document issued by a carrier to a shipper that details the type, quantity, and destination of the goods being carried. |
| Bunkering | Bunkering is the process of supplying fuel and/or gasoil to be used to power the propulsion system of a ship (such fuel is referred to as bunker). It includes the logistics of loading and distributing the fuel among available shipboard tanks. A person dealing in trade of bunker (fuel) is called a bunker trader. |
| Bunkering Service | Bunkering service is the supply of a requested quality and quantity of bunkers to a ship. |
| C-commerce | C-commerce (Collaborative commerce) describes electronically enabled business interactions among an enterprise’s internal personnel, business partners and customers throughout a trading community. The trading community could be an industry, industry segment, supply chain or supply chain segment. |
| Cabotage | Transport by a vehicle registered in a country performed on the national territory of another country. |
| Cartage Agent | A ground transportation service that provides pickup and delivery of freight in locations not served directly by an air or ocean carrier. |
| Contract logistics | Contract logistics refers to the outsourcing of resource management tasks by one company to a third-party company specializing in logistical matters, such as transportation, warehousing, and order fulfillment. |
| Courier | A business that is used to send messages, packages, etc. Courier service refers to the fast or quick, door to door pickup and delivery service for goods or documents. It can be local or international. A company that provides such delivery services is called a courier company. A courier company hires people to provide their services. Such a person hired by the courier service company is called a courier. |
| Cross docking | Cross docking is a practice in logistics management that includes unloading incoming delivery vehicles and loading the materials directly into outbound delivery vehicles, omitting traditional warehouse logistical practices and saving time and money. |
| Cross Trade | International transport between two different countries performed by a vehicle registered in a third country. A third country is a country other than the country of loading/embarkation and than the country of unloading/disembarkation. |
| Customs Clearance | The procedures involved in getting cargo released by Customs through designated formalities such as presenting import license/permit, payment of import duties and other required documentations by the nature of the cargo such as FCC or FDA approval. |
| Customs seal | Customs seal means a seal, stamp or any other preventive means affixed by customs officials to ensure the inviolability of goods, commercial means of transport or warehouses. |
| Dangerous Goods | Dangerous goods (or hazardous materials or HAZMAT) include flammable liquids/solids, gases, compressed, liquified, dissolved under pressure, corrosives, oxidising substances, explosive substances and articles, substances, which on contact with water, emit flammable gasses, organic peroxides, toxic substances, infectious substances, radioactive materials, miscellaneous dangerous goods and articles. |
| Direct Shipment | Direct shipment is a method of delivering goods from the supplier or the product owner to the customer directly. In most cases, the customer orders the goods from the product owner. This delivery scheme reduces transportation and storage costs, but requires additional planning and administration. |
| Drayage | A drayage is a form of trucking service that connects the different modes of shipping (intermodal), such as ocean freight or air freight. It’s a short-haul trip that transports goods from one place to another, usually before or after its long-haul shipping process. Drayage trucks move cargo to and from various destinations, such as container ships, storage lots, order fulfillment warehouses, and rail yards. Typically, drayage only transports goods in short distances and operates only in one metropolitan area. It also requires only one trucker in a single shift. |
| Dry Docking | Dry docking is a term used for repairs or when a ship is taken to the service yard. During dry docking, the whole ship is brought to a dry land so that the submerged portions of the hull can be cleaned or inspected. |
| Dry van | A dry van is a type of semi-trailer that's fully enclosed to protect shipments from outside elements. Designed to carry palletized, boxed or loose freight, dry vans aren't temperature-controlled (unlike refrigerated “reefer” units) and can't carry oversized shipments (unlike flatbed trailers). |
| Feedering | Transport service whereby loaded or empty containers in a regional are transferred to a “mother ship” for a long-haul ocean voyage. |
| Final Demand | Final demand includes all types of commodities (goods as well as services) consumed as final use and might include personal consumption, or consumption by government, by businesses as capital investment, and as exports. includes all types of commodities (goods as well as services) consumed as final use and might include personal consumption, or consumption by government, by businesses as capital investment, and as exports. |
| First mile Delivery | First mile delivery refers to the first stage of the transportation. This is when the parcel leaves the seller’s warehouse and is taken by the courier pick up agent to process it or take it to the warehouse. Once the package reaches the post office or the courier’s hub, it is then sorted and transported further until it reaches the customer’s doorstep. |
| Fiscal storage services | It means a facility, clearly separated from other premises, where the excise goods are produced, processed, held, received or dispatched under a duty suspension arrangement by an authorized depositor, in the course of his business, under conditions laid down by the customs authorities. |
| Flat Bed | It has a back body that is flatly shaped for easy loading and unloading of goods. The flatbed truck is mostly used to transport heavy, oversized, wide and indelicate goods. |
| Flatbed Truck | A flatbed truck is a type of truck with rigid design. It has a back body that is flatly shaped for easy loading and unloading of goods. The flatbed truck is mostly used to transport heavy, oversized, wide and indelicate goods such as machinery, building supplies or equipment. Due to the truck open body, the goods transported with it must not be vulnerable to rain. By functionality, the flatbed truck is comparable to a flatbed trailer. |
| Freight Transit Time | Transit time is how long it takes for a shipment to be delivered to its final destination after being picked up from a designated pick up point. |
| Halal Logistics | It refers to the process of managing the logistics operations such as fleet management, storage/warehousing, and materials handling according to the principles of Shariah law in ensuring the integrity of the halal products at the point of consumption. |
| Haulage | The commercial transport of goods. |
| Inbound Logistics | Inbound logistics is the way materials and other goods are brought into a company. This process includes the steps to order, receive, store, transport and manage incoming supplies. Inbound logistics focuses on the supply part of the supply-demand equation. |
| Intermediate Demand | Intermediate demand includes goods, services, and maintenance and repair construction sold to businesses, excluding capital investment. |
| International Loaded | Place of loading of goods in reporting country (i.e., country in which the vehicle performing the transport is registered) and place of unloading in a different country. |
| International Unloaded | Place of unloading of goods in reporting country (i.e., country in which the vehicle performing the transport is registered) and place of loading in a different country. |
| Last Mile Delivery | Last mile delivery refers to the very last step of the delivery process when a parcel is moved from a transportation hub to its final destination—which, usually, is a personal residence or retail store. |
| Less than-Truck-Load (LTL) | Less-than-truckload, also known as less-than-load (LTL), is a shipping service for relatively small loads or quantities of freight. An LTL provider combines the loads and shipping requirements of several different companies on their trucks, using a hub-and-spoke system to get goods to their destinations. |
| Locomotives Haluage | The transport of coal, ore, workers, and materials underground by means of locomotive-hauled mine cars. The locomotive may be powered by battery, diesel, compressed air, trolley, or some combination such as battery-trolley or trolley-cable reel. |
| Milkrun | A Milk Run is a delivery method used to transport mixed loads from various suppliers to one customer. Instead of each supplier sending a truck every week to meet the needs of one customer, one truck (or vehicle) visits the suppliers to pick up the loads for that customer. This method of transport got its name from the dairy industry practice, where one tanker used to collect milk from several dairy farms for delivery to a milk processing company. |
| Multi country consolidation | Multi-Country Consolidation (MCC) is a cost-effective solution that consolidates ones cargo from different countries of origin to build Full Container Loads (FCL). MCC is most suitable for companies that import light volumes of goods from multiple countries but want to take advantage of the more economic FCL freight rates. |
| Multi-Modal Logistics | Multimodal transportation or multimodal shipping refers to logistics and freight processes that require multiple modes of transportation. |
| Omni Channel Logistics | Omnichannel distribution is a multichannel approach taken by companies to give customers a way to purchase and receive orders from several sales channels with one-touch seamless integration. Some of the ways include- 1. Buy online, then pick-up at the brick and mortar store; 2. Buy online, then have it delivered to the home or another location; 3.In store purchase, with the delivery either to the home or another location; 4. Drop ship from a warehouse or manufacturing center to store, home or other location; 5.Buy online, then return at store or online; 6. Buy online, then return online. |
| OOG cargo | Out of Gauge (OOG) cargo is any cargo that can not be loaded into six-sided shipping containers simply because it is too large. The term is a very loose classification of all cargo with dimensions beyond the maximum 40HC container dimensions. That is a length beyond 12.05 meters – a width beyond 2.33 meters – or a height beyond 2.59 meters. |
| Other ships | Other ships include: Liquefied petroleum gas carriers, liquefied natural gas carriers, parcel (chemical) tankers, specialized tankers, reefers, offshore supply vessels, tugboats, dredgers, cruise, ferries, other non-cargo ships |
| Other Specialised Cargo | Other specialised goods include pre-slung goods (Goods, one or more items, supplied with a sling or slings), mobile units (Mobile Self Propelled Units, Non Self Propelled Units, unrolled vehicles), oversized equipment load (light and heavy machinery that is often too big or too heavy), high value freight that needs extra protection like electronics, financial services road freight. |
| Outsourced Freight Transport | Transport for hire or reward; The carriage for remuneration of goods. |
| Pallets | Raised platform, intended to facilitate the lifting and stacking of goods. |
| Part load | A part load describes goods which only fills a truck partially. In essence, the quantity of the shipment is bigger than the Less Than Truckload (LTL) shipment. Also, the shipment cannot fully occupy a truck i.e. its capacity is much lower than a Full Truckload (FTL) shipment. |
| Paved Road | Road surfaced with crushed stone (macadam) with hydrocarbon binder or bituminized agents, with concrete or with cobblestone. |
| Q-commerce | Q-commerce, also referred to as quick commerce, is a type of e-commerce where emphasis is on quick deliveries, typically in less than an hour. |
| Quay | A stone or metal platform lying alongside or projecting into water for loading and unloading ships. |
| Recommerce | Recommerce is the selling of previously owned items through online marketplaces to buyers who reuse, recycle or resell them. |
| ReverseLogistics | Reverse logistics is a type of supply chain management that moves goods from customers back to the sellers or manufacturers. |
| Road Freight Transport Service | Hiring a trucking agency for transport of commodities (raw materials or manufactured goods including both solids and liquids) form the origin to a destination within the country (domestic) or cross-border (international) constitutes road freight transport market. The service might be Full-Truck-Load or Less than-Truck-Load, containerized or non-containerized, temperature controlled or non temperature controlled, short haul or long haul. |
| Roll-on/roll-off cargo | Roll-on/roll-off (RORO or ro-ro) ships are cargo ships designed to carry wheeled cargo, such as cars, motorcycles, trucks, semi-trailer trucks, buses, trailers, and railroad cars, that are driven on and off the ship on their own wheels or using a platform vehicle, such as a self-propelled modular transporter. |
| Swap bodies | A swap body, swop body, exchangeable container or interchangeable unit, is one of the types of standard freight containers for road and rail transport. |
| Tank Barge | A non-self-propelled vessel constructed or adapted primarily to carry liquid, solid or gaseous commodities or cargos in bulk in cargo spaces (or tanks) through rivers and inland waterways, and may occasionally carry commodities or cargos through oceans and seas when in transit from one inland waterway to another. The commodities or cargos transported are in direct contact with the tank interior. |
| Tautliner vehicle | Tautliner and curtainsider are used as generic names for curtain sided trucks/trailers. The curtains are permanently fixed to a runner at the top and detachable rails/poles at front and rear, allowing the curtains to be drawn open and forklifts used all along the sides for easy and efficient loading and unloading. When closed for travel, vertical load restraint straps are attached to a rope rail beneath the truck bed, connecting the truck bed and curtain along both sides. Winches at either end of the curtain tension it, hence the 'Tautliner' name. This stops the curtain from flapping or drumming in the wind and can also help retain light loads from slipping sideways. |
| Transloading | Transloading is a shipping term that refers to the transfer of goods from one mode of transportation to another en route to their ultimate destination. |
| Tsubo | A Japanese unit of area equal to 35.58 square feet. |
| Unpaved Road | Road with a stabilized base not surfaced with crushed stone, hydrocarbon binder or bituminized agents, concrete or cobblestone. |
| Vessel Husbandry Services | It includes ship maintenance, repairs, cleaning, upkeep of the hull and rigging and equipment. |
Need More Details on Market Definition?
Ask a Question
Research Methodology
Mordor Intelligence follows a four-step methodology in all our reports.
- Step-1: Identify Key Variables: In order to build a robust forecasting methodology, the variables and factors identified in Step-1 are tested against available historical market numbers. Through an iterative process, the variables required for market forecast are set and the model is built on the basis of these variables.
- Step-2: Build a Market Model: Market-size estimations for the forecast years are in nominal terms. Inflation is not a part of the pricing, and the average selling price (ASP) is kept constant throughout the forecast period for each country.
- Step-3: Validate and Finalize: In this important step, all market numbers, variables and analyst calls are validated through an extensive network of primary research experts from the market studied. The respondents are selected across levels and functions to generate a holistic picture of the market studied.
- Step-4: Research Outputs: Syndicated Reports, Custom Consulting Assignments, Databases & Subscription Platforms

Get More Details On Research Methodology
Download PDF


