
Asia Pacific Formic Acid Market Size and Share
Market Overview
| Study Period | 2021 - 2031 |
|---|---|
| Forecast Data Period | 2026 - 2031 |
| Base Year Market Size (2025) | USD 391.39 Million |
| Market Size (2026) | USD 409.39 Million |
| Market Size (2031) | USD 512.62 Million |
| Growth Rate (2026 - 2031) | 4.60 % |
| Market Concentration | Medium |
Major Players *Disclaimer: Major Players sorted in no particular order Image © Mordor Intelligence. Reuse requires attribution under CC BY 4.0. | |
Asia Pacific Formic Acid Market Analysis by Mordor Intelligence
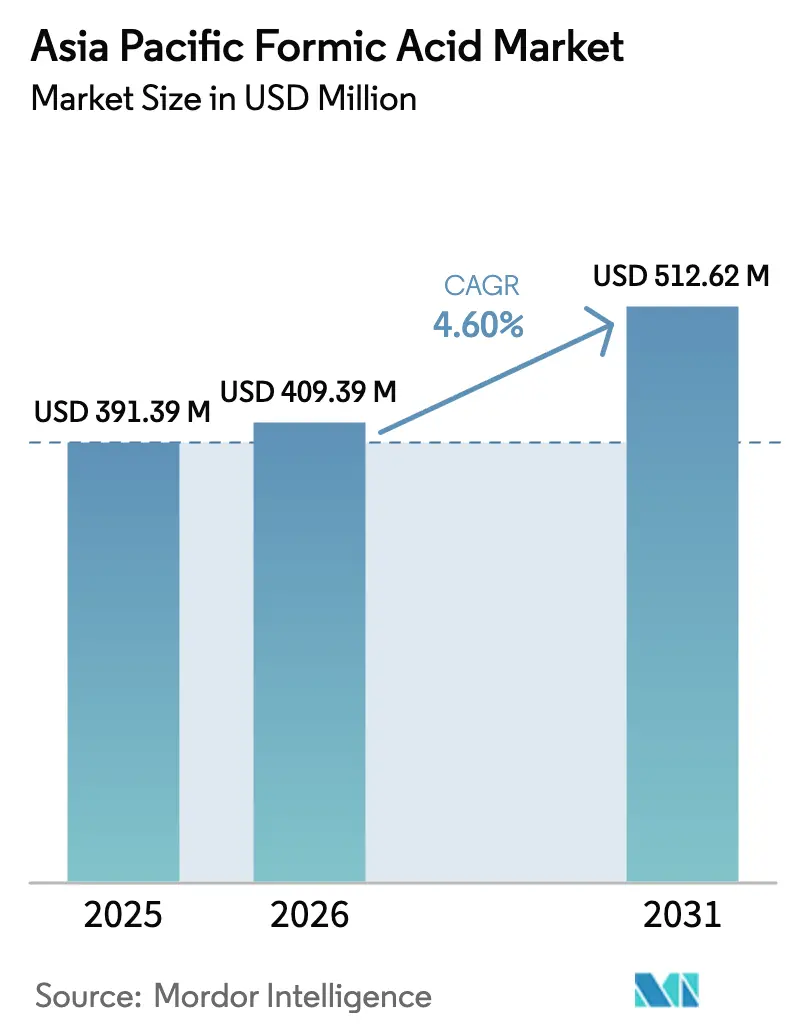
The Asia Pacific Formic Acid Market size was valued at USD 391.39 million in 2025 and is estimated to grow from USD 409.39 million in 2026 to reach USD 512.62 million by 2031, at a CAGR of 4.60% during the forecast period (2026-2031). This trajectory reflects the steady rise of diversified applications across livestock nutrition, leather processing, rubber coagulation, and emerging energy-carrier uses in Japan. China remains the volume anchor, yet its share is edging lower as Indonesia scales latex and oleochemical capacities and India readies policy-backed chemical investments. Feed-acidifier demand is growing in lockstep with a regional livestock boom, while leather and textile producers upgrade to higher-margin exports that rely on 85-90% technical-grade formic acid for consistent pH control. Methanol feedstock volatility and early-stage substitution by wood vinegar and propionic acid temper upside potential, but integrated producers such as BASF and Luxi Chemical continue to widen cost advantages through Verbund synergies and captive methanol. Japan’s pilot projects positioning formic acid as a liquid hydrogen carrier suggest a long-tail technology-led demand stream that could lift volumes beyond 2030 once catalyst costs fall and electrochemical routes mature.
Key Report Takeaways
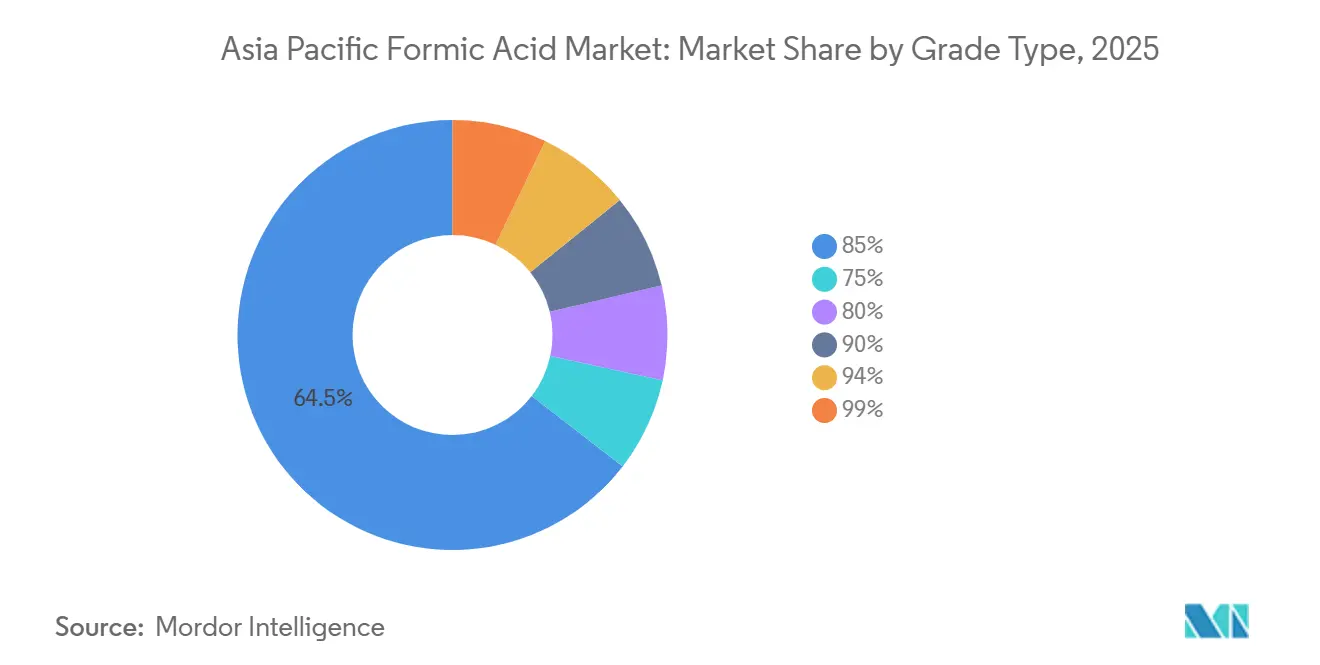
- By grade type, the 85% segment led with 64.51% revenue share in 2025 and is expanding at a 4.08% CAGR to 2031.
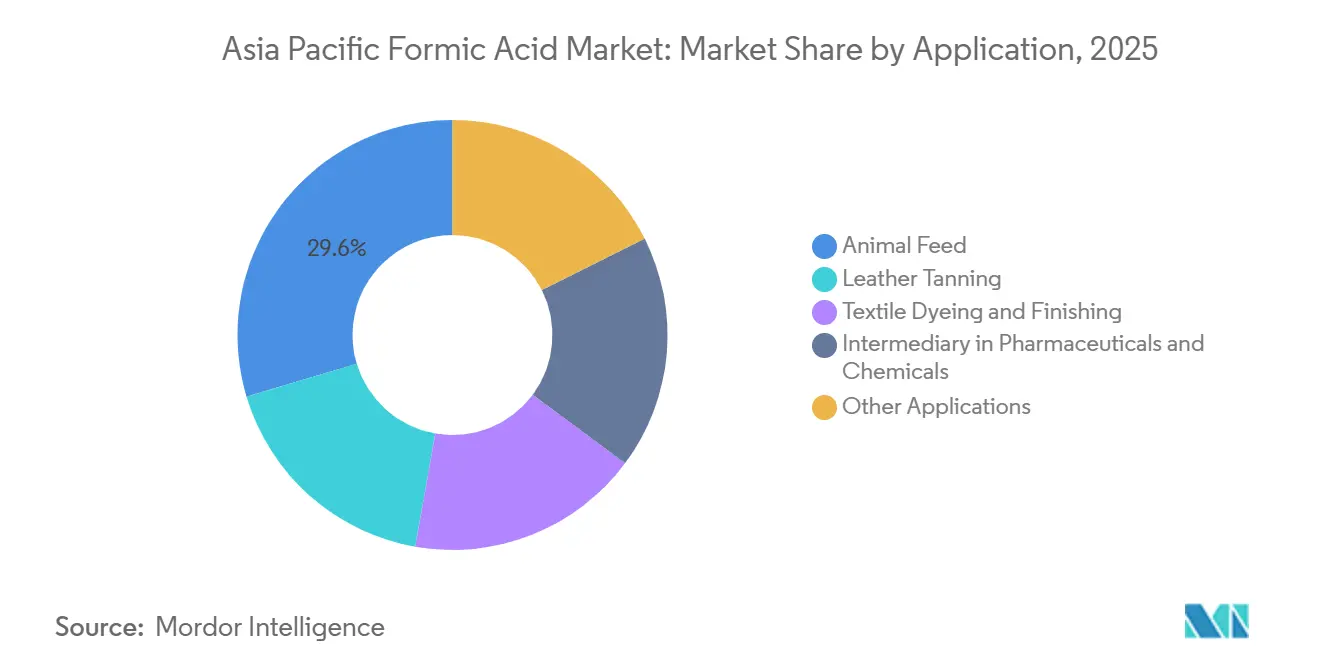
- By application, animal feed accounted for 29.63% of the Asia Pacific formic acid market share in 2025 and is advancing at a 4.13% CAGR through 2031.
- By geography, China held 64.43% of regional demand in 2025; Indonesia is set to post the quickest rise at 5.11% CAGR to 2031.
Note: Market size and forecast figures in this report are generated using Mordor Intelligence’s proprietary estimation framework, updated with the latest available data and insights as of January 2026.
Worldwide, activity is shaped by contributions from multiple regions, with Asia representing one of the more structurally developed among them. The global report on formic acid market by Mordor Intelligence reflects how these regional layers combine into a single system.
Market Trends and Insights
Drivers Impact Analysis of Asia Pacific Formic Acid Market*
| Driver | (~) % Impact on CAGR Forecast | Geographic Relevance | Impact Timeline |
|---|---|---|---|
| Livestock Boom Driving Demand for Feed and Silage Acidifiers | +1.2% | China, India, Indonesia, Thailand, Vietnam | Medium term (2-4 years) |
| Leather and Textile Capacity Additions in China-India-ASEAN | +0.9% | China, India, Vietnam, Bangladesh, Pakistan | Short term (≤ 2 years) |
| Surging Rubber/Latex Chemical Consumption in Southeast Asia | +0.7% | Thailand, Indonesia, Malaysia, Vietnam | Medium term (2-4 years) |
| Pilot Projects Using Formic Acid as Liquid H₂-Carrier Fuel | +0.4% | Japan, South Korea | Long term (≥ 4 years) |
| Make-In-India Incentives for Domestic Capacity Expansion | +0.5% | India | Medium term (2-4 years) |
| Source: Mordor Intelligence | |||
Livestock Boom Driving Demand for Feed and Silage Acidifiers
Asia Pacific livestock output is forecast to deliver 54% of incremental global agricultural growth by 2034, and India alone is projected to supply nearly 40% of that expansion. Protein-rich diets in lower-middle-income countries are raising average feed intensity, compelling integrators to adopt formic acid to curb pathogenic load and reduce antibiotic use. China’s pivot toward pork and poultry sustains per-ton acidifier demand even as herd efficiency rises. Large Indian feed mills now specify organic-acid blends that include formic acid to meet export-oriented biosafety standards issued in 2025. Regional supply remains tight because GNFC and RCF operate modest capacities, allowing Chinese and Malaysian exporters to fill the gap. Supply chain managers report that price sensitivity has eased for high-purity grades as integrators link acidifier use to measurable reductions in mortality and feed conversion.
Leather and Textile Capacity Additions in China-India-ASEAN
Asian leather hubs are upgrading to premium finished goods destined for Europe and North America, prompting tanneries to standardize on 85–90% technical-grade formic acid for pickling and chrome masking[1]. Environmental regulations introduced in China and India in 2025 mandated lower effluent chromium and sulfate thresholds, driving substitution away from sulfuric toward formic acid. Seasonal maintenance at East Asian formic acid units coincided with the 2025 leather production surge, causing localized tightness that lifted spot prices 8% quarter-on-quarter. Textile dyeing units in Bangladesh and Vietnam expanded capacity for reactive dyes, favoring formic acid in the fixation bath to comply with the ZDHC Roadmap to Zero chemicals list. Stakeholders indicate that demand elasticity is limited because quality-conscious buyers penalize pH drift that leads to leather grain swelling or dye shade variability.
Surging Rubber/Latex Chemical Consumption in Southeast Asia
Thailand, Indonesia, and Vietnam deliver 80% of world natural rubber, and formic acid retains 95% usage in latex coagulation thanks to fast reaction time and low residue. Indonesia’s palm-oil boom adds a second consumption leg because oleochemical plants convert fatty-acid by-products using formic-acid-catalyzed esterification. However, field trials in 2025 confirmed that 10% wood vinegar achieves comparable coagulation on smallholder estates, launching a price-sensitive substitution trend. Indonesia’s rubber processors therefore alternate between formic acid and locally sourced wood vinegar, producing quarterly demand swings of up to 15%. Despite volatility, aggregate consumption still grows because latex output is forecast to climb 4% annually through 2031 as tire plants in Vietnam and Malaysia scale.
Pilot Projects Using Formic Acid as Liquid H₂-Carrier Fuel
Japan’s AIST and the University of Tsukuba unveiled a direct CO₂-to-formic-acid synthesis in late 2024 that quadruples reaction rates versus aqueous pathways, cutting process steps and cost. Kanazawa University later demonstrated a porous catalyst layer that lifts direct formic acid fuel-cell power density by 25%. These advances strengthen formic acid’s credentials as a liquid organic hydrogen carrier that can be stored at ambient conditions, sidestepping compressed-gas infrastructure. Demonstration rigs installed at two Japanese municipal bus depots recorded 2,000 hours of operation during 2025-2026 with stable performance. Commercial uptake remains long-tail but migrates the chemical from commodity status toward a specialty energy vector, supporting a technology premium for ultra-pure 94% and 99% grades.
Restraints Impact Analysis of Asia Pacific Formic Acid Market*
| Restraint | (~) % Impact on CAGR Forecast | Geographic Relevance | Impact Timeline |
|---|---|---|---|
| Substitution by Cheaper Organic Acids in Feed and Tanning | -0.6% | Global, with acute impact in China, India, Southeast Asia | Short term (≤ 2 years) |
| Volatile Methanol/CO Feedstock Costs | -0.8% | China, India, Malaysia, Japan | Short term (≤ 2 years) |
| Rising Compliance Costs for Corrosive-Chemical Handling | -0.4% | China, India, Japan, South Korea | Medium term (2-4 years) |
| Source: Mordor Intelligence | |||
Substitution by Cheaper Organic Acids in Feed and Tanning
Propionic and acetic acids undercut formic acid by 10–15% per ton when sourced from integrated Verbund sites able to amortize fixed costs. Large feed integrators in China began trialing propionic-dominant blends in 2025 to lower cost of gain, and Bangladeshi tanners have shifted to dual-acid pickling systems that use acetic acid for bulk pH adjustment with formic acid finishing. Wood vinegar’s field validation as a latex coagulant in Thailand and Indonesia adds another substitution lever at the smallholder level. If raw-material spreads widen further, substitution could accelerate, capping premium-grade growth despite rising end-market volumes.
Volatile Methanol/CO Feedstock Costs
Methanol comprises roughly half of variable costs, and Q4 2024 price spikes forced Luxi Chemical to idle part of its 300,000 MT/y line to stabilize the local market, as disclosed in its December investor note[2]. BASF’s Zhanjiang Verbund, commissioned in 2025, channels methanol into Oxo-alcohols first, tightening merchant availability for standalone formic acid plants. Smaller producers lacking captive methanol hedge via quarterly contracts indexed to coal-based production costs in China, yet margin compression persists. Feedstock price volatility moves directly to customer invoices, triggering inventory drawdowns at Southeast Asian rubber processors and Indian leather clusters.
*Our forecasts treat driver/restraint impacts as directional, not additive. The impact forecasts reflect baseline growth, mix effects, and variable interactions.
Asia Pacific Formic Acid Market Segment Analysis
By Grade Type:
Technical Grades Dominate Industrial ApplicationsThe 85% grade commanded 64.51% of the Asia Pacific formic acid market in 2025, and it is projected to grow at a 4.08% CAGR through 2031 as key consuming clusters widen capacity. Integrated giants can switch purity levels mid-run, but 85% remains the sweet spot between yield, corrosion control, and pH stability demanded by tanners, dyers, and rubber processors. Demand resilience is strengthened because leather exporters in China and Vietnam receive higher unit prices for softer, fuller grain finished with consistent formic-acid pickling. BASF’s June 2025 launch of low-product-carbon-footprint 85% grade created a template for sustainability-driven procurement that may carve out a premium micro-segment over the next three years.
Purity bands at 75% and 80% serve price-sensitive rubber coagulation and commodity textile lines, but substitution by wood vinegar and blended acids is shaving share. High-purity 90%, 94%, and 99% grades fulfill electronics cleaning, pharmaceutical intermediates, and hydrogen-storage pilot demands in Japan and South Korea, yet volumes remain comparatively small. Growth visibility is rising as Japanese fuel-cell developers specify 94% purity for direct formic acid fuel-cell anodes, expecting niche commercialization post-2030. With Luxi Chemical bringing a 400,000 MT/y line onstream by 2027, supply security for premium grades improves, though sustainability credentials rather than capacity alone will shape buyer choice in export-driven belts.

By Application:
Animal Feed Leads Amid Biosecurity PressuresAnimal feed held 29.63% of regional demand in 2025 and is projected to climb at a 4.13% CAGR, buoyed by expanding poultry and swine herds and regulatory curbs on prophylactic antibiotics. Formic acid’s dual role as preservative and gut-acidifier enhances feed conversion ratios, offering a quantifiable return on inclusion that encourages adoption even when input prices firm. China’s efficiency gains offset some volume, yet higher-value pork diets and integrator-level biosecurity standards protect per-ton usage. India’s protein transition, with per-capita meat consumption rising toward 6 kg by 2031, underpins sustained acidifier pull; local supply gaps ensure continued imports from Malaysia and China.
Leather tanning grows marginally, driven by ASEAN and South Asian capacity additions aimed at premium footwear and upholstery segments. Textile dyeing is expanding because Bangladesh and India push vertical integration to secure higher garment export margins; formic acid is preferred in dye fixation baths that comply with ZDHC chemical management protocols. Pharmaceutical and specialty-chemical intermediates add incremental tonnage in Japan, South Korea, and China’s fine-chemical clusters, supporting premium-purity requirements. Rubber coagulation remains a cornerstone but faces substitution headwinds, while potassium-formate de-icing and industrial cleaning plateau at low single-digit growth.
Geography Analysis
China Formic Acid Market
China retained a commanding 64.43% share of the Asia Pacific formic acid market in 2025 thanks to integrated capacity exceeding 550,000 MT/y across Luxi Chemical, Feicheng Acid Chemicals, Wanhua, and BASF’s 50,000 MT Nanjing unit. Luxi’s 400,000 MT/y brownfield expansion, scheduled for 2027 start-up, will raise its global share toward 30% and extend China’s export surplus. Domestic consumption still expands on the back of feed, leather, and textile sectors, yet overcapacity positions China as the region’s swing exporter. Methanol price spikes in late 2024 prompted supply throttling, underscoring the chain’s exposure to upstream energy swings.
Indonesia Formic Acid Market
Indonesia is the fastest-growing node, posting a 5.11% CAGR through 2031 as latex processors increase integration and palm-oil downstreamers scale oleochemicals. Supply fragmentation persists; domestic traders rely on spot cargoes from China, with landed prices varying 15-20% quarter-to-quarter, complicating long-term contracting.
APAC Formic Acid Market
India’s demand is supported by GNFC’s 12,705 MT/y and RCF’s 10,000 MT/y plants, yet still imported over half its requirement. The GNFC-INEOS acetic acid project exemplifies capital rotation into higher-margin acids, implying limited near-term expansion for domestic formic acid. Japan and South Korea together account for a smaller share, with technology-led pull from electronic, pharmaceutical, and hydrogen-carrier projects. Malaysia serves as a trading hub, funneling imports to Vietnam, the Philippines, and Thailand, where on-the-ground consumption rises but infrastructure and regulatory heterogeneity deter local production investment.
Mordor Intelligence provides coverage of the formic acid market across other key regional markets, including Europe, each with their regulatory frameworks and demand patterns. Detailed country-level analysis extends to Saudi Arabia incorporating local coverage and market participation, as required.
Regulatory Landscape
Formic acid trade, storage, and use across Asia Pacific falls under tightening environmental and chemical-handling compliance, which is pushing up total cost of ownership for higher-concentration grades used in feed, leather, and rubber. In China, provincial ecology and environment authorities such as the Department of Ecology and Environment of Shandong Province manage EIA processes and permitting for chemical-park projects, creating a gate for expansions and upstream platform buildouts tied to large producers such as Luxi Chemical.
On the demand side, export-facing leather and textile supply chains are increasingly assessed against restricted-substance and wastewater-performance requirements. This supports the shift toward controlled-purity technical grades and documented sourcing. BASF has also introduced commercial programs that translate sustainability requirements into procurement mechanisms, including its LowPCF formic acid offering via China eAuction (launched in June 2025), which helps buyers address Scope 3 and supplier disclosure needs alongside conventional safety documentation.
Value Chain Analysis
The regional value chain starts with upstream syngas or methanol and carbon monoxide feedstocks, followed by formic acid synthesis (commonly via methyl formate). Producers then concentrate and purify into 75% to 99% grades before bulk storage and distribution.
Integration is a differentiator in the market. BASF supplies formic acid from Verbund manufacturing (with global capacity stated at 300,000 metric tons per year and production at sites including Nanjing, China), while Luxi Chemical operates an interconnected coal-based syngas chain that supports feedstock security and tighter cost control. In India, domestic production is anchored by GNFC, which operates a formic acid plant using the methyl formate route with technology supplied by Kemira Oy. Downstream channels include direct supply to large feed integrators, tanneries, and rubber processors, as well as distributors serving fragmented SME clusters. End uses generally require corrosion-managed logistics and consistent assay for 85% to 90% technical grades, with higher-purity 94% and 99% routed through more controlled packaging and QA pathways for specialty intermediates and energy-related pilot use cases.
Competitive Landscape
The Asia Pacific formic acid market is moderately consolidated. Strategic actions trend toward vertical integration and sustainability branding. Luxi Chemical bundles captive methanol and CO off-gas streams, lowering variable costs and widening export price elasticity. BASF stitched an MoU with UPC Technology in 2024 to secure Oxo-alcohol offtake, indirectly constricting merchant methanol pools for third-party formic acid plants. Perstorp’s upstream-by-product valorization into calcium formate broadens its leather-chemical bundle aimed at Indian and Vietnamese tanners. Emerging disruptors include Japanese fuel-cell consortia that demand ultra-low-impurity 94% grades, carving a niche that mid-scale Korean producers such as Lotte Fine Chemical intend to address.
M&A appetite stays constrained because green-field Verbund economics outperform asset roll-ups, and antitrust regulators have sharpened scrutiny. Instead, technology partnerships flourish: Korea Institute of Energy Research published a biomass-to-formic-acid route in 2025 that captures CO₂ as carbonic acid, highlighting carbon-negative credentials. Producers now weigh life-cycle carbon metrics alongside traditional cost curves when positioning future investments.
Asia Pacific Formic Acid Industry Leaders
-
Gujarat Narmada Valley Fertilizers & Chemicals Limited
-
BASF
-
Luxi Group
-
Eastman Chemical Company
-
Chongqing Chuandong Chemical (Group) Co., Ltd.
- *Disclaimer: Major Players sorted in no particular order

Asia Pacific Formic Acid Market Companies Covered in this Report
- Addcon Group GmbH
- Anhui Asahi Kasei Chemical Co., Ltd.
- BASF
- Chongqing Chuandong Chemical (Group) Co., Ltd.
- Eastman Chemical Company
- Feicheng Acid Chemicals Co., Ltd.
- Gujarat Narmada Valley Fertilizers & Chemicals Limited
- Helm
- Kemira Oyj
- Luxi Group
- MKS Marmara Entegre Kimya
- Perstorp
- Rashtriya Chemicals and Fertilizers Limited
- Shandong Acid Technology Co., Ltd.
- Sintas Kurama Perdana
- Wanhua
- Wuhan Ruisunny Chemical Co., Ltd.
Market Opportunities and Future Outlook
The main opportunity sits in supply reliability and transparency for import-dependent consuming nodes, notably parts of Southeast Asia and India, where buyers face feedstock-linked price volatility and variable landed costs. BASF's move to sell LowPCF formic acid through its China eAuction platform in June 2025 illustrates an operating model that combines digital procurement, traceability, and sustainability attributes, which can support differentiated offerings beyond commodity spot trade for export-oriented leather, textile, and specialty chemical customers.
Upstream integration and chemical-park infrastructure investment also helps create room for more stable regional availability and broader grade slates. BASF's Verbund site inauguration in Zhanjiang, Guangdong (March 2026) and Luxi Chemical's chemical-park chain-strengthening raw-material platform efforts in Shandong, covering upstream inputs such as carbon monoxide and synthetic ammonia, point to a shift toward feedstock-secured supply ecosystems. This supports opportunities for local tolling, merchant distribution hubs, and premium-grade specialization, including 94% and 99% offerings for electronics and pharma intermediates and for Japan-led energy-carrier pilots, where impurity control and documented production footprints influence supplier selection.
Recent Industry Developments in Asia Pacific Formic Acid Market
- May 2026: Gujarat Narmada Valley Fertilizers & Chemicals Limited (GNFC) earnings call confirms formic acid production volume of approximately 34,000 metric tons for FY26. The update reinforces GNFC as a major AP formic acid supplier, with output discussed as a key revenue driver across leather, rubber, pharmaceuticals, and textiles sectors.
- March 2026: BASF announces price increases for formic acid in Europe, by 250 EUR/MT. The price action underscores margin and affordability dynamics for AP formic acid buyers and may influence downstream regional contract pricing.
- June 2025: BASF launches LowPCF formic acid on its China eAuction platform. The launch demonstrates digital market access and a sustainability narrative, setting a precedent for lower-carbon procurement in the AP market.
Asia Pacific Formic Acid Market Report Scope and Research Methodology
Market Definition and Coverage
This market covers the value of formic acid sold for use across Asia Pacific, counted at the point of sale into end-use industries and standard applications, and reported in USD for the defined years.
Scope exclusions: We exclude downstream products where formic acid is only an intermediate, as well as internal transfers that do not represent an external sale.
Segments Covered in This Report
- By Grade Type
- 85%
- 75%
- 80%
- 90%
- 94%
- 99%
- By Application
- Animal Feed
- Leather Tanning
- Textile Dyeing and Finishing
- Intermediary in Pharmaceuticals and Chemicals
- Other Applications
- By Geography
- China
- India
- Japan
- South Korea
- Indonesia
- Thailand
- Malaysia
- Vietnam
- Rest of Asia Pacific
Data Sources, Market Sizing, and Validation
Desk Research
Desk research was used to map the demand pool and keep the model tied to observable industrial activity in the region. We relied on public sources such as national statistics offices across Asia Pacific economies, UN Comtrade for trade flows, and publications from groups like the International Rubber Study Group and FAO to understand livestock and feed-related indicators that influence consumption.
To pressure-test pricing and supply context, we reviewed customs unit values, chemical safety and regulatory documents, and peer-reviewed chemistry and process literature that help interpret typical grades and yield paths. We also referenced company filings, investor presentations, and reputed business press to clarify capacity additions, maintenance cycles, and trade routes. A paid subscription for company financials and intelligence, plus a shipment-level import and export database, were used selectively to validate volumes and realized pricing ranges. The sources listed here are illustrative, and many other public documents and datasets were also used for data collection, cross-checks, and clarification.
Primary Interviews and Surveys
Primary interviews and surveys were used to confirm what end users actually purchase, how grades are substituted, and which price references are followed in day-to-day contracting. We spoke with stakeholders across producers, distributors, and large buyers in key APAC countries so that assumptions on utilization, imports, and typical pricing adjustments could be corrected where needed.
Distribution of primary research fieldwork respondents
| Company type | Respondent position |
|---|---|
| Top tier: 39% | CXOs: 12% |
| Mid tier: 44% | Functional/Unit leaders: 30% |
| Smaller Players: 17% | Managers: 58% |
Market-Sizing & Forecasting
Sizing started with a top-down build where production, trade, and apparent consumption signals were reconstructed for Asia Pacific, then converted into value using application-relevant pricing logic. The totals were corroborated through selective bottom-up checks, such as sampled supplier and distributor revenue ranges, and volume times average selling price (ASP) checks for large consuming industries, which helped adjust totals when a country-level signal looked inconsistent.
Key inputs in the model included import and export volumes by relevant tariff lines, regional operating rates and announced capacity changes, and observed spreads between industrial and higher-purity grades that influence realized ASPs. We also tracked demand indicators tied to formic acid usage, such as rubber processing activity, leather output trends, and livestock feed preservation intensity in major consuming economies. For forecasting, we ran scenario analysis around feed and industrial demand strength, then smoothed price and volume paths so short-term spikes did not get over-projected. Where bottom-up information was patchy for smaller markets, gaps were handled by scaling from trade intensity, downstream activity proxies, and interview-based share splits, before rechecking against the regional total.
Data Validation & Update Cycle
Validation was done through multiple checks so that the final numbers remained consistent with independent signals. Our team compared the outputs against trade-derived consumption patterns, capacity timelines, and price movements, then reviewed any variances that exceeded expected ranges for a commodity chemical.
When an anomaly was found, the assumption was reworked, and if needed, respondents were re-contacted to confirm whether it was driven by grade mix, one-off inventory moves, or a temporary price reset. Each report is refreshed annually, and interim updates are made when material events occur, such as major capacity starts, outages, or trade policy changes. Before delivery, an analyst performs a fresh pass so clients receive the latest updated view.
Mordor Intelligence's Asia Pacific Formic Acid Market Size Compared Against Other Published Estimates
Published market sizes for formic acid in Asia Pacific can differ even when the topic looks identical, mainly because the refresh timing, currency treatment, and pricing logic are not aligned across sources. In a market where trade flows and realized prices can move quickly, small modeling choices can create visible differences in the final USD value.
The largest gaps usually come from how average selling prices are built (spot-heavy versus contract-weighted), what exchange-rate window is used, and whether re-exports and grade mix shifts are cleaned out of the demand pool. A refresh-led approach reduces drift when new capacity, import patterns, or sudden price shifts occur, and that is why the validation checks and currency timing embedded in Mordor Intelligence's updates can land on a different number versus older, slower-moving publications.
Benchmark comparison
| Source | Market Size | Gaps in Research Methodology |
|---|---|---|
| Mordor Intelligence | USD 409.39 M (2026) | |
| Regional Consultancy A | USD 392.50 M (2026) | Often reflects a longer refresh gap and uses a simplified currency conversion window, which can understate value in years with price recovery. Pricing is commonly applied as a single blended ASP without fully adjusting for grade mix and contract resets. |
| Trade Journal B | USD 450.00 M (2026) | Tends to extend scope into adjacent acid categories or uses optimistic price assumptions tied to short-term quotes. Volume is sometimes inferred from capacity without enough adjustment for operating rates and net trade movements. |
The spread in the table is mostly explained by timing and pricing treatment, followed by how tightly volumes are tied to net trade and real downstream activity. By keeping the steps traceable to trade signals, capacity changes, and interview-checked ASP logic, we deliver a market value that buyers can revisit and reproduce when assumptions shift.
Key Questions Answered in the Report
What is the current value of the Asia Pacific formic acid market?
The market is valued at USD 409.39 million in 2026 and is forecast to reach USD 512.62 million by 2031.
Which application segment consumes the most formic acid in Asia Pacific?
Animal feed leads demand, holding 29.63% share in 2025 and growing at a 4.13% CAGR.
Why is Indonesia the fastest-growing national market?
Rising rubber and palm-oil processing, coupled with oleochemical investment, drive Indonesian demand at a 5.11% CAGR through 2031.
How does methanol pricing affect formic acid producers?
Methanol accounts for up to 50% of variable costs, so price spikes compress producer margins and can trigger temporary output cuts.