
Market Overview
| Study Period | 2021 - 2031 |
|---|---|
| Forecast Data Period | 2026 - 2031 |
| Base Year Market Size (2025) | 16.09 Million tons |
| Market Volume (2026) | 16.95 Million tons |
| Market Volume (2031) | 22.01 Million tons |
| Growth Rate (2026 - 2031) | 5.36 % |
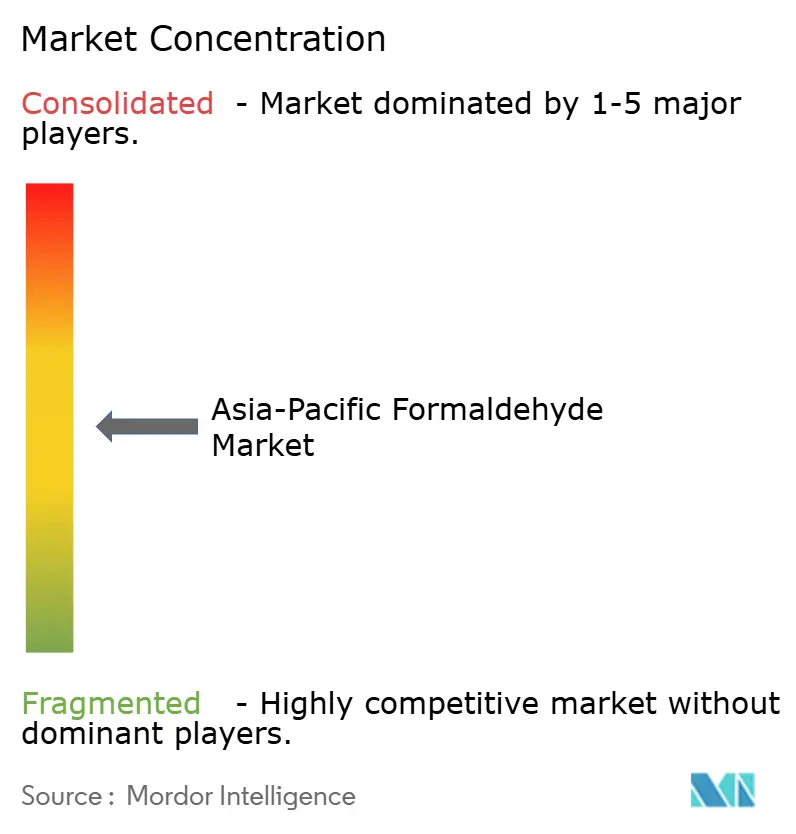
| Market Concentration | Medium |
Major Players *Disclaimer: Major Players sorted in no particular order Image © Mordor Intelligence. Reuse requires attribution under CC BY 4.0. | |
Asia-Pacific Formaldehyde Market Analysis by Mordor Intelligence
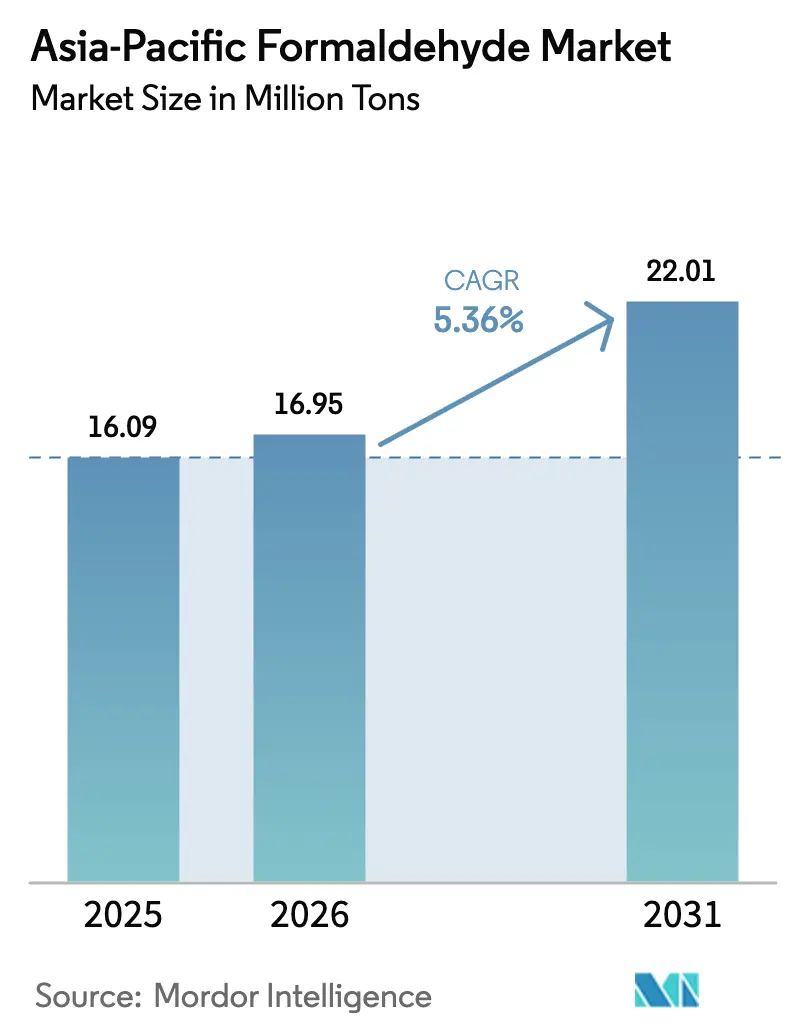
The Asia-Pacific Formaldehyde Market size is expected to grow from 16.09 Million tons in 2025 to 16.95 Million tons in 2026 and is forecast to reach 22.01 Million tons by 2031 at 5.36% CAGR over 2026-2031. Robust panel-board production, sustained residential and infrastructure spending, and the steady electrification of vehicle platforms keep demand on an expansionary path, even as regulators tighten emission ceilings. Capacity additions in China and India continue, yet feedstock volatility linked to methanol-to-olefins integration inflates raw-material costs and compresses margins for non-integrated producers. Automotive applications, especially polyoxymethylene (POM) used in precision gears and interior trim, are growing faster than construction, while phenolic resins gain ground in fire-retardant laminates that satisfy stricter building codes. Competitive intensity remains moderate because global majors rely on technology leadership and integrated supply chains, whereas smaller regional players differentiate on cost and proximity to panel clusters. Evolving procurement policies that require renewable electricity and low-emission resins present both a compliance burden and a route to secure premium contracts.
Key Report Takeaways
- By derivative, urea formaldehyde led with 46.50% Asia-Pacific formaldehyde market share in 2025, while polyoxymethylene is advancing at a 6.9% CAGR through 2031.
- By end-user industry, construction accounted for 38.47% of the Asia-Pacific formaldehyde market size in 2025; automotive is projected to expand at a 6.18% CAGR between 2026–2031.
- By application, plywood and wood products captured 58.99% of the Asia-Pacific formaldehyde market size in 2025 and are forecast to grow at 6.05% annually to 2031.
- By geography, China retained 52.41% of the Asia-Pacific formaldehyde market share in 2025, whereas India is set to log the fastest 6.27% CAGR to 2031.
Note: Market size and forecast figures in this report are generated using Mordor Intelligence’s proprietary estimation framework, updated with the latest available data and insights as of January 2026.
Asia-Pacific Formaldehyde Market Trends and Insights
Drivers Impact Analysis*
| Drivers | (~) % Impact on CAGR Forecast | Geographic Relevance | Impact Timeline |
|---|---|---|---|
| Rising demand from construction composites | +1.2% | China, India, Southeast Asia | Medium term (2-4 years) |
| Expanding automotive plastics and coatings adoption | +0.8% | China, Japan, South Korea, India | Long term (≥4 years) |
| Surge in engineered-wood (MDF/particleboard) output | +1.5% | China, India, Vietnam, Malaysia, Thailand | Short term (≤2 years) |
| Growth of UF/PF resin usage in furniture adhesives | +1.0% | Core APAC, Middle East spill-over | Medium term (2-4 years) |
| Methanol-to-olefins integration boosting captive demand | +0.6% | China, limited India | Long term (≥4 years) |
| Source: Mordor Intelligence | |||
Rising Demand From Construction Composites
India and China continue to channel infrastructure capex into bridges, metro corridors, and data centers. Formaldehyde-based phenol resins dominate plywood used for exterior cladding because they tolerate monsoon humidity and seismic stress. India’s plywood output rose 6.71% year-on-year in FY 2024, underpinned by a five-year 6.00% CAGR, yet MDF and particleboard still hold only 20% domestic share, leaving headroom for resin consumption growth[1]. Luxury housing transactions in India climbed 37.8% between January–September 2024, lifting demand for low-emission laminates that comply with emerging indoor-air standards. China produced more than 250 million m³ of wood-based panels in 2023, locking in sustained adhesive demand, while public-housing specifications already require ENF-grade products.
Expanding Automotive Plastics And Coatings Adoption
Electric-vehicle (EV) assembly is redirecting derivatives toward POM and phenolic composites that satisfy stringent cabin-air protocols. BASF raised Asia-Pacific Ultraform POM prices by USD 350/t in March 2025 to offset energy and freight inflation and continued compliance spending. Japan Automobile Manufacturers Association limits cabin formaldehyde to 100 µg m⁻³, a threshold now mirrored across ASEAN sourcing contracts. Hybrid powertrains also accelerate phenolic resin uptake in brake pads and clutch facings that require heat stability.
Surge In Engineered-Wood Output
Regional MDF capacity outpaces near-term demand, trimming resin prices but consolidating long-run formaldehyde volumes. India lifted MDF nameplate capacity to 4.5 million m³ by FY 2025 and expects oversupply until FY 2027 when modular-furniture exports scale. Vietnam launched an anti-dumping probe into Thai and Chinese fiberboard, favoring local mills that purchase domestic UF resin grades. Malaysia’s MS 2750:2021 forces mills to retrofit scavengers or buy low-emission UF grades, intensifying near-term resin demand.
Growth Of UF/PF Resin Usage In Furniture Adhesives
UF maintains cost leadership in interior-grade boards, while PF garners a share in moisture-resistant outdoor furniture. UF represents roughly 70% of global wood-panel adhesives, and Asia-Pacific exceeds 60% of global melamine-formaldehyde consumption due to laminate exports. Hexion introduced ENF-compliant UF systems in March 2023 and expanded MF capacity to serve Chinese laminate lines. Biomass-balanced amino resins developed by BASF and SWISS KRONO trim cradle-to-gate carbon footprints 30%, giving producers an ESG premium.
Restraints Impact Analysis*
| Restraints | (~) % Impact on CAGR Forecast | Geographic Relevance | Impact Timeline |
|---|---|---|---|
| Toxic and carcinogenic classification tightening exposure limits | -0.4% | Global, stricter in Japan, Singapore, EU exports | Short term (≤2 years) |
| Stringent APAC environmental regulations and emission caps | -0.5% | China, Singapore, Malaysia, Vietnam | Medium term (2-4 years) |
| Shift toward formaldehyde-free resins in wood panels | -0.3% | China, India, Japan, export-oriented ASEAN | Long term (≥4 years) |
| Source: Mordor Intelligence | |||
Toxic And Carcinogenic Classification Tightening Exposure Limits
Singapore bans formaldehyde in interior paints from 2026, capping content at 0.01 wt%, which pushes formulators toward acrylic and silicone binders[2]. Japan’s Building Standard Law demands F4 board ratings of ≤0.04 mg m⁻³, while vehicle makers limit cabin exposure to 100 µg m⁻³, forcing resin upgrades. China’s GB/T 39600-2021 added an ENF tier at ≤0.025 mg m⁻³, and typical adhesive retrofits cost USD 1.2 million per panel plant. Compliance erodes smaller mills’ margins and accelerates substitution by melamine-urea or phenolic alternatives.
Stringent APAC Environmental Regulations And Emission Caps
The Chinese Air Pollution Prevention and Control Law allows winter output curbs for non-compliant aldehyde facilities, throttling supply during peak heating seasons. Malaysia’s MS 2750:2021 harmonizes emission thresholds with CARB and ENF norms, reshaping procurement toward low-emission UF. Vietnam’s anti-dumping probe on imported fiberboards indirectly compels domestic mills to upgrade their environmental footprints to remain competitive.
*Our forecasts treat driver/restraint impacts as directional, not additive. The impact forecasts reflect baseline growth, mix effects, and variable interactions.
Segment Analysis
By Derivative: UF Dominance Masks POM And Hexamine Upside
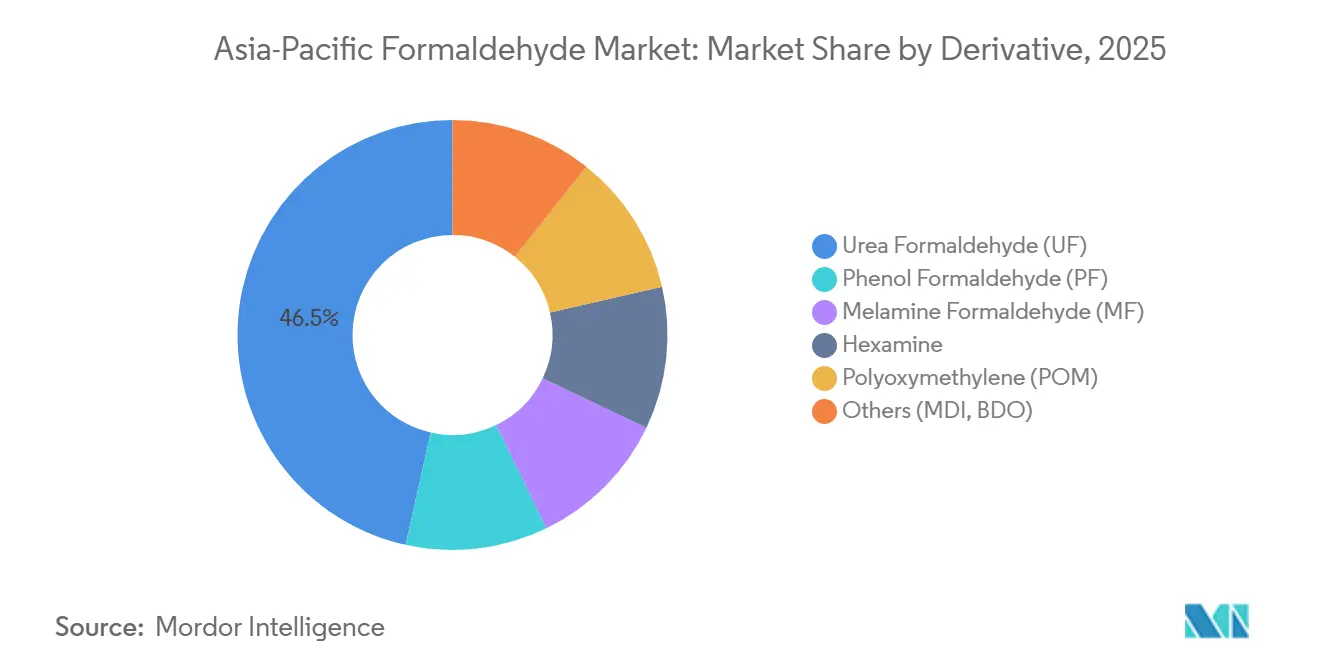
Urea formaldehyde contributed 46.50% of Asia-Pacific formaldehyde market share in 2025, reflecting its low unit cost in particleboard and MDF lines. The sub-segment is forecast to advance at a 5.97% CAGR through 2031, keeping absolute volume leadership despite regulatory headwinds. Polyoxymethylene demand is propelled by EV interior and precision gear demand that tracks a near 7% CAGR. Phenol formaldehyde gains niche adoption in fire-resistant plywood favored in metro and data-center builds, while melamine formaldehyde caters to decorative laminates where scratch resistance commands a price premium.
Technological upgrades in UF enable ENF-grade panels without sacrificing press throughput, mitigating substitution risk. Hexamine retains importance in explosives and veterinary applications but faces gradual displacement in fuel tablets. BASF’s 2025 renewable-powered Zhanjiang unit and Hexion’s ENF-compliant UF lines illustrate how global suppliers pivot toward low-emission chemistries aligned with China’s standards. Concurrently, in-house formaldehyde capacity integrated into MDI routes anchors captive demand obscured from headline statistics.

By End-User Industry: Automotive Outpaces Construction In Growth
Construction absorbed 38.47% of regional formaldehyde volume in 2025 and still lifts aggregate demand as India and ASEAN deploy infrastructure stimulus. Yet automotive is set to grow faster at 6.18% CAGR, driven by POM’s penetration in battery-electric vehicle (BEV) coolant blocks and autonomous-driving sensor housings. India’s formaldehyde-based laminate uptake rises with modular kitchen installations, while Japan’s cabin-air limits accelerate low-emission resin migration into supply contracts. Agriculture’s share contracts as propionic-acid preservatives displace hexamine, and healthcare remains a niche consumer amid rising non-aldehyde sterilant usage.
Beyond OEM demand, aftermarket brake components and clutch facings increasingly specify phenolic resins for thermal stability, an opportunity regional compounders exploit by expanding PF production in South Korea. Formaldehyde-based chemical intermediates such as pentaerythritol and methylenedianiline keep the petrochemical segment relevant, especially where integrated players leverage steam and waste-heat networks to minimize variable costs.
By Application: Plywood And Wood Products Sustain Volume Leadership
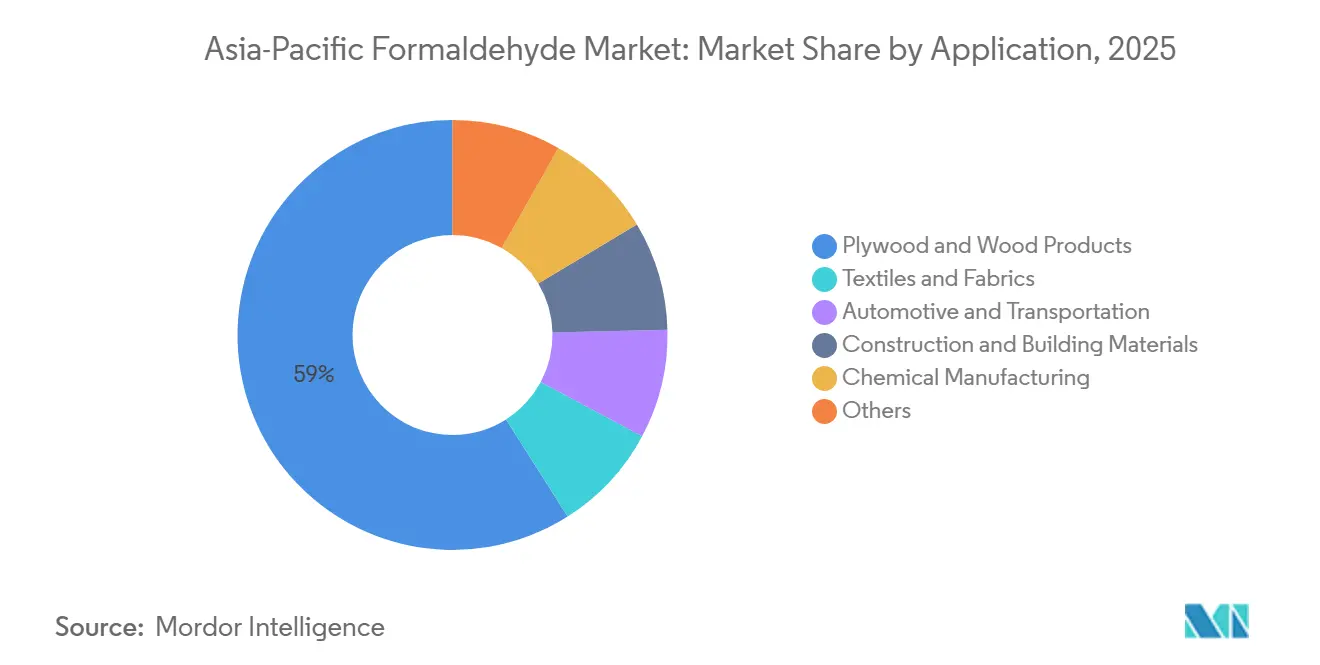
Plywood and wood products represented 58.99% of Asia-Pacific formaldehyde market size in 2025 and could grow 6.05% annually to 2031 on the back of sustained panel exports. Overcapacity dampens resin pricing but secures long-term volume as India, Vietnam, and Thailand scale production. Automotive and transportation applications clock above-average growth because BEV designs rely on lightweight POM rails and phenolic brake pads to offset battery mass. Textiles gradually migrate toward citric-acid cross-linkers, but melamine formaldehyde persists in wrinkle-free finishes for workwear exported from Bangladesh and Indonesia.
Construction and building materials outside the wood domain - phenolic foam boards, fire-retardant coatings - show mid-single-digit growth, benefiting from green-building codes. Chemical manufacturing demand remains steady as Celanese’s Acetyl Chain division reported 11% volume gains in Q1 2024, anchored in Asia-Pacific clients. Remaining end-uses such as disinfectants and agricultural additives hold below-10% share and face substitution headwinds.
Geography Analysis
China retained 52.41% share of Asia-Pacific formaldehyde market volume in 2025, anchored in its 250 million m³ wood-panel output and 30.58 million tons per year propane-dehydrogenation capacity that tightens methanol supply. Policy dictates, such as GB/T 39600-2021 and winter smog controls, drive resin reformulations and capex for scrubbers, favoring large integrated sites that achieve compliance economies. Wanhua Chemical’s 240 kt/y Ningbo formaldehyde block aligns with downstream MDI units to capture heat integration and feedstock flexibility.
India, expected to post a 6.27% CAGR through 2031, leverages public housing, fast-growing modular furniture, and aggressive road building to soak up UF and PF volumes. Kanoria Chemicals’ 345 tons per day expansion and ARCL Organics’ 44.8% formaldehyde revenue share highlight domestic capacity additions. Draft emission standards under the Ministry of Chemicals and Fertilizers will harmonize with CARB norms, encouraging investments in low-emission resin technologies.
Japan, South Korea, Malaysia, Thailand, Indonesia, and Vietnam collectively fill the balance. Japan’s F4 rating and JAMA cabin-air guidelines make it a premium low-emission market; Mitsubishi Gas Chemical labels formalin as “business requiring intensive management,” hinting at potential restructuring. South Korea’s mature construction sector caps panel growth but bolsters POM usage in advanced drivetrains. Malaysia’s MS 2750 and downstream guidelines spur resin upgrades, while Vietnam’s anti-dumping probe may redirect fiberboard demand to domestic adhesive suppliers. Smaller South Asian markets remain import-reliant yet show sporadic demand spikes tied to industrial estate rollout.
Regulatory Landscape
Regulation in Asia-Pacific increasingly links formaldehyde demand to indoor-air and industrial-emissions compliance in wood panels, resins, and downstream products. China anchors the region through GB/T 39600-2021 wood-based panel emission classes (E1, E0, and ENF), while the Ministry of Ecology and Environment (MEE) enforces volatile organic compound (VOC) emission caps affecting formaldehyde resin production operations, including seasonal restrictions under the Air Pollution Prevention and Control Law for non-compliant sites.
Multiple 2026 effective-date changes raise compliance requirements across the chemical value chain. China implemented the Law of the People's Republic of China on the Safety of Hazardous Chemicals effective May 1, 2026, strengthening obligations around hazardous-chemical management. Vietnam also moved to a newer chemicals framework with its Law on Chemicals (Law No. 69/2025/QH15) effective January 1, 2026, while Japan continues to set a premium benchmark via JIS A 5908 F-aligned performance expectations and procurement practices that prioritize low-emission materials.
Value Chain Analysis
The regional value chain starts with methanol as the primary feedstock, followed by formaldehyde production (often in captive or merchant units), and conversion into derivatives such as urea formaldehyde (UF), phenol formaldehyde (PF), melamine formaldehyde (MF), and polyoxymethylene (POM). These derivatives flow into engineered wood (MDF, particleboard, plywood), laminates and furniture adhesives, automotive plastics and friction materials, and chemical intermediates. Because formaldehyde is typically produced and consumed near panel and resin clusters, logistics favors domestic sourcing and short-haul distribution, especially in China and India.
Integration is a decisive cost and reliability lever in Asia-Pacific: large producers pair formaldehyde assets with upstream methanol and downstream derivatives to manage feedstock volatility and meet tightening emission requirements. BASF uses its integrated Verbund approach in the region, and similar integration dynamics in China and India raise pressure on mid-tier and smaller producers that must fund mandatory emission-abatement retrofits (for example, VOC control and monitoring) while competing against integrated sites with utilities, energy, and scale advantages.
Competitive Landscape
The Asia-Pacific formaldehyde market remains moderately fragmented. Strategic levers include backward integration into methanol, forward linkages to derivatives, and geographical expansion toward India and Southeast Asia, where infrastructure drives resin uptake. Wanhua Chemical’s Ningbo complex exemplifies end-to-end integration, lowering unit costs 8–12% via waste-heat recovery. White-space opportunities span CO₂-derived methanol routes, lignin-based adhesives, and ENF-grade UF variants with no cure-cycle penalty. Compliance technology, such as real-time emission monitors and catalytic oxidizers, differentiates top-tier producers, whereas smaller mills rely on dilution tactics that risk shutdown under tighter air-quality rules.
Asia-Pacific Formaldehyde Industry Leaders
-
BASF SE
-
Hexion
-
Mitsubishi Gas Chemical Company, Inc.
-
Perstorp
-
Kanoria Chemicals & Industries Ltd (KCI)
- *Disclaimer: Major Players sorted in no particular order
Market Opportunities and Future Outlook
Opportunities concentrate around compliance-driven upgrading in wood panels and resins as buyers align to stricter indoor-air benchmarks such as China GB/T 39600-2021 (including ENF) and Japan JIS A 5908 F-aligned procurement requirements. This shifts demand toward ultra-low-emission UF systems, formaldehyde scavenger packages, and higher-purity inputs that help panel and furniture supply chains qualify for premium domestic and export specifications, including automotive cabin-air requirements referenced in sourcing contracts.
A second opportunity set is tied to decarbonization and traceability in feedstocks and utilities, where producers can differentiate through integrated, lower-carbon manufacturing and documented footprints rather than commodity-only supply. BASF inaugurating its Zhanjiang Verbund site in March 2026, designed around large-scale integration and renewable electricity use, provides a visible regional example of customers and producers investing in lower-emission production platforms that can support low-emission resin and derivative supply. In parallel, capital spending on catalytic oxidation and emission-capture systems remains a practical whitespace for plants needing to meet VOC and hazardous-chemical compliance requirements without reducing throughput.
Recent Industry Developments
- March 2026: BASF SE inaugurated the world-scale Verbund site in Zhanjiang, Guangdong Province, China, featuring a 1 million tons per year ethylene steam cracker powered by 100 percent renewable electricity and integrated downstream production capability. The launch strengthens BASF's APAC footprint and cost competitiveness through renewables-backed integration, impacting upstream and downstream dynamics in regional formaldehyde-related derivatives. The expansion introduces enhanced feedstock and energy efficiency capabilities that may shift regional supply chains and profitability for nearby resin and adhesive producers.
- July 2025: BASF SE started up expanded production plants for 3-(dimethylamino)propylamine DMAPA and polyetheramine PEA at the Nanjing site, nearly doubling DMAPA capacity. The capacity addition strengthens the supply of DMAPA and PEA intermediates, supporting resins and adhesives in APAC. This development could influence competitive dynamics among APAC formaldehyde derivatives and tighten downstream material sourcing.
- April 2025: Mitsubishi Gas Chemical Company, Inc. announced a collaboration with Panasonic Electric Works to develop an eco-friendly urea resin using methanol derived from CO2; MGC Woodchem tasked with producing the required formaldehyde from carbon-recycled methanol. The partnership ties formaldehyde derivative supply to CO2-derived methanol loop, potentially improving feedstock security and margins in APAC resin markets. This collaboration underscores a shift toward carbon-recycled resin systems and related APAC market opportunities.
Research Methodology Framework and Report Scope
Market Definition and Coverage
For this methodology, the Asia-Pacific formaldehyde market covers formaldehyde supply and consumption across the region, tracked as physical volume in tons, and tied to usage in major downstream resin and chemical applications.
Scope exclusions: We exclude downstream finished goods value (like boards, laminates, furniture, and coatings) and track only formaldehyde volume, not value in USD.
Segmentation Overview
- By Derivative
- Urea Formaldehyde (UF)
- Phenol Formaldehyde (PF)
- Melamine Formaldehyde (MF)
- Hexamine
- Polyoxymethylene (POM)
- Others (MDI, BDO)
- By End-user Industry
- Construction
- Automotive
- Agriculture
- Healthcare
- Chemical and Petrochemical
- Other End-User Industries (Paints and Textiles)
- By Application
- Plywood and Wood Products
- Textiles and Fabrics
- Automotive and Transportation
- Construction and Building Materials
- Chemical Manufacturing
- Others
- By Geography
- China
- India
- Japan
- South Korea
- Malaysia
- Thailand
- Indonesia
- Vietnam
- Rest of Asia-Pacific
Data Sources, Market Sizing, and Validation
Desk Research
Desk research was used to map the Asia-Pacific formaldehyde demand pool and the main conversion routes from methanol to formaldehyde and then into resins. We relied on public manufacturing and trade indicators to understand how wood panels, construction activity, and chemical intermediates move in each country.
Public and official sources were referenced where available, such as national statistical offices for industrial production, UN Comtrade for trade flows of related chemicals, and customs and port statistics published by governments. We also used publications from bodies such as the International Labour Organization on workplace exposure and safety practices. For technical parameters, we used peer-reviewed journals for process yields and typical application shares, and we cross-checked capacity additions and operating notes using company annual reports and investor presentations. In a few cases, paid subscriptions for company financials and patent databases helped validate capacity ownership and technology changes. This list is indicative only, and other sources were used during data collection, validation, and clarification.
Primary Interviews and Surveys
Primary work focused on producers, distributors, and large buyers of formaldehyde-based resins, since these groups are closest to actual offtake patterns. We used interviews and structured surveys to confirm operating rates, import reliance, typical contract units, and how demand shifts by end-use cycles across China, India, Japan, South Korea, and Southeast Asia.
Distribution of primary research fieldwork respondents
| Company type | Respondent position |
|---|---|
| Top tier: 30% | CXOs: 13% |
| Mid tier: 56% | Functional/Unit leaders: 40% |
| Smaller Players: 14% | Managers: 47% |
Market-Sizing & Forecasting
The sizing model starts with a top-down rebuild of Asia-Pacific volume, where downstream production and trade signals are converted back into formaldehyde needs using application-wise consumption factors. Only after country totals are consistent with known capacity and operating realities, the regional total is finalized.
Inputs that mattered most included methanol availability and pricing direction (as the key feedstock), formaldehyde plant capacity additions and shutdowns, estimated operating rates by country, wood panel output indicators that pull urea-formaldehyde and melamine-formaldehyde demand, and construction and furniture production trends that move resin consumption. We also tracked regulation-linked signals such as tightening emission norms for wood-based panels, since these changes can alter the resin mix and shift demand to lower-emission formulations.
Forecasts were built using scenario analysis, since demand is strongly linked to construction cycles, panel production, and plant utilization swings. A base case was set using expert consensus on expected capacity utilization and downstream growth, and then checked against selective bottom-up approximations like sampled supplier volumes and typical tons-per-line consumption factors. Where bottom-up coverage was incomplete in smaller countries, gaps were handled through proxy indicators (panel output, chemical intermediate production, and import dependence), and then adjusted during expert re-checks.
Data Validation & Update Cycle
Outputs are validated through triangulation between the demand reconstruction, supply-side capacity constraints, and trade consistency checks, and then differences are investigated before numbers are locked. If a country shows an unusual jump, we re-check operating rate assumptions, resin conversion factors, and any one-off trade events, and then contact sources again when the variance stays unexplained.
A multi-step analyst review is used so calculation logic and inputs are checked independently before sign-off. The report is refreshed annually, and material events such as major capacity starts, regulation changes, or feedstock shocks can trigger interim updates. Before delivery, we run a fresh review pass so clients receive the latest updated view.
Mordor Intelligence's Asia Pacific Formaldehyde Market Size Versus Other Published Estimates
Published market sizes for Asia-Pacific formaldehyde often do not line up because authors choose different units, different inclusion rules, and different starting years. Some studies also lean more on stated revenue expectations, which can move faster than actual tonnage when pricing or currency assumptions change.
A common gap driver is scope, since some sources report a USD value that can include formaldehyde derivatives or even the value of downstream resins. Others also apply a longer forecast horizon and assume smooth price increases, even though regional prices can swing with methanol and operating rate shifts. Some estimates fold in derivative and resin revenues into a single USD number, and then a narrower rule is applied by Mordor Intelligence, where the market is counted only as formaldehyde volume in tons for Asia-Pacific, with conversion factors and utilization rates rechecked country by country.
Benchmark comparison
| Source | Market Size | Gaps in Research Methodology |
|---|---|---|
| Mordor Intelligence | USD 16.09 M (2025) | |
| Regional Consultancy A | USD 8.70 B (2026) | Reported in USD revenue and presented with derivative coverage, so pricing, currency timing, and included chemistry can inflate or shift totals compared with a tons-based market definition. |
| Industry Database B | USD 3.47 B (2025) | Value-based regional share logic is used, and the translation from global to Asia-Pacific is not fully tied back to country operating rates and application conversion factors, which can understate high-utilization markets. |
In practical terms, the spread comes from mixing value and volume views and from how closely country-level supply and demand checks are enforced. Our approach stays repeatable because the main inputs are observable signals like capacity, operating rates, trade dependence, and downstream output indicators, which makes the final number easier to audit and update.
Key Questions Answered in the Report
What is the projected demand for formaldehyde in the Asia-Pacific by 2031?
Formaldehyde consumption in the Asia-Pacific is forecast to reach 22.01 million tons by 2031, reflecting a 5.36% CAGR over 2026–2031.
Which derivative will dominate volume through 2031?
Urea formaldehyde will remain the largest derivative, retaining close to half of regional volume on cost advantages in MDF and particleboard lines.
Why is automotive the fastest-growing end-user segment?
Electric-vehicle production boosts polyoxymethylene and phenolic resin usage for lightweight, low-VOC components, driving a 6.18% CAGR in automotive consumption.
How are regulations shaping product development?
Standards such as China’s GB/T 39600-2021 ENF tier and Japan’s F☆☆☆☆ board rating compel producers to invest in low-emission UF and PF technologies.
Which country offers the highest growth potential?
India is forecast to expand at a 6.27% CAGR to 2031, supported by infrastructure spending, formal housing initiatives, and new resin capacity additions.