
Market Overview
| Study Period | 2020 - 2031 |
|---|---|
| Forecast Data Period | 2026 - 2031 |
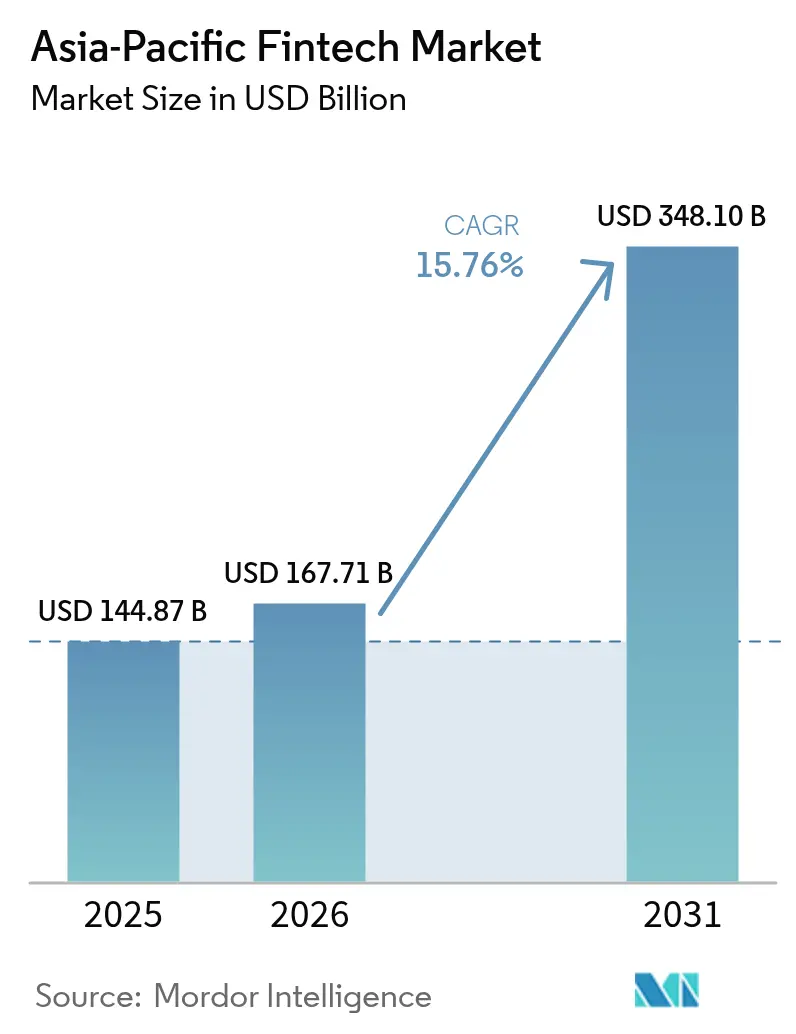
| Base Year Market Size (2025) | USD 144.87 Billion |
| Market Size (2026) | USD 167.71 Billion |
| Market Size (2031) | USD 348.1 Billion |
| Growth Rate (2026 - 2031) | 15.76 % |
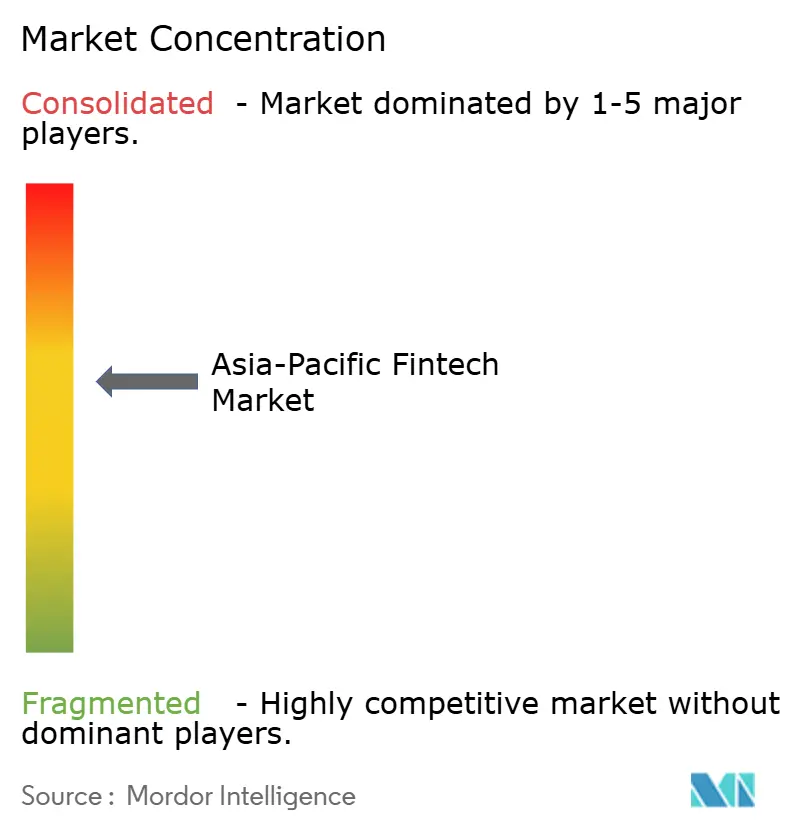
| Market Concentration | Medium |
Major Players *Disclaimer: Major Players sorted in no particular order Image © Mordor Intelligence. Reuse requires attribution under CC BY 4.0. | |
Asia-Pacific Fintech Market Analysis by Mordor Intelligence
Asia-Pacific fintech market size in 2026 is estimated at USD 167.71 billion, growing from 2025 value of USD 144.87 billion with 2031 projections showing USD 348.1 billion, growing at 15.76% CAGR over 2026-2031. Growth stems from three structural forces: entrenched mobile-first behavior, government investment in real-time digital rails, and a visibly lighter licensing regime for cloud-native banks. These factors shorten customer onboarding cycles, cut transaction fees, and encourage capital inflows from both venture and incumbent financial institutions. Super-apps continue to fold payments, lending, investing, and insurance into single interfaces, locking in daily engagement and elevating lifetime value per user. Cross-border corridors are also scaling rapidly as Project Nexus threads India’s UPI, Singapore’s PayNow, and Thailand’s PromptPay into one settlement fabric, bringing down remittance costs and opening high-margin revenue for B2B platforms[1]. Shifting policies on digital identity and e-KYC have further widened addressable populations; Indonesia, the Philippines, and Bangladesh alone add over 400 million newly verifiable adults, catalyzing aggressive go-to-market moves by regional neobanks.
Key Report Takeaways
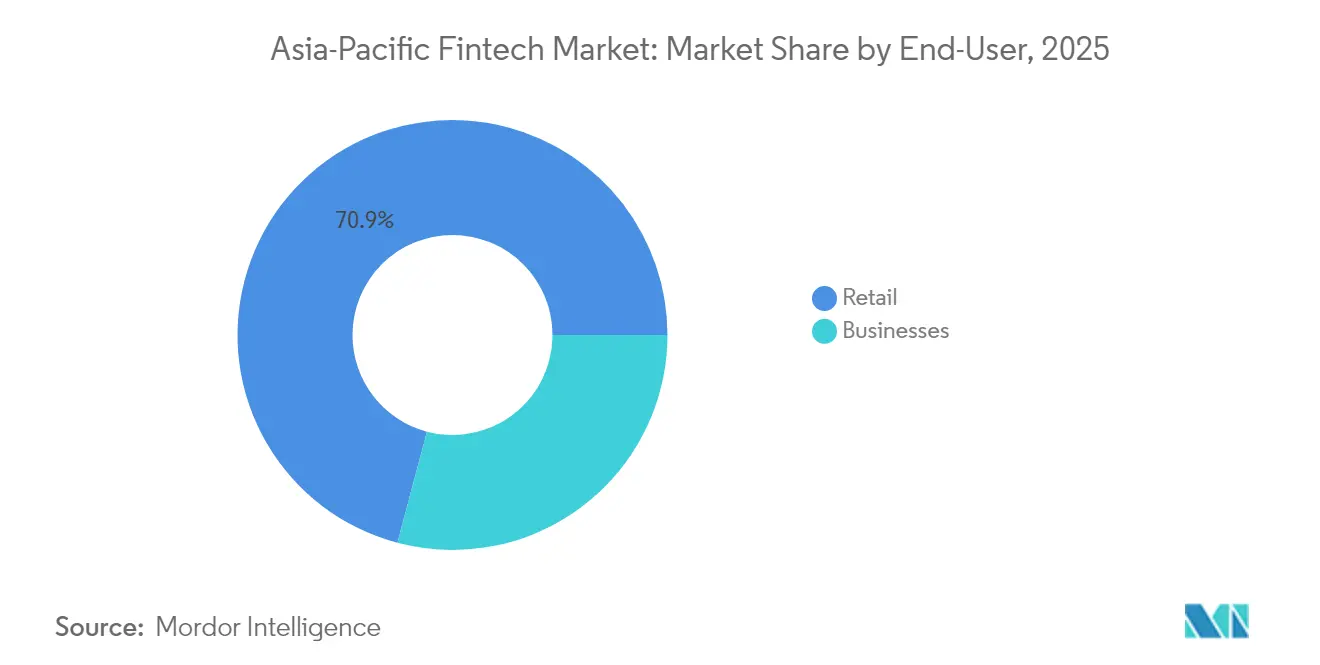
- By service proposition, digital payments captured 64.93% of the Asia-Pacific fintech market share in 2025, while neobanking is projected to grow fastest at a CAGR of 30.46% between 2026 and 2031.
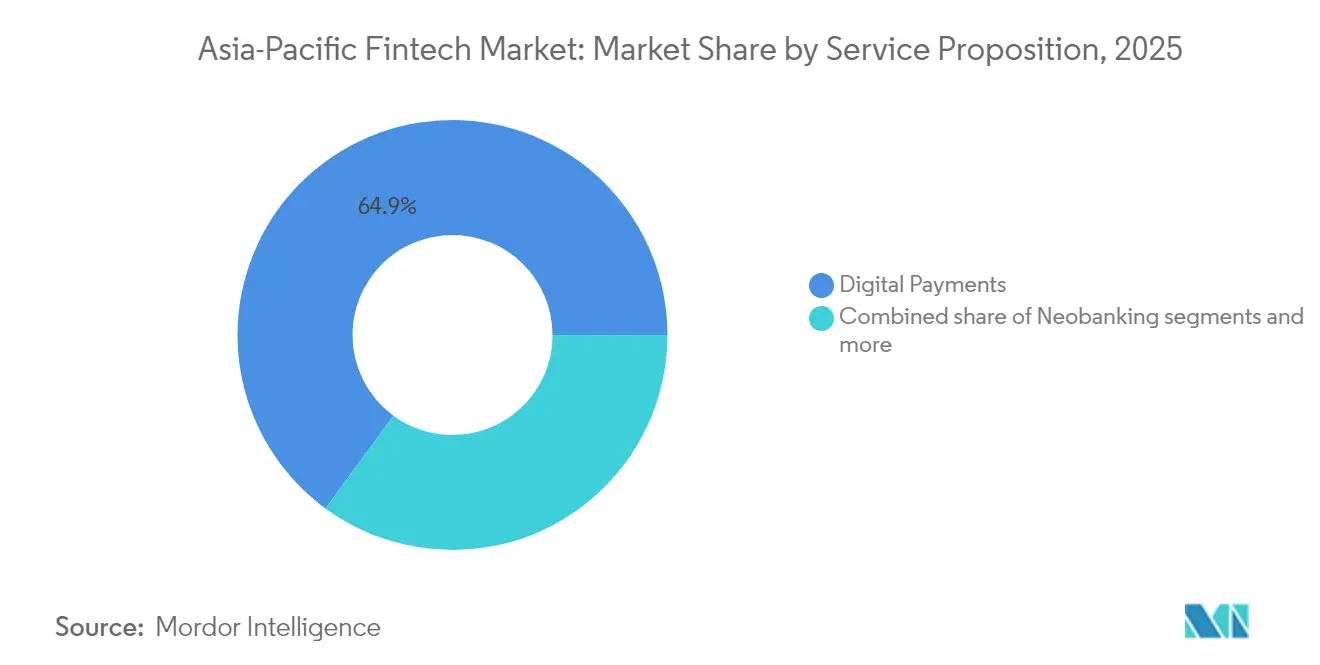
- By end-user, retail accounted for 70.88% of the Asia-Pacific fintech market share in 2025, with businesses expected to post a growth rate of 25.47% CAGR through 2031.
- By user interface, mobile applications held 72.62% of the Asia-Pacific fintech market share in 2025, while POS/IoT devices are forecast to expand at a 23.72% CAGR during 2026–2031.
- By geography, China led with 40.12% of the Asia-Pacific fintech market share in 2025, while India is anticipated to grow fastest at a CAGR of 27.25% from 2026 to 2031.
Note: Market size and forecast figures in this report are generated using Mordor Intelligence’s proprietary estimation framework, updated with the latest available data and insights as of 2026.
Market Trends and Insights
Drivers Impact Analysis of Asia-Pacific Fintech Market*
| Driver | (~) % Impact on CAGR Forecast | Geographic Relevance | Impact Timeline |
|---|---|---|---|
| Real-time payment rails proliferation across APAC | 3.2% | India, Singapore, Thailand, Malaysia, Philippines | Medium term (2-4 years) |
| Government-led financial inclusion & e-ID programs | 2.8% | India, Indonesia, Philippines, Vietnam, Bangladesh | Long term (≥ 4 years) |
| Mobile-first super-app ecosystems accelerating adoption | 2.5% | China, Southeast Asia, India | Short term (≤ 2 years) |
| Renewed VC & corporate funding momentum post-2024 | 2.1% | Global APAC, concentrated in Singapore, Hong Kong | Short term (≤ 2 years) |
| Retail CBDC pilots unlocking programmable-payment use cases | 1.8% | China, Hong Kong, Singapore, Australia, Thailand | Long term (≥ 4 years) |
| ESG-linked fintech modules driven by disclosure mandates | 1.4% | Australia, Hong Kong, Singapore, Japan, South Korea | Medium term (2-4 years) |
| Source: Mordor Intelligence | |||
Real-Time Payment Rails Proliferation Across APAC
The rollout of instant payment networks such as India’s UPI, Singapore’s PayNow, and Thailand’s PromptPay removes settlement lags, reduces interchange fees, and shifts consumer preference away from cash. UPI processed 131 billion transactions worth USD 1.8 trillion in 2024[2]. PayNow and PromptPay achieved bilateral interoperability, allowing Singaporean tourists in Thailand to pay merchants at mid-market FX rates without card surcharges. Real-time rails consequently become embedded layers that fintech applications can tap through open APIs, creating low-code paths to launch P2P remittance, payroll, and merchant settlement products. Merchants favor QR rails for lower device costs and faster cash conversion, resulting in cannibalization of card volumes, especially under USD 25 ticket sizes. Governments continue subsidizing POS upgrades, signaling that instant push payments will remain the default standard by mid-decade.
Government-Led Financial Inclusion & e-ID Programs
Digital ID frameworks materially lower KYC friction, cut onboarding times from days to minutes, and thereby expand the Asia-Pacific fintech market addressable base. India’s Aadhaar underpins over 1.3 billion biometric IDs, enabling one-tap verification across banking, insurance, and investment apps[3]. Indonesia’s e-ID scheme follows suit for 270 million citizens, while the Philippines targets 50 million unbanked adults by 2028. These programs standardize data fields, which allows regional interoperability and supports cross-border financial products. Providers reduce customer acquisition costs by up to 40%, reallocating savings toward product R&D and geographic expansion. The inclusion wave also drives account ownership among women and rural micro-enterprises, linking public welfare transfers directly into wallet accounts.
Mobile-First Super-App Ecosystems Accelerating Adoption
Super-apps from Ant Group, Tencent, Grab, and GoTo integrate ride-hailing, food delivery, and e-commerce with payments, credit, and investment modules. Alipay and WeChat Pay surpassed card networks on domestic volume, sustaining daily usage frequency and making financial exits rare. Grab handled over USD 20 billion in payments through embedded financial services across Southeast Asia. Such ecosystems lower customer acquisition costs and raise retention metrics, reinforcing the Asia-Pacific fintech market’s network effects. The model proves particularly sticky in emerging markets where app real estate is limited and consumers value all-in-one functionality. Super-apps also deploy data analytics on user behavior, enabling hyper-personalized offers and risk-based pricing that conventional banks cannot quickly replicate.
Renewed VC & Corporate Funding Momentum Post-2024
Capital availability reversed its 2022–2023 slump. KPay’s USD 55 million Series A became the year’s largest global payments raise. Banks such as DBS and OCBC launched dedicated CVC arms, backing startups in wealthtech and insurtech. The funding uptick lets platforms widen product suites and enter tier-2 cities without compromising unit economics. Investors show preference for EBITDA-positive growth, rewarding fintechs that monetize B2B workflows or subscription models. Liquidity also fuels M&A, visible in Airwallex’s purchase of CTIN Pay to accelerate cross-border settlement reach.
Restraints Impact Analysis of Asia-Pacific Fintech Market*
| Restraint | (~) % Impact on CAGR Forecast | Geographic Relevance | Impact Timeline |
|---|---|---|---|
| Fragmented multi-jurisdiction compliance burden | -2.3% | Global APAC, particularly cross-border operators | Medium term (2-4 years) |
| Escalating cyber-fraud incidents and associated losses | -1.9% | India, Indonesia, Philippines, Vietnam | Short term (≤ 2 years) |
| Data-localization/cloud-sovereignty rules hindering scale | -1.6% | Indonesia, Vietnam, India, China | Long term (≥ 4 years) |
| Nascent AI-model-risk regulations raising deployment costs | -1.2% | Singapore, Hong Kong, Australia, Japan | Medium term (2-4 years) |
| Source: Mordor Intelligence | |||
Fragmented Multi-Jurisdiction Compliance Burden
Each Asia-Pacific jurisdiction prescribes its own payment licenses, capital ratios, and AML tests. Indonesia mandates local data storage and higher reserve thresholds, clashing with Singapore’s risk-based MAS framework[4]. Cross-border payment providers face particular challenges as each jurisdiction maintains distinct AML/CTF requirements, forcing platforms like Wise and Remitly to implement country-specific compliance systems that increase operational costs by an estimated 15-20% compared to single-market operations. The fragmentation particularly impacts smaller fintech startups that lack resources to navigate multiple regulatory regimes, creating competitive advantages for established players with dedicated compliance teams.
Escalating Cyber-Fraud Incidents and Associated Losses
Digital payment fraud incidents surge across APAC markets as transaction volumes increase, with India reporting USD 1.3 billion in digital payment fraud losses during 2024 and the Philippines experiencing 40% year-over-year growth in cybercrime cases targeting financial services. Identity theft and account takeover attacks particularly impact mobile-first platforms, as fraudsters exploit SMS-based authentication weaknesses and social engineering tactics to compromise user accounts. Fintech providers increase security spending by an average of 25-30% annually to implement multi-factor authentication, behavioral analytics, and real-time transaction monitoring systems that add operational costs while potentially reducing user experience quality. The fraud escalation forces regulatory authorities to impose stricter liability
*Our forecasts treat driver/restraint impacts as directional, not additive. The impact forecasts reflect baseline growth, mix effects, and variable interactions.
Asia-Pacific Fintech Market Segment Analysis
By Service Proposition:
Neobanking Redefines Deposit GatheringNeobanking represents the fastest-growing service segment at 30.46% CAGR through 2031, despite digital payments commanding 64.93% market share in 2025. This growth differential reflects regulatory liberalization across Australia, Hong Kong, and Singapore that enables new banking licenses for digital-first providers, while established payment networks reach maturity in core markets. Tonik Bank in the Philippines achieved 2 million customers within 3 years of launch by offering 6% annual savings rates enabled by lower operational costs, while Australia's Judo Bank focuses exclusively on SME lending through digital channels to capture market share from traditional business banking. Digital lending and financing maintain steady growth as regulatory clarity improves, particularly in India, where RBI guidelines enable fintech-bank partnerships for co-lending arrangements.
Digital investments and insurtech segments benefit from wealth accumulation trends across middle-class populations in China, India, and Southeast Asia. Robo-advisory platforms like Singapore's StashAway and Indonesia's Bibit democratize investment access through low minimum thresholds and automated portfolio management, while insurtech providers embed coverage within e-commerce and mobility platforms to reach previously underserved segments. The integration of financial services within super-app ecosystems accelerates adoption rates, as users access investment and insurance products through familiar interfaces rather than standalone applications.

By End-User:
SMEs Gain Digital MomentumBusiness users drive the fastest segment growth at 25.47% CAGR through 2031, though retail users maintain 70.88% market share in 2025. This acceleration reflects SME digitization trends accelerated by pandemic-era operational changes and government initiatives promoting cashless transactions across APAC markets. Cross-border payment solutions particularly benefit from B2B adoption, as export-oriented manufacturers in Vietnam, Thailand, and Malaysia seek alternatives to traditional correspondent banking for international settlements that can take 3-5 business days.
Embedded finance solutions gain traction among business users as e-commerce platforms and supply chain management systems integrate lending, payments, and working capital financing. Funding Societies' acquisition of CardUp in 2024 creates integrated B2B payment and lending capabilities across Southeast Asia, while Airwallex's expansion into expense management and corporate cards demonstrates the convergence of business financial services. Retail segment growth moderates as smartphone penetration approaches saturation levels in developed APAC markets, though rural and elderly demographics represent untapped opportunities for simplified financial products designed for basic smartphones and feature phones.
By User Interface:
Payment Density Spreads to DevicesMobile applications dominate with 72.62% market share in 2025, yet POS and IoT devices achieve the fastest growth at 23.72% CAGR through 2031 as contactless payment infrastructure expands across retail environments. This shift reflects merchant adoption of integrated payment terminals that accept QR codes, NFC payments, and biometric authentication without requiring separate hardware investments. Singapore's hawker centers and Malaysia's wet markets increasingly deploy smartphone-based POS systems that enable small merchants to accept digital payments without traditional card terminal costs, while Indonesia's warung (small shops) adopt QR code displays that integrate with multiple payment networks simultaneously.
Web and browser interfaces maintain stable market positions as desktop-based B2B transactions require comprehensive dashboards for treasury management, reporting, and multi-user access controls that mobile apps cannot effectively replicate. IoT device integration accelerates through connected car payments, smart home appliances, and wearable devices that enable contextual financial services. The interface diversification creates opportunities for fintech providers to capture transaction volume across multiple touchpoints while reducing dependency on smartphone-based interactions that face increasing competition from super-app ecosystems.
Geography Analysis
China and India Fintech Market
China maintains 40.12% market share in 2025 through Ant Group's Alipay and Tencent's WeChat Pay dominance, yet regulatory restrictions on data sharing and cross-border transactions limit growth potential compared to other regional markets. India emerges as the fastest-growing geography at 27.25% CAGR through 2031, driven by UPI transaction volume exceeding 100 billion annually and RBI initiatives promoting digital lending through co-lending frameworks. The country's fintech ecosystem benefits from English-language advantages that facilitate international expansion, while regulatory sandboxes enable innovative product development without full licensing requirements initially.
APAC Fintech Market
Southeast Asian markets collectively represent 25% of regional activity, with Singapore serving as the regulatory innovation hub through MAS's progressive approach to digital banking licenses and cross-border payment facilitation. Indonesia drives volume growth through its 270 million population base and government initiatives promoting financial inclusion, while the Philippines benefits from overseas remittance flows that create demand for digital money transfer services. Australia and Japan represent mature markets with established regulatory frameworks that enable fintech innovation while maintaining consumer protection standards, creating opportunities for premium financial services targeting affluent demographics.
Regulatory Landscape
Asia-Pacific fintech regulation continues to be shaped by jurisdiction-specific licensing requirements and technology-risk obligations, with regulators using sandboxes and targeted rulebooks to support innovation while tightening resilience expectations. In Singapore, the Financial Services and Markets (Digital Token Service Providers) Regulations 2025 took effect on June 30, 2025 under the Financial Services and Markets Act 2022. MAS also progressed 2026 proposals to update Technology Risk Management notices (for IT asset management, risk assessment, and incident management) and published the Safeguards for Agentic Finance at Runtime (SAFR) framework in July 2026 to guide governance for AI agents in financial services.
Across North and Southeast Asia, the Hong Kong Monetary Authority (HKMA) advanced its Fintech 2030 direction (announced in late 2025) through 2026 blueprinting activities. Indonesia continues to operationalize innovation oversight through OJKs Regulatory Sandbox (under POJK FSTI No. 3 of 2024), with updated participant and result listings maintained in 2026. At the regional level, APECs 2025 Finance Ministers Incheon Plan created a non-binding 2026-2030 cooperation roadmap, and APECs 2026 services roadmap emphasized transparent, predictable regulatory procedures and trade-facilitative technical standards, reinforcing interoperability themes for cross-border payments and digital financial services.
Value Chain Analysis
The Asia-Pacific fintech value chain typically starts with regulated rails and identity utilities, including real-time payments such as UPI, PayNow, and PromptPay, along with national e-KYC and digital ID systems. It then adds onboarding and compliance services, including AML screening, fraud analytics, cybersecurity, and regtech, followed by core banking and ledger systems and cloud infrastructure, and ends with distribution through super-apps, neobanks, merchants, and B2B platforms. In 2026, interoperability and multi-rail orchestration became more explicit as an ecosystem function, supported by Project Nexus governance moving toward implementation, with a joint venture of PayNet (Malaysia) and NETS (Singapore) appointed as Nexus Technical Operator, and Indonesia joining as the sixth member.
Product development and monetization increasingly sit at the intersection of payments, lending, and trade workflows, with banks, fintech platforms, card schemes, and guarantee institutions bundling offers for SMEs and MSMEs. Examples include the March 2026 TASConnect and Mastercard alliance to embed digital payments into working-capital flows, and Malaysia-based CapBay with CGC Digital launching a dual-facility guarantee scheme for MSMEs in April 2026 using AI-driven credit assessment. Multi-jurisdiction compliance and data residency constraints remain key bottlenecks, shaping where core processing is hosted and how cross-border products are structured for scaling across ASEAN and North Asia corridors.
Competitive Landscape
The Asia-Pacific fintech market is moderately concentrated, with the top players accounting for a significant share of transaction value. Despite this, the presence of hundreds of specialized providers fosters ongoing competition across different countries and fintech segments. Super-app giants like Ant Group and Tencent use integrated lifestyle services to lock in users and increase switching costs. Meanwhile, regional leaders such as Grab Financial Group and GCash succeed by tailoring services to local needs and navigating regulatory environments more effectively than global players. The strategic focus is shifting toward embedded finance, cross-border payments, and B2B solutions as platforms diversify beyond traditional consumer payment models.
New opportunities are emerging in SME lending, digital insurance distribution, and wealth management—especially for growing middle-class populations in emerging APAC markets. As fintech players explore these areas, success hinges on understanding local financial behaviors and unmet needs. Key technological advancements support this growth, particularly AI-powered risk analytics, real-time fraud prevention, and blockchain-based settlements that enhance speed, security, and compliance. The acquisition of CTIN Pay by Airwallex in 2024 illustrates the region’s consolidation trend, with platforms choosing strategic acquisitions over slow organic expansion. These moves allow players to quickly scale across borders and enhance their product portfolios.
Disruptive entrants are reshaping the landscape by addressing underserved markets with innovative models. Neobanks are focusing on SME clients excluded from traditional financial systems, while insurtech firms embed coverage within digital commerce platforms. Cross-border payment startups are taking advantage of real-time infrastructure to bypass outdated correspondent banking networks. Regulatory frameworks are also becoming a crucial factor in competitive success, favoring firms with established licenses and strong local alliances. International entrants often struggle with the complexity of multi-jurisdictional compliance, giving well-positioned regional players a significant edge.
Asia-Pacific Fintech Industry Leaders
-
Ant Group (Alipay)
-
Tencent (WeChat Pay)
-
Paytm
-
Grab Financial Group
-
Kakao Pay
- *Disclaimer: Major Players sorted in no particular order
Asia-Pacific Fintech Market Companies Covered in this Report
- Ant Group (Alipay)
- Tencent Holdings (WeChat Pay)
- Paytm (One97 Communications)
- Grab Financial Group
- Kakao Pay Corp.
- GCash (Mynt)
- Nium
- Afterpay (Block Inc.)
- Zip Co
- Tonik Bank
- TymeBank
- Judo Bank
- Revolut
- Wise plc
- Airwallex
- Xendit
- Ascend Money (TrueMoney)
- Kredivo Holdings
- KreditBee
- HashKey Group
- MioTech
Market Opportunities and Future Outlook
Cross-border account-to-account connectivity remains a primary opportunity as APAC instant payment rails shift from domestic utilities toward linked networks. The 2026 Project Nexus implementation steps, including the appointment of a Nexus Technical Operator by PayNet and NETS and Indonesias participation as the sixth member, create clearer integration pathways for fintechs offering multi-market remittance, merchant acquiring, and B2B payout products that route over QR and instant-transfer schemes rather than card-only corridors.
A second opportunity area is compliant digital-asset and tokenization infrastructure that plugs into existing banking and capital-markets processes, supported by more prescriptive rulemaking in 2026. Australias Corporations Amendment (Digital Assets Framework) Act 2026 empowered ASIC to set asset-holding and settlement standards for tokenized custody platforms, and HKMA advanced Fintech 2030 workstreams in 2026 that include risk and preparedness initiatives. These regulatory anchors, together with trade-finance modernization initiatives such as Oceanus Group and HashKey Groups April 2026 MOU to use regulated stablecoin settlement infrastructure on the ODIN platform, open room for institutional-grade custody, settlement, and programmable payment modules integrated into wealth, treasury, and trade workflows.
Recent Industry Developments in Asia-Pacific Fintech Market
- July 2026: Ant International opened a Global Development Centre in Kuala Lumpur, Malaysia, located in the TRX financial district and positioned to support 1,500 fintech roles. The investment strengthens product engineering capacity close to ASEAN growth markets and complements Ant Internationals cross-border payments and merchant solutions footprint.
- April 2026: Airwallex received e-money issuing and Class A Money Services Business licenses from Bank Negara Malaysia. The approvals expand Airwallexs ability to deliver full-stack financial operations locally, supporting broader offerings across payments, collections, and FX for businesses operating in Malaysia and across the region.
- October 2024: Funding Societies acquired CardUp for USD 45 million, combining B2B payments with SME lending across Southeast Asia. The deal broadened distribution for working-capital products by embedding credit into payment workflows and strengthened the platforms reach across multiple ASEAN markets.
Asia-Pacific Fintech Market Report Scope and Research Methodology
Market Definition and Coverage
This market is sized as the revenue generated from fintech service propositions delivered across Asia-Pacific, where technology is used to provide or enable financial services for consumers and businesses.
Scope exclusions: We exclude pure IT outsourcing and generic enterprise software that is not sold as a fintech proposition tied to a financial service outcome.
Segments Covered in This Report
- By Service Proposition
- Digital Payments
- Digital Lending and Financing
- Digital Investments
- Insurtech
- Neobanking
- By End-User
- Retail
- Businesses
- By User Interface
- Mobile Applications
- Web / Browser
- POS / IoT Devices
- By Geography
- India
- China
- Japan
- Australia
- South Korea
- South-East Asia
- Singapore
- Malaysia
- Thailand
- Indonesia
- Vietnam
- Philippines
- Rest of Asia-Pacific
Data Sources, Market Sizing, and Validation
Desk Research
Desk research starts with building the Asia-Pacific demand backdrop using public series and policy signals, then mapping those signals to what fintech providers monetize. We typically refer to sources such as central bank publications and payments statistics, national statistics offices for digital economy indicators, financial regulators for licensing and compliance frameworks, and multilateral bodies such as the World Bank, IMF, and BIS for comparable regional time series.
We also review annual reports, investor presentations, and official press releases of relevant companies, which helps us sanity check revenue mix and country exposure. Peer reviewed journals and patent databases are used selectively to understand which product capabilities are becoming mainstream and how quickly they are diffusing. In addition, we use paid subscriptions for company financials and intelligence, news and financials, and patent databases to reduce gaps where public disclosures are thin. The sources listed here are illustrative only, and many other public documents were reviewed for data collection, validation, and clarification.
Primary Interviews and Surveys
Primary work was used to pressure test adoption and revenue assumptions across key APAC markets, especially where public reporting is uneven and category boundaries can blur. We spoke with fintech operators, banks and non-bank financial institutions, payments ecosystem participants, and domain experts, and then used short surveys to confirm what is actually monetized versus offered as a feature. Because this is a regional market, interviews were balanced across APAC hubs and large domestic markets so our inputs reflect different regulatory settings and customer behavior.
Distribution of primary research fieldwork respondents
| Company type | Respondent position |
|---|---|
| Top tier: 39% | CXOs: 13% |
| Mid tier: 47% | Functional/Unit leaders: 30% |
| Smaller Players: 14% | Managers: 57% |
Market-Sizing & Forecasting
Sizing is built by first reconstructing the addressable fintech revenue pool by service proposition and country set within Asia-Pacific, then rolling it up to a regional total through a top-down and bottom-up combination. The top-down side leans on adoption-led demand build ups, where penetration changes and product usage intensity are translated into monetized revenue pools for propositions such as payments, digital lending, savings and investments, and online insurance.
To keep the model practical, we use market fingerprints that can be checked repeatedly, such as digital payment volumes and their fee behavior, consumer and SME digital banking adoption, lending origination growth in digital channels, insurance policy sales shifting online, and the pace of e-KYC and digital ID enablement. These inputs are then corroborated with selective bottom-up approximations like sampled revenue disclosures, category-level revenue mix from public filings, and channel checks on typical take rates and pricing progression. Where company disclosures are incomplete, gaps are handled by using proxy ratios from similar markets and then re-testing them with primary feedback.
For forecasting, scenario analysis is used to reflect different regulatory and funding climates, and the final path is anchored to what interviewees expect for pricing pressure, customer acquisition costs, and product mix shifts over the forecast period. We also apply simple smoothing to avoid unrealistic step changes unless a clear policy or infrastructure trigger is identified.
Data Validation & Update Cycle
Validation is done through repeated checks across the model layers so the total is not driven by one assumption. We compare outputs with independent signals such as payments system growth, digital account adoption, and category revenue disclosures, then we investigate outliers before sign-off.
A second analyst reviews the math, scope mapping, and key assumptions, followed by a final review that focuses on whether the story matches the numbers. Reports are refreshed annually, and interim updates are triggered when material events occur, such as major regulatory changes, sharp funding shifts, or step changes in payments infrastructure. Before delivery, a fresh pass is completed so clients receive the most current view available at that time.
Mordor Intelligence's Asia Pacific Fintech Market Sizing Compared With Other Published Estimates
Published numbers for Asia-Pacific fintech can look far apart because the term fintech gets used to mean different things, and the years, currencies, and revenue boundaries are not always aligned. Differences also show up when some publishers mix transaction value concepts with revenue concepts, or when they bundle adjacent digital banking software into the same bucket.
Payments volume growth signals, digital adoption indicators, and service-proposition revenue checks are the evidence points that keep Mordor Intelligence tied to a revenue-based APAC fintech scope, rather than a broader digital finance activity measure. Another common gap driver is how online insurance and marketplace-led lending are treated, since some approaches count only platform fees and others count full premium or interest flows. Update timing matters too, because fee compression, cross-border corridor expansion, and policy shifts can move near-term totals if assumptions are not refreshed on a consistent cadence.
Benchmark comparison
| Source | Market Size | Gaps in Research Methodology |
|---|---|---|
| Mordor Intelligence | USD 144.87 B (2025) | |
| Industry Report A | USD 147.69 B (2024) | Uses a different reference year and provides limited clarity on whether the estimate reflects provider revenues or broader fintech activity, which can lift totals when non-revenue flows are blended in. |
| Regional Consultancy B | USD 147.00 B (2025) | Scope appears wider on service definitions and country coverage, and the year basis and inclusion rules are not fully stated, which can shift the counted revenue pool between propositions. |
The spread in the table is best explained by how each estimate draws the boundary between monetized fintech revenue and broader digital finance activity, followed by year alignment and pricing logic. By keeping the unit of measure consistent and rechecking key adoption and fee assumptions across propositions, the market size remains traceable to inputs that can be reviewed and repeated.
Key Questions Answered in the Report
What is the 2026 valuation of the Asia-Pacific fintech market?
The Asia-Pacific fintech market size is USD 167.71 billion in 2026.
How fast will regional fintech revenue grow this decade?
Aggregate revenue is forecast to rise at a 15.76% CAGR and reach USD 348.1 billion by 2031.
Which service segment expands the quickest?
Neobanking grows at 30.46% CAGR, driven by new digital bank licenses across Australia, Hong Kong, and Singapore.
Which user group offers the highest growth upside?
Business users, especially SMEs, record a 25.47% CAGR through 2031 as embedded finance gains traction.
Where is transaction volume increasing the fastest geographically?
India leads with a 27.25% CAGR on the back of UPI’s international rollout and supportive RBI policy.
What role do super-apps play in APAC fintech?
Super-apps integrate payments, lending, and insurance into lifestyle platforms, lowering acquisition costs and boosting user retention across the region.