
Market Overview
| Study Period | 2020 - 2031 |
|---|---|
| Forecast Data Period | 2026 - 2031 |
| Base Year Market Size (2025) | USD 11.89 Billion |
| Market Size (2026) | USD 12.56 Billion |
| Market Size (2031) | USD 16.49 Billion |
| Growth Rate (2026 - 2031) | 5.60 % |
| Market Concentration | High |
Major Players *Disclaimer: Major Players sorted in no particular order Image © Mordor Intelligence. Reuse requires attribution under CC BY 4.0. | |
Asia-Pacific Fighter Aircraft Market Analysis by Mordor Intelligence
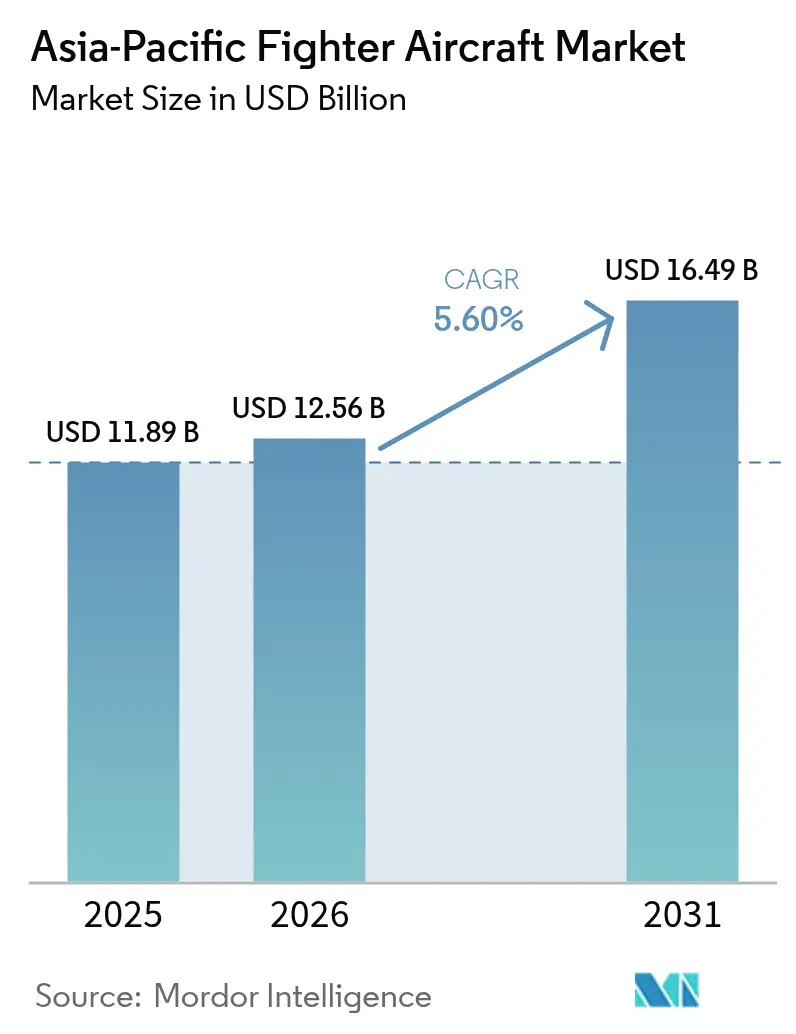
The Asia-Pacific fighter aircraft market size was valued at USD 11.89 billion in 2025 and estimated to grow from USD 12.56 billion in 2026 to reach USD 16.49 billion by 2031, at a CAGR of 5.60% during the forecast period (2026-2031). Growth is propelled by rising regional tensions, continuous fleet modernization, and accelerating 6th-generation development programs reshaping the Asia-Pacific fighter aircraft market landscape. China’s USD 314 billion defense allocation and Japan’s 21% budget jump to USD 55.3 billion illustrate the scale of near-term demand. At the same time, collaborative R&D frameworks such as GCAP reinforce long-term momentum in the Asia-Pacific fighter aircraft market. Supply-chain vulnerabilities around engines and semiconductors temper the outlook, yet robust offset packages and export-linked financing continue to widen buyer access across the Asia-Pacific fighter aircraft market. Overall, competitive intensity is increasing as Western primes confront capable regional manufacturers, many of whom leverage domestic production incentives and relaxed export rules to win share.
Key Report Takeaways
- By take-off and landing, conventional CTOL platforms commanded 57.92% of the Asia-Pacific fighter aircraft market share in 2025, while VTOL/STOVL aircraft are projected to clock the fastest 6.62% CAGR through 2031.
- By fighter generation, 4.5th-generation jets led with a 41.25% revenue share in 2025; 6th-generation programs are forecasted to post an 8.15% CAGR between 2026 and 2031.
- By engine configuration, single-engine designs accounted for 51.88% of the Asia-Pacific fighter aircraft market size in 2025. In contrast, twin-engine platforms are on track for a 6.95% CAGR over the same span.
- By mission role, air-superiority variants held 48.35% share of the Asia-Pacific fighter aircraft market size in 2025; multi-role fighters are advancing at a 6.69% CAGR to 2031.
- By end user, air forces retained 52.26% revenue share in 2025, yet naval aviation is set to expand at an 7.84% CAGR, outpacing all other segments.
- By geography, China dominated the Asia-Pacific fighter aircraft market with a 36.62% share in 2025, leveraging expansive domestic production that skirts export-control risks. India is projected to grow at a 6.78% CAGR through 2031.
Note: Market size and forecast figures in this report are generated using Mordor Intelligence’s proprietary estimation framework, updated with the latest available data and insights as of 2026.
Market Trends and Insights
Drivers Impact Analysis of Asia-Pacific Fighter Aircraft Market*
| Driver | (%) Impact on CAGR Forecast | Geographic Relevance | Impact Timeline |
|---|---|---|---|
| Escalating defense budgets amid rising regional tensions | +1.80% | China, Japan, South Korea, Taiwan, India | Short term (≤ 2 years) |
| Fleet modernization replacing 3rd-generation fighters | +1.20% | India, Indonesia, Thailand, Malaysia, Philippines | Medium term (2-4 years) |
| 6th-generation R&D collaborations accelerate procurement cycles | +0.90% | Japan, Australia, South Korea | Long term (≥ 4 years) |
| Export-linked financing and tech-transfer packages widen buyer base | +0.70% | Southeast Asia, India | Medium term (2-4 years) |
| Indigenous fighter programs unlock domestic spending | +0.60% | India, South Korea, China | Medium term (2-4 years) |
| Carrier-air-wing expansion (China, India, Japan) drives naval fighter demand | +0.40% | China, India, Japan | Long term (≥ 4 years) |
| Source: Mordor Intelligence | |||
Escalating Defense Budgets Amid Rising Regional Tensions
Regional defense outlays climbed to USD 433 billion in 2024, a 7.80% jump that directly underwrites higher fighter procurement lines. China allocated USD 314 billion and Japan boosted its budget by 21% to USD 55.3 billion, enabling multi-year contract awards that lock in output for the Asia-Pacific fighter aircraft market. Taiwan’s USD 16.50 billion spending emphasizes air-defense platforms, while South Korea’s USD 2.9 billion F-15K upgrade shows legacy fleet refresh absorbing expanded funding.[1] Policymakers see airpower as an asymmetric lever in potential multi-domain conflicts, sustaining high capital expenditure on combat aircraft. Local-content mandates, such as India’s 30% offset threshold, further channel new money into domestic industrial ecosystems, reinforcing near-term demand.
Fleet Modernization Replacing 3rd-Generation Fighters
Retirement of Jaguars, MiG-29s, and other legacy assets compels steady intake of newer jets, anchoring the Asia-Pacific fighter aircraft market well beyond pure fleet expansion. India alone needs 35-40 fresh airframes each year to hold squadron numbers as older types phase out. Thailand’s USD 3.65 billion Gripen E/F award over rival bids, plus Indonesia’s USD 8.1 billion Rafale order, highlight modernization choices that prioritize technology transfer alongside performance. Upgrade paths sustain production lines and fund R&D for next-step platforms, while HAL’s goal of 30 Tejas Mk1A jets annually by 2027 illustrates how domestic suppliers ride the same replacement wave.
6th-Generation R&D Collaborations Accelerate Procurement Cycles
Joint development—epitomized by the GCAP initiative and Boeing’s USD 20 billion NGAD win—compresses decision timelines as nations commit funds during design phases. Cost-sharing makes 6th-generation capability accessible to mid-tier budgets, while broader industrial participation builds political backing for the Asia-Pacific fighter aircraft market. Japan’s 2024 export-policy reform allows fighter tech transfer to 15 partners, unlocking broader involvement and diluting unit cost. Among prospective entrants, India must weigh standalone development against consortium membership, accelerating strategic budget allocations that pull forward procurement.
Export-Linked Financing and Tech-Transfer Packages Widen Buyer Base
Comprehensive offset deals and long-tenor financing are growing determinants of contract wins in the Asia-Pacific fighter aircraft market. Turkey offered Indonesia a USD 10 billion KAAN fighter jet proposal that combines multiple financing options with domestic manufacturing capabilities. This approach is similar to the Philippines' USD 5.58 billion F-16 package, which includes extended payment terms and integrated performance-based logistics. Flexible structures lower entry barriers for smaller defense budgets, broadening the buyer field while cementing aftermarket revenue streams for OEMs.
Restraints Impact Analysis of Asia-Pacific Fighter Aircraft Market*
| Restraint | (≈) % Impact on CAGR Forecast | Geographic Relevance | Impact Timeline |
|---|---|---|---|
| Steep acquisition and life-cycle costs | -1.10% | Southeast Asia, smaller economies | Short term (≤ 2 years) |
| ITAR and export-control constraints on critical subsystems | -0.80% | Global, especially US transfers | Medium term (2-4 years) |
| Engine and semiconductor supply-chain bottlenecks | -0.60% | Global, acute in India and South Korea | Short term (≤ 2 years) |
| Production backlogs and delivery slippages | -0.40% | Global, all suppliers | Medium term (2-4 years) |
| Source: Mordor Intelligence | |||
Steep Acquisition and Life-Cycle Costs
Unit prices between USD 40–116 million and life-cycle expenses that often double program outlays squeeze smaller defense budgets, slowing orders within the Asia-Pacific fighter aircraft market. With defense spending ranging from 0.78% of GDP in Indonesia to 4.09% in Myanmar, affordability gaps push nations toward light combat jets, used platforms, or leasing. The KAI FA-50’s USD 700 million Philippine follow-on order underlines how lower-cost fighters with logistics packages appeal to constrained buyers. OEMs respond through performance-based logistics and export-credit financing, yet capital intensity remains a structural brake.
ITAR and Export-Control Constraints on Critical Subsystems
Separate licensing for US-origin engines, sensors, or weapons can stall timelines and limit capability configurations, complicating procurement inside the Asia-Pacific fighter aircraft market.[2] India’s Tejas program has endured GE F404 delays that pushed first deliveries to mid-2025, spotlighting dependency risks. Evolving frameworks such as AUKUS carve out exemptions, but overarching export-control regimes continue to shape platform selection toward suppliers with more streamlined transfer protocols.
*Our forecasts treat driver/restraint impacts as directional, not additive. The impact forecasts reflect baseline growth, mix effects, and variable interactions.
Asia-Pacific Fighter Aircraft Market Segment Analysis
By Take-off and Landing:
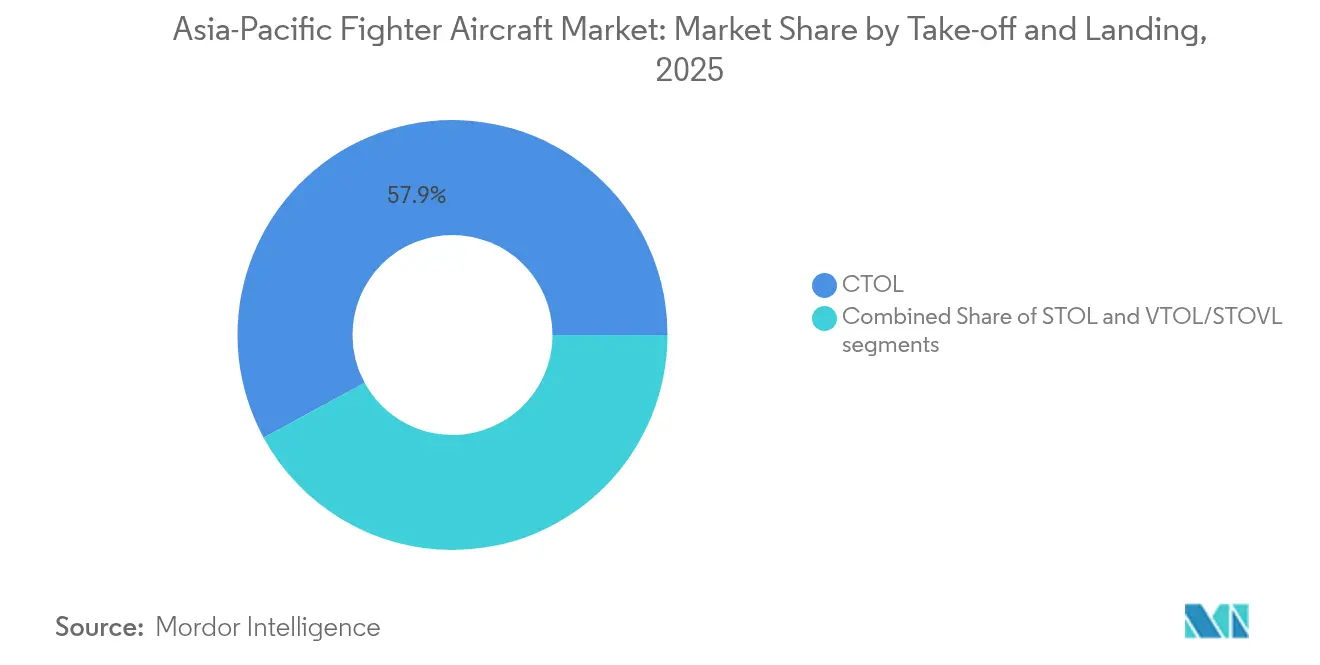
Naval Operations Drive VTOL GrowthConventional CTOL aircraft dominated the Asia-Pacific fighter aircraft market with 57.92% share in 2025, mirroring entrenched land-based force structures. VTOL platforms, although niche, are forecast to record a 6.62% CAGR as carrier programs and distributed basing concepts raise demand. Japan’s decision to embark F-35Bs on Izumo-class vessels demonstrates how VTOL capability extends reach without new supercarriers. Meanwhile, China’s Type 003 Fujian carrier and envisioned Type 004 nuclear ship will amplify VTOL procurement once indigenous designs mature.
Technological advances in thrust-vectoring reduce the payload-range penalties historically associated with VTOL, enhancing attractiveness for expeditionary roles. Combined with evolving ICAO guidelines that enable military VTOL operations in controlled civil airspace, the segment’s role in regional humanitarian response augments its growth trajectory within the Asia-Pacific fighter aircraft market.

By Fighter Generation:
6th-Generation Programs Reshape Procurement4.5th-generation jets held 41.25% Asia-Pacific fighter aircraft market share in 2025, thanks to a balance of proven reliability and upgraded avionics. 6th-generation efforts such as GCAP and NGAD are projected to post an 8.15% CAGR, even though prototypes remain in development. The lingering utility of 4th-generation fleets sustains upgrade business, while 5th-generation purchases fill interim capability gaps.
Manufacturers capitalize on bridge upgrades—active electronically scanned array radars, infrared search-track, and network gateways—to keep incumbents relevant ahead of 6th-generation arrival. China’s unveiling of advanced prototypes exerts competitive pressure, prompting earlier commitments that bolster the Asia-Pacific fighter aircraft market size for next-generation platforms.
By Engine Configuration:
Twin-Engine Demand Reflects Range RequirementsSingle-engine fighters captured a 51.88% share of the Asia-Pacific fighter aircraft market in 2025, favored for cost efficiency and simpler maintenance. Yet twin-engine variants are on a 6.95% CAGR trajectory as maritime nations prioritize range and redundancy for overwater missions. Despite higher acquisition costs, long-range strike and patrol needs tilt procurement toward twin-engine designs.
Delivery setbacks on GE F404 and F414 lines have exposed the vulnerability of single-engine programs like Tejas, intensifying interest in diversified powerplants and twin-engine alternatives. As engine reliability gains shrink the cost delta, twin-engine offerings gain traction across the Asia-Pacific fighter aircraft market.
By Mission Role:
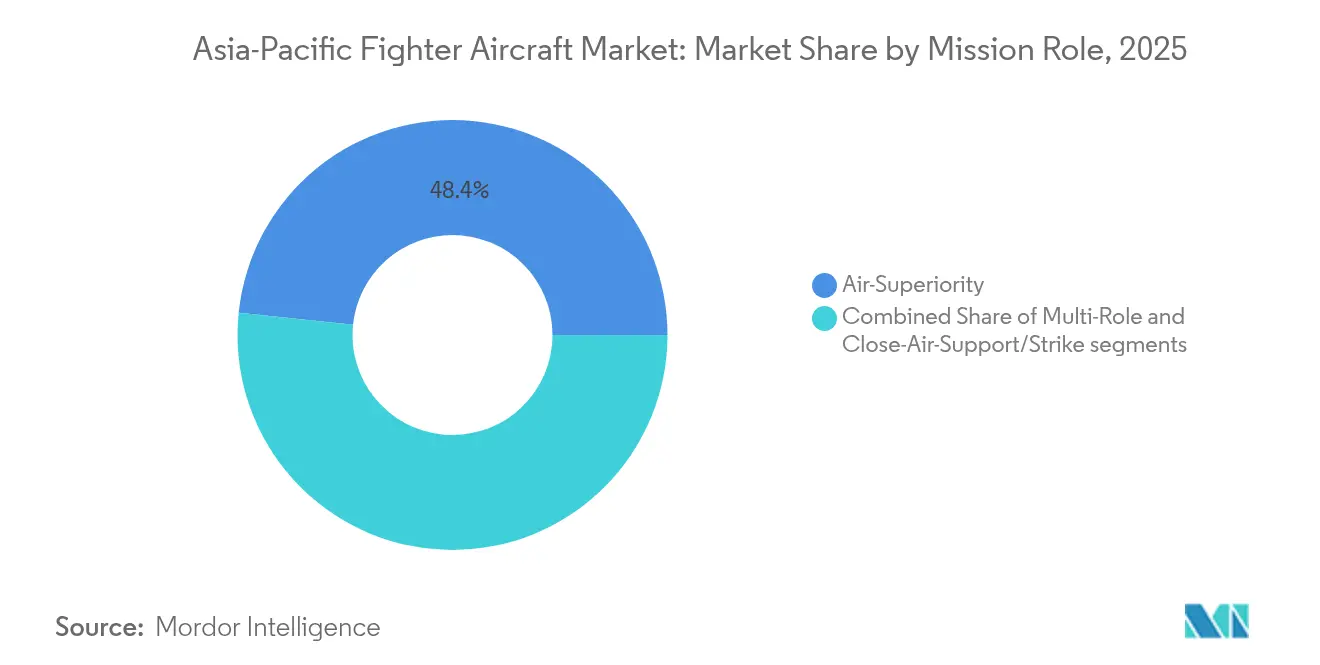
Multi-Role Versatility Commands PremiumAir-superiority variants preserved a 48.35% share in 2025, yet budget realities are steering procurements toward multi-role fighters, anticipated to grow 6.69% annually. Operators seek single-platform air-to-air, strike, and reconnaissance solutions to limit training pipelines and inventories. Thailand’s Gripen E selection underscores how all-domain flexibility outweighs narrowly focused performance in evaluation matrices.
Advances in sensor fusion and modular weapons stations allow rapid task reconfiguration, lifting utilization rates, and underpinning premium pricing. Therefore, the Asia-Pacific fighter aircraft market is shifting toward platforms that deliver mission agility without sacrificing survivability.
By End User:
Naval Aviation Growth Outpaces Traditional Air ForcesAir Forces retained 52.26% of 2025 revenues, yet Naval Aviation is projected to outstrip all other customers with an 7.84% CAGR. China’s rapid carrier fleet expansion and Japan’s F-35B embarkation create sustained orders for carrier-capable fighters. Specialized corrosion protection and arrestor hooks elevate unit prices, boosting value growth even as absolute volumes remain lower than land-based fleets.
India’s prospective third carrier further reinforces long-term naval demand, while Indonesia’s interest in acquiring a legacy Italian carrier signals latent appetite among emerging navies. These factors make Naval Aviation the highest-growth customer subset in the Asia-Pacific fighter aircraft market.
Geography Analysis
China Fighter Aircraft Market
China dominated the Asia-Pacific fighter aircraft market with a 36.62% share in 2025, leveraging expansive domestic production that skirts export-control risks. Indigenous output of 5th-generation J-20s, forecasted to exceed 500 units by 2025, anchors value creation, while naval J-35 variants feed a growing carrier force. Beijing’s integrated supply chain and export ambitions reinforce its leadership position, though geopolitical headwinds may limit sales to select partners.
India Fighter Aircraft Market
India represents the fastest-growing geography with a 6.78% CAGR through 2031. The country’s urgent need for 35-40 fighters annually drives parallel tracks: foreign buys such as Rafale and indigenous programs encompassing Tejas Mk1A, Mk2, and AMCA. HAL’s collaboration with private industry to hit 30 Tejas deliveries a year illustrates scale-up underway, yet engine bottlenecks remain a risk to meeting timelines.
APAC Fighter Aircraft Market
Japan, South Korea, Indonesia, and the wider Southeast Asian bloc together compose a diversified demand pool. Tokyo’s relaxed export rules enable fighter technology transfers to 15 nations, adding incremental revenue streams and deepening its stake in the Asia-Pacific fighter aircraft market. Seoul’s KF-21, buoyed by a 2025 UAE Letter of Intent, signals emergence of a new regional supplier with 120 domestic orders set by 2032. Indonesia’s multi-vendor strategy—Rafale, potential Su-35 revival, and KAAN participation—reflects a pragmatic pursuit of capability, financing, and industrial gain. Budget-constrained Southeast Asian states lean toward light combat aircraft, an area amplified by KAI’s FA-50 successes and performance-based logistics model.
Regulatory Landscape
Regulation in the Asia-Pacific fighter aircraft market is shaped by defense procurement rules, export-control compliance, and tighter civil-military coordination for airspace and aviation safety governance. In Australia, the Australian Airspace Policy Statement (AAPS) 2026 commenced in March 2026, formalizing civil-military airspace administration and enabling closer integration between Defence and the Office of Airspace Regulation. This direction is also reinforced through the use of temporary military operating areas for major exercises such as MILEX DIAMOND SPEAR 2026 off the New South Wales and South Queensland coast, which affects how military flight activity is deconflicted with civil aviation.
Regionally, safety and security alignment is influenced by ICAO guidance, including the Asia-Pacific Regional Aviation Safety Plan 2026-2028 and country-level plans such as Japan's National Aviation Safety Plan 2026. These frameworks support harmonized approaches to safety management, cyber security, and airspace procedures that interact with military operations. In Japan, defense industrial governance is also evolving around multinational development structures, with the GCAP framework and its GIGO organization (operational from FY2025) centralizing management of the next-generation fighter program. At the same time, Japan continues domestic F-35A final assembly and checkout (FACO) through FY2027, reflecting ongoing emphasis on sovereign capability and controlled technology transfer.
Value Chain Analysis
The value chain spans requirements definition and budgeting, platform and subsystem design, component manufacturing (structures, avionics, and propulsion), final assembly and integration, and certification and acceptance, followed by long-tail support through spares, maintenance, upgrades, and performance-based logistics. In Asia-Pacific, the chain increasingly includes local industrial participation mandates and co-production models, shifting workshare toward domestic private-sector and state-linked manufacturers. India illustrates this with the May 2026 Ministry of Defence RFP issued to three private consortia (Tata Advanced Systems, an L&T-led group, and a Bharat Forge-led group) to shortlist a production partner for the AMCA program, while negotiations with France (June 2026) point to movement from direct import toward co-develop and co-manufacture arrangements for Rafale.
High-technology subsystems remain the main bottlenecks, particularly engines and certain electronics, where foreign IP controls and capacity constraints can drive delivery slippages. An upstream development is the April 2026 technical agreement between HAL and GE Aerospace to domestically produce the F414-INS6 engine for Tejas Mk-2, TEDBF, and AMCA, which aims to reduce propulsion-supply risk and expand in-country manufacturing depth. Across the region, OEMs and tier suppliers are also diversifying sourcing and industrial ecosystems, with global aerospace firms expanding component procurement from India (including Airbus publicly targeting higher sourcing levels). Southeast Asian participation is also taking shape through offset-linked supply chain integration, such as Indonesia evaluating PT Dirgantara Indonesia's role in the Boeing F-15EX supply chain (June 2025).
Competitive Landscape
Competition is intensifying as regional OEMs erode Western primes' historical dominance in the Asia-Pacific fighter aircraft market. Lockheed Martin, Boeing, and Airbus still command advanced technology portfolios, yet they must contend with delivery slippages, rising unit costs, and ITAR-linked constraints. Turkey's KAAN, South Korea's KF-21, and China's J-series fighters offer credible alternatives, often bundled with generous offsets and flexible financing that resonate with emerging economies.
Strategic moves showcase adaptive postures: Boeing is ramping F-15EX lines to two jets monthly to clear backlogs and free capacity for NGAD prototypes. KAI signed the first export performance-based logistics deal with the Philippines, locking in long-tail revenue and highlighting service differentiation. Dassault's tight production schedules for Rafale—24 jets annually through 2033—underline supply pressures that could open windows for agile competitors.[4]
Technology objectives center on sensor fusion, secure networking, and manned-unmanned teaming rather than raw speed or altitude. Vendors adept at integrating open-architecture avionics and offering sovereign software rights gain bargaining power, especially where export-control anxieties persist. Consequently, the Asia-Pacific fighter aircraft market is moving toward a balanced contest in which value, autonomy, and regulatory ease weigh as heavily as classic performance metrics.
Asia-Pacific Fighter Aircraft Industry Leaders
-
Mitsubishi Heavy Industries, Ltd.
-
Lockheed Martin Corporation
-
Hindustan Aeronautics Limited (HAL)
-
The Boeing Company
-
Aviation Industry Corporation of China
- *Disclaimer: Major Players sorted in no particular order

Asia-Pacific Fighter Aircraft Market Companies Covered in this Report
- Hindustan Aeronautics Limited (HAL)
- Mitsubishi Heavy Industries, Ltd.
- Korea Aerospace Industries, Ltd.
- PT Dirgantara Indonesia
- Kawasaki Heavy Industries, Ltd.
- The Boeing Company
- Airbus SE
- Aviation Industry Corporation of China
- United Aircraft Corporation
- Lockheed Martin Corporation
- Saab AB
Market Opportunities and Future Outlook
A primary opportunity centers on government-driven localization and sovereign manufacturing requirements embedded into fighter acquisition pathways, creating near-term demand for domestic structures, wiring, mission-system integration, tooling, test infrastructure, and certified MRO capabilities. India provides a clear proof point: the Indian Air Force submitted a formal Letter of Request to France for 114 Rafale F4 fighters in May 2026, with indigenous content requirements stated to start at 40% and scale to 60%. That shift requires industrial partnering and local supply chain build-out, rather than a simple platform import. In parallel, India opened competition for an AMCA production partner via a May 2026 RFP to private consortia (bidding closure noted as July 28, 2026), which expands addressable demand for manufacturing ecosystems, program management capability, and tier-1 and tier-2 supplier qualification.
A second opportunity is linked to next-generation collaborative development and upgrade programs that expand demand for digital engineering, advanced materials, sensors, secure networking, and manned-unmanned teaming enablers across the region. In July 2026, the GCAP partners (Japan, the UK, and Italy) awarded a multi-billion development contract to advance design and development, which formalizes a larger industrial workload for participating champions and their supplier networks. Australia also signaled near-term modernization spending priorities through its April 2026 Integrated Investment Program, focusing on upgrades to existing F-35A, F/A-18F, and E-18G fleets and a new lead-in fighter training system to replace the Hawk 127. This supports demand for upgrade kits, systems integration, mission-data and training infrastructure, and sustainment services alongside new-aircraft procurement.
Recent Industry Developments in Asia-Pacific Fighter Aircraft Market
- July 2026: The UK, Japan, and Italy awarded a GBP 4.6 billion contract to the industry joint venture Edgewing to advance the design and development phase of the Global Combat Air Programme (GCAP) next-generation fighter. The award formalizes multi-year workload and funding continuity for participating primes and their supplier networks, strengthening the region's sixth-generation development pipeline.
- April 2026: Hindustan Aeronautics Limited and GE Aerospace concluded a technical agreement for co-production of the F414-INS6 turbofan engine in India, intended for Tejas Mk-2, TEDBF, and AMCA. The step advances domestic propulsion industrialization and addresses a core supply-chain constraint that has affected indigenous fighter delivery schedules.
- April 2025: Lockheed Martin stated that a US approval had paved the way for the Philippines to move forward with the F-16 platform as part of its airpower modernization. The clearance supports a higher-end procurement pathway alongside the country's light-fighter fleet and reinforces the role of government-to-government approvals and export controls in shaping timelines and configurations.
Asia-Pacific Fighter Aircraft Market Report Scope and Research Methodology
Market Definition and Coverage
For this study, the market covers the value of fighter aircraft programs across Asia-Pacific, counted as procurement and modernization spending that results in mission-capable fighter platforms being delivered or upgraded for operators in the region.
Scope exclusions: We exclude unmanned combat aerial vehicles, basic trainers without a fighter role, and broader military aviation spending that is not attributable to fighter aircraft platforms.
Segments Covered in This Report
- By Take-off and Landing
- Conventional Take-off and Landing (CTOL)
- Short Take-off and Landing (STOL)
- Vertical Take-off and Landing (VTOL/STOVL)
- By Fighter Generation
- 4th Generation
- 4.5th Generation
- 5th Generation
- 6th Generation/NGAD
- By Engine Configuration
- Single-Engine
- Twin-Engine
- By Mission Role
- Air-Superiority
- Multi-Role
- Close-Air-Support/Strike
- By End User
- Air Force
- Naval Aviation
- Marine/Army Aviation
- By Geography
- China
- India
- Japan
- South Korea
- Indonesia
- Rest of Asia-Pacific
Data Sources, Market Sizing, and Validation
Desk Research
Desk work starts with building a clean view of planned and in-service fleets, procurement intent, and delivery schedules, since fighter programs in Asia-Pacific do not follow a smooth procurement rhythm like consumer procurement. We refer to public defense budget documents, parliamentary or audit reports, and national procurement portals where available, to anchor planned spend and timing.
To keep assumptions grounded, we also use sources such as SIPRI military expenditure series, IISS The Military Balance style fleet summaries, UN Comtrade trade codes for aircraft and parts, and aircraft certification and safety authority releases where relevant for platform induction timelines. Company filings, annual reports, investor decks, and credible press help validate contract announcements, upgrade packages, and delivery slippages. In a few cases, paid subscriptions for defense platform intelligence and patent databases are used to cross-check configurations, upgrade content, and program maturity. The sources listed here are illustrative, and many other public references were used for data collection, validation, and clarification.
Primary Interviews and Surveys
Primary inputs are taken from structured interviews and short surveys with defense procurement stakeholders, program integrators, maintenance and upgrade specialists, and industry experts who track operational readiness and delivery execution. For a regional view, we balance feedback across Asia-Pacific (APAC) and also sanity-check it against import dependence patterns and local manufacturing realities, so gaps left by public disclosures can be narrowed before finalizing totals.
Distribution of primary research fieldwork respondents
| Company type | Respondent position |
|---|---|
| Top tier: 38% | CXOs: 12% |
| Mid tier: 48% | Functional/Unit leaders: 34% |
| Smaller Players: 14% | Managers: 54% |
Market-Sizing & Forecasting
The core model uses a top-down approach where country-level procurement plans, budget line items, and known fleet replacement needs are reconstructed into a yearly demand pool for fighters, and then converted into value using program timing and typical payment phasing. To avoid overcounting, totals are corroborated with selective bottom-up approximations such as sampling announced contract values, cross-checking expected unit deliveries by year, and applying plausible average program value ranges when only partial pricing is public.
Inputs that matter in this market include defense budget growth and allocation to air power, fleet age and retirement schedules, announced order backlogs and delivery calendars, upgrade intensity (avionics, radar, weapons integration), and country-specific readiness drivers linked to regional security conditions. We also track how much of the activity is new-build versus mid-life upgrade, because the value curve and timing look different across the two. Forecasts are built using scenario analysis with a base case anchored on funded programs, and then adjusted through expert consensus on slippages, contract amendments, and procurement pacing. Where bottom-up data is missing for a country or year, we fill gaps using comparable program benchmarks and then re-check the outcome against budget affordability and fleet size realities.
Data Validation & Update Cycle
Outputs are checked against independent signals like published defense budgets, known fleet counts, and the cadence of major program milestones, and then any large variance is reviewed before sign-off. If an assumption drives an outsized change, we revisit the input chain and, when needed, re-contact a relevant respondent to confirm whether the shift is real or timing related.
A second analyst review is completed to spot outliers, currency conversion issues, and inconsistent year mapping across countries. The report is refreshed annually, and interim updates are triggered when material contract awards, cancellations, or delivery pauses occur. Before delivery, we run a final pass so clients receive the most current view available at that time.
Mordor Intelligence's Asia Pacific Fighter Aircraft Market Size Compared Against Other Published Estimates
Published market values for fighter aircraft in Asia-Pacific can look far apart because the boundaries are not always aligned, and the timing of procurement cycles is handled differently. Differences usually come from what is counted as a fighter program versus broader military aviation, and whether upgrades are included with new deliveries.
By tracking funded procurement line items and delivery calendars, Mordor Intelligence keeps the total focused on fighter aircraft programs in Asia-Pacific and avoids mixing in wider military planes categories, which can inflate the number when transports, trainers, or UAVs are bundled in.
Benchmark comparison
| Source | Market Size | Gaps in Research Methodology |
|---|---|---|
| Mordor Intelligence | USD 11.89 B (2025) | |
| Regional Consultancy A | USD 28.89 B (2024) | Uses a broader definition that appears to include wider aircraft types and applications, and it does not clearly separate fighter-only procurement from multi-platform military aviation value. |
| Industry Publisher B | USD 9.00 B (2024) | Appears to rely on a narrower program set or partial country coverage, and the year reference and inclusion rules are not clearly stated, which can suppress the total versus a funded-plan based build. |
The spread across the table is largely explained by scope boundaries and year mapping, not by a single different growth view. When the model is tied to funded plans, delivery timing, and upgrade content, the resulting estimate is easier to trace back to what countries are actually buying and modernizing in each year.
Key Questions Answered in the Report
How large is the Asia-Pacific fighter aircraft market in 2026?
The Asia-Pacific fighter aircraft market size reached USD 12.56 billion in 2026 and is on a 5.60% CAGR growth path to 2031.
Which segment is expanding fastest?
Naval aviation demand is projected to rise at an 7.84% CAGR as China, India, and Japan grow carrier forces.
What share do 4.5th-generation fighters hold today?
5th-generation aircraft commanded 41.25% Asia-Pacific fighter aircraft market share in 2025, making them the current revenue leader.
Why are twin-engine fighters gaining ground?
Twin-engine designs are forecasted to grow 6.95% annually because regional operators need longer-range, over-water safety margins.
How is Japan’s export-policy change affecting suppliers?
Relaxed rules now let Japan transfer fighter technology to 15 nations, widening consortium participation and intensifying competition in the region.