Market Overview
| Study Period | 2017 - 2030 |
|---|---|
| Base Year For Estimation | 2024 |
| Forecast Data Period | 2025 - 2030 |
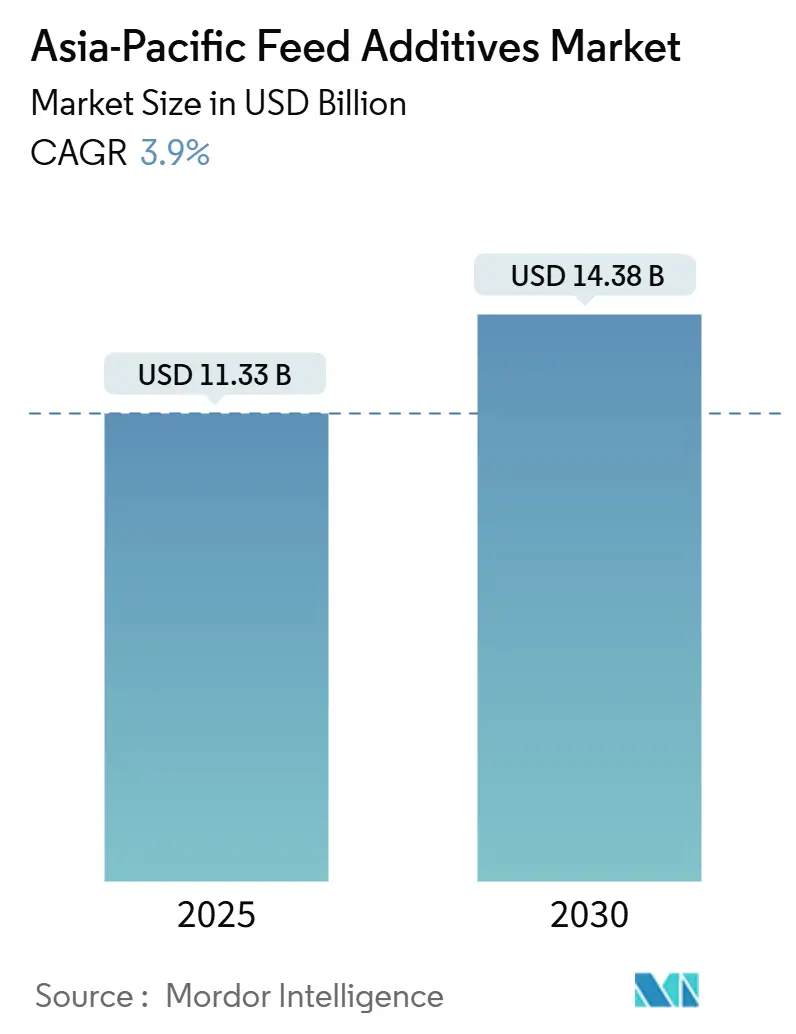
| Market Size (2025) | USD 11.33 Billion |
| Market Size (2030) | USD 14.38 Billion |
| Growth Rate (2025 - 2030) | 3.90% CAGR |
| Market Concentration | Low |
Major Players
*Disclaimer: Major Players sorted in no particular order Image © Mordor Intelligence. Reuse requires attribution under CC BY 4.0. |
|
Asia-Pacific Feed Additives Market Analysis by Mordor Intelligence
The Asia-Pacific feed additives market size is valued at USD 11.33 billion in 2025 and is projected to reach USD 14.38 billion in 2030, expanding at a 3.90% CAGR. Robust poultry demand, aquaculture intensification, and a decisive regulatory move away from antibiotic growth promoters underpin this trajectory, while precision nutrition platforms enable tighter feed conversion ratios. China’s 2024 residue-testing rules hastened the switch to functional additives, and regional feed mills now favor real-time nutrient modeling that cuts crude-protein costs without compromising growth. Strategic investments in amino-acid manufacturing, notably lysine and methionine, strengthen localized supply, whereas natural antioxidant approvals open avenues for shelf-life protection in tropical climates. Rising carbon footprint labeling and the adoption of portable NIR further steer manufacturers toward low-nitrogen diets and dose optimization. The cyclical price spikes in corn and soybeans continue to compress inclusion rates, especially in import-dependent economies.
Key Report Takeaways
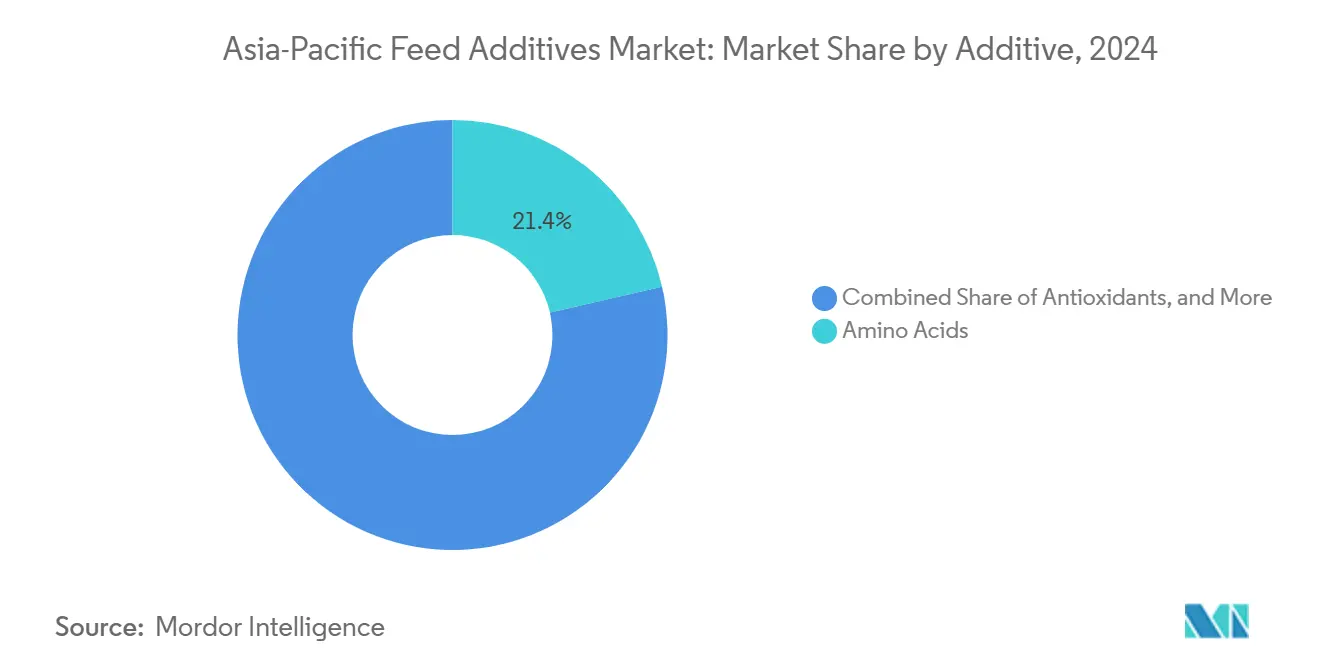
- By additive type, amino acids led with 21.4% of the Asia-Pacific feed additives market share in 2024, while antioxidants recorded the fastest projected CAGR at 4.43% to 2030.
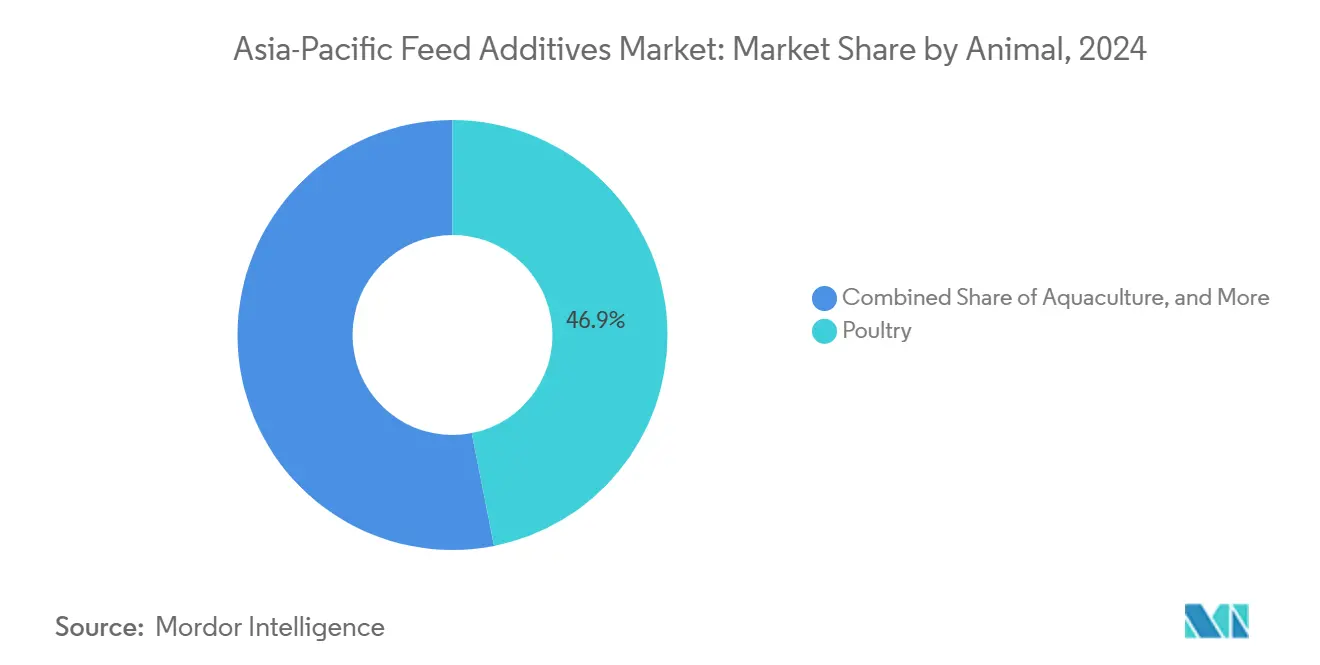
- By animal type, poultry accounted for 46.9% of the Asia-Pacific feed additives market share in 2024 and is projected to grow at a 4.46% CAGR through 2030.
- By geography, China accounted for 42.1% of the Asia-Pacific feed additives market size in 2024. Thailand is forecast to achieve the highest 4.5% CAGR between 2025 and 2030.
Asia-Pacific Feed Additives Market Trends and Insights
Drivers Impact Analysis
| Driver | (~) % Impact on CAGR Forecast | Geographic Relevance | Impact Timeline |
|---|---|---|---|
| Escalating Poultry and Aquaculture Output | +1.2% | China, Thailand, Vietnam, and Philippines | Medium term (2-4 years) |
| Accelerating Bans on Antibiotic Growth Promoters | +0.9% | India, China, South Korea, and Australia | Short term (≤ 2 years) |
| Rapid Expansion of Integrated Feed Mills Adopting Precision Nutrition | +0.7% | China, Thailand, Indonesia, and Vietnam | Medium term (2-4 years) |
| Rising Amino-Acid Fortification to Meet Higher Protein Conversion Targets | +0.6% | Global Asia-Pacific, strongest in China, India | Long term (≥ 4 years) |
| Roll-Out of Carbon-Footprint Labeling Spurring Low-Nitrogen Diet Additives | +0.4% | Australia, Japan, and South Korea | Long term (≥ 4 years) |
| Uptake of Portable Near-Infrared (NIR) Testing that Enables Real-Time Dose Optimization | +0.3% | China, Thailand, and the Philippines | Medium term (2-4 years) |
| Source: Mordor Intelligence | |||
Escalating Poultry and Aquaculture Output
Production intensification across Asia-Pacific's poultry and aquaculture sectors creates sustained demand for performance-enhancing additives that optimize feed conversion ratios under high-density farming conditions. Thailand's poultry production capacity expansion, supported by USD 2.8 billion in government incentives through 2026, exemplifies the region's commitment to protein security [1]Source: Thailand Board of Investment, “Investment Opportunities in Feed Industry 2024,” BOI.GO.TH. Vietnam’s shrimp farms now utilize enzyme-probiotic blends to enhance survival rates amid intensive cultivation. Continuous throughput compels mills to adopt amino-acid balancing and gut health solutions tailored to fast-growing species, reinforcing the Asia-Pacific feed additives market as a productivity enabler.
Accelerating Bans on Antibiotic Growth Promoters
India’s April 2025 prohibition of more than 200 antibiotic compounds, South Korea’s expanded September 2024 restricted list, and China’s residue-testing mandates collectively recast purchasing patterns toward organic acids, phytogenics, and probiotics [2]Source: Food Safety and Standards Authority of India, “Advisory on Antibiotic Ban Implementation,” FSSAI.GOV.IN. South Korea's Ministry of Food and Drug Safety expanded its list of prohibited substances in September 2024, creating immediate market opportunities for organic acid and essential oil alternatives. China's regulatory framework now requires comprehensive residue testing for all feed additives, elevating compliance costs while favoring established players with robust quality assurance capabilities. These regulatory shifts create first-mover advantages for companies that invested early in antibiotic alternatives, while traditional antibiotic suppliers face declining market access across the region's major protein-producing countries.
Rapid Expansion of Integrated Feed Mills Adopting Precision Nutrition
Technology-enabled feed manufacturing facilities are increasingly deploying real-time nutritional optimization systems that adjust additive inclusion rates based on ingredient variability and target specific animal performance metrics. Cargill's USD 180 million investment in precision nutrition capabilities across Southeast Asia includes the installation of near-infrared spectroscopy, enabling dynamic formulation adjustments [3]Source: Cargill Inc., “Precision Nutrition Investment Southeast Asia,” CARGILL.COM. DSM-Firmenich’s analytics alliance in China layers predictive modeling over seasonal ingredient data. Such data-driven approaches enable mills to compress formulation costs and reinforce customer loyalty, thereby embedding precision nutrition as a core competitive lever within the Asia-Pacific feed additives market.
Rising Amino-Acid Fortification to Meet Higher Protein Conversion Targets
Intensifying focus on feed efficiency drives sophisticated amino acid balancing strategies that reduce crude protein levels while maintaining optimal growth performance through targeted supplementation. Indonesia's aquaculture sector is increasingly adopting crystalline amino acid supplementation, which reduces nitrogen excretion by up to 30% while maintaining fish growth rates. Japanese livestock integrators apply phase-feeding profiles that trim protein inputs yet sustain carcass grades. This shift cements amino acids as foundational to the Asia-Pacific feed additives market, positioning lysine and methionine as supply-chain linchpins.
Restraints Impact Analysis
| Restraint | (~) % Impact on CAGR Forecast | Geographic Relevance | Impact Timeline |
|---|---|---|---|
| Volatile Corn- and Soy-Price Cycles Squeezing Additive Inclusion Rates | -0.8% | Global Asia-Pacific, strongest impact in import-dependent markets | Short term (≤ 2 years) |
| Lengthy Product-Registration Timelines | -0.5% | India, Indonesia, Philippines, and Vietnam | Medium term (2-4 years) |
| Limited On-Farm Know-How for Precision Dosing in Smallholder Clusters | -0.4% | India, Indonesia, Philippines, and Vietnam | Long term (≥ 4 years) |
| Consumer Skepticism of Synthetic Labels Curbing Some Antioxidant Demand | -0.3% | Australia, Japan, and South Korea | Medium term (2-4 years) |
| Source: Mordor Intelligence | |||
Volatile Corn and Soy Price Cycles Squeezing Additive Inclusion Rates
Corn futures reached an 18-month peak in August 2024, prompting mills in Southeast Asia to trim premium inclusions to sustain feed price points. Soybean meal price fluctuations, exacerbated by South American weather disruptions and trade policy uncertainties, create quarterly budget pressures that particularly affect smaller feed manufacturers with limited hedging capabilities. This cyclical constraint proves most acute in import-dependent markets, such as the Philippines and Indonesia, where currency depreciation amplifies ingredient cost pressures. The volatility cycle typically spans 18-24 months, creating predictable windows where additive demand contracts despite underlying growth in animal production volumes.
Lengthy Product Registration Timelines
Regulatory approval processes across emerging Asia-Pacific markets create substantial barriers to new product introduction, delaying innovation adoption and limiting competitive dynamics. India's Central Committee for Food Standards requires 24-36 months for approvals of novel additives, creating first-mover disadvantages for innovative products while protecting established market positions. Indonesia's National Agency for Drug and Food Control implemented enhanced safety evaluation protocols in 2024 that extend approval timelines by an additional 8-12 months for imported additives. These extended timelines particularly disadvantage breakthrough technologies, such as novel enzymes and targeted probiotics, that could address emerging production challenges but face regulatory bottlenecks that delay market access.
Segment Analysis
By Additive: Amino Acids Sustain Leadership While Antioxidants Accelerate
Amino acids led with 21.4% of the Asia-Pacific feed additives market share in 2024, underscoring their crucial role in efficient protein utilization. The Asia-Pacific feed additives market size for amino acids is bolstered by China’s scale in lysine and methionine, which reduces the landed cost for regional millers. Lysine anchors corn-soy diets, whereas methionine’s rise in marine fish rations signals aquaculture’s pivot toward tailored sulfur profiles. Continuous portfolio expansion into threonine and valine further embeds amino acids across feed formulations.
Antioxidants post a 4.43% forecast CAGR, buoyed by the European Food Safety Authority’s (EFSA) 2024 nod for mixed tocopherols in fish diets, an approval pattern many Asian regulators follow. Warm, humid storage conditions intensify the risk of oxidative spoilage, compelling the adoption of natural antioxidant complexes that extend shelf life. Enzymes and probiotics continue to gain momentum as mills strive for higher digestibility and gut integrity, while mycotoxin detoxifiers are gaining traction in regions with persistent fungal pressure.
Note: Segment shares of all individual segments available upon report purchase
Get Detailed Market Forecasts at the Most Granular Levels
Download PDF
By Animal: Poultry Dominance Meets Aquaculture Dynamism
Poultry held a 46.9% of the Asia-Pacific feed additives market share in 2024 and is projected to grow at a 4.46% CAGR through 2030, reflecting demand for low-cost white meat and eggs across urbanizing markets. Integrated broiler chains, such as Charoen Pokphand’s USD 500 million automated complexes, streamline additive application, thereby fortifying the Asia-Pacific feed additives market share for this species. Specialized enzymes targeting shell strength gain traction in layers, and phytogenics enhance bird gut robustness under mandates to reduce antibiotic use.
Aquaculture, although smaller in scale, outpaces other segments as sustainability concerns shift consumer diets toward fish and shrimp. Vietnam’s farms now trial probiotic-enzyme stacks that boost shrimp survival, while Indonesian operators refine protein-dense formulas leveraging amino-acid profiles. Ruminant demand remains steady, centered on dairy productivity enhancers, and swine adoption rebounds as regional herds repopulate after recent disease outbreaks. Companion animal and niche livestock present emerging, premium-priced additive targets.
Note: Segment shares of all individual segments available upon report purchase
Get Detailed Market Forecasts at the Most Granular Levels
Download PDF
Geography Analysis
China processed over 260 million metric tons of feed in 2024, accounting for a 42.1% regional share and serving as a significant demand anchor for the Asia-Pacific feed additives market. It's 2024 registration overhaul forces quality and documentation upgrades that winnow out smaller suppliers, consolidating volume among integrated incumbents. Domestic amino-acid titans Meihua Holdings and Fufeng Group reinforce price leadership, while widespread NIR installations deliver real-time precision dosing that protects margins amid volatile ingredient markets.
Thailand is poised for a 4.5% CAGR, the fastest within the bloc, underpinned by its ambition to be Southeast Asia’s aquaculture epicenter. Targeted tax exemptions on precision-nutrition imports and accelerated depreciation schedules motivate mill modernization. Joint ventures with global innovators, exemplified by Cargill, Inc. and DSM-Firmenich AG, funnel technology into local ecosystems, enabling rapid upscale deployment of functional additives.
India and Indonesia collectively portend sizable upside as protein intake climbs. India’s fragmented base gradually coalesces into commercial clusters that adopt data-driven formulations, while Indonesia leverages expanding shrimp and fish acreage to trial species-specific blends. Japan and South Korea emphasize premium, clean-label proteins, favoring natural antioxidants and trace minerals. Australia’s focus on sustainability and traceability stimulates demand for organic supplements, whereas Vietnam and the Philippines ride production intensification and cold-chain investments to integrate sophisticated additive programs. Emerging economies across the region gain access through regional supply chain integration spearheaded by multinational distributors.
Competitive Landscape
The Asia-Pacific feed additives market remains fragmented, with the major companies are controlling a significant share of regional revenue, an arrangement that encourages both price competition and rapid product innovation. Amino-acid manufacturing is concentrated among a handful of high-volume Chinese producers that enjoy fermentation scale advantages, whereas specialty categories such as enzymes, probiotics, and phytogenics are divided among dozens of global and local firms. Multinationals that pair broad portfolios with technical service teams continue to capture share from smaller traders by bundling advisory support with each shipment.
Capacity expansion and deal-making define the current strategy. Evonik Industries AG and Vland started a USD 300 million amino-acid complex in 2024 to anchor cost leadership on the mainland, while Barentz paid USD 180 million for Fengli in 2025 to secure downstream aquaculture reach. Cargill Inc.’s USD 200 million upgrades in Vietnam and Indonesia, DSM-Firmenich AG’s USD 120 million precision nutrition rollout, and Camlin Fine Sciences’ USD 95 million acquisition of Vitafor demonstrate a shared belief that control over high-margin functional additives and localized supply chains is vital for long-term growth. Regional specialists counter by tightening distribution networks and offering commodity acids and binders at razor-thin margins to protect core accounts.
Technology and compliance are now decisive differentiators. Near-infrared sensors, blockchain traceability, and real-time formulation software enable suppliers to secure multi-year contracts by reducing waste and ensuring label integrity. Regulators are tightening residue and efficacy standards, raising the cost of market entry yet rewarding companies with deep quality-assurance programs and local trial data. A parallel shift toward natural antioxidants and probiotic replacements for antibiotics is opening premium niches that favor research-intensive firms, while smallholders’ gradual adoption of precision dosing tools extends runway for growth in value-added solutions.
Asia-Pacific Feed Additives Industry Leaders
-
Cargill Inc.
-
Adisseo
-
Nutreco NV (SHV)
-
Evonik Industries AG
-
DSM-Firmenich AG
- *Disclaimer: Major Players sorted in no particular order
Need More Details on Market Players and Competitors?
Download PDF
Recent Industry Developments
- July 2025: DSM-Firmenich AG revealed a USD 120 million investment in precision nutrition technology across Southeast Asia. This includes the installation of NIR spectroscopy systems at 25 partner feed mills and the development of real-time formulation optimization platforms.
- April 2024: Cargill, Inc. invested USD 200 million in feed manufacturing capacity expansion across Vietnam and Indonesia, including precision nutrition equipment and automated quality control systems that enable real-time additive optimization.
- January 2024: Evonik Industries AG and Vland Biotech joint venture commenced operations with a USD 300 million investment in amino acid production capacity, combining German technology expertise with Chinese market access and cost competitiveness.
Asia-Pacific Feed Additives Market Report Scope
By Additive
| Acidifiers | By Sub Additive | Fumaric Acid |
| Lactic Acid | ||
| Propionic Acid | ||
| Other Acidifiers | ||
| Amino Acids | By Sub Additive | Lysine |
| Methionine | ||
| Threonine | ||
| Tryptophan | ||
| Other Amino Acids | ||
| Antibiotics | By Sub Additive | Bacitracin |
| Penicillins | ||
| Tetracyclines | ||
| Tylosin | ||
| Other Antibiotics | ||
| Antioxidants | By Sub Additive | Butylated Hydroxyanisole (BHA) |
| Butylated Hydroxytoluene (BHT) | ||
| Citric Acid | ||
| Ethoxyquin | ||
| Propyl Gallate | ||
| Tocopherols | ||
| Other Antioxidants | ||
| Binders | By Sub Additive | Natural Binders |
| Synthetic Binders | ||
| Enzymes | By Sub Additive | Carbohydrases |
| Phytases | ||
| Other Enzymes | ||
| Flavors and Sweeteners | By Sub Additive | Flavors |
| Sweeteners | ||
| Minerals | By Sub Additive | Macrominerals |
| Microminerals | ||
| Mycotoxin Detoxifiers | By Sub Additive | Binders |
| Biotransformers | ||
| Other Mycotoxin Detoxifiers | ||
| Phytogenics | By Sub Additive | Essential Oil |
| Herbs and Spices | ||
| Other Phytogenics | ||
| Pigments | By Sub Additive | Carotenoids |
| Curcumin and Spirulina | ||
| Prebiotics | By Sub Additive | Fructo Oligosaccharides |
| Galacto Oligosaccharides | ||
| Inulin | ||
| Lactulose | ||
| Mannan Oligosaccharides | ||
| Xylo Oligosaccharides | ||
| Other Prebiotics | ||
| Probiotics | By Sub Additive | Bifidobacteria |
| Enterococcus | ||
| Lactobacilli | ||
| Pediococcus | ||
| Streptococcus | ||
| Other Probiotics | ||
| Vitamins | By Sub Additive | Vitamin A |
| Vitamin B | ||
| Vitamin C | ||
| Vitamin E | ||
| Other Vitamins | ||
| Yeast | By Sub Additive | Live Yeast |
| Selenium Yeast | ||
| Spent Yeast | ||
| Torula Dried Yeast | ||
| Whey Yeast | ||
| Yeast Derivatives |
By Animal
| Aquaculture | By Sub Animal | Fish |
| Shrimp | ||
| Other Aquaculture Species | ||
| Poultry | By Sub Animal | Broiler |
| Layer | ||
| Other Poultry Birds | ||
| Ruminants | By Sub Animal | Beef Cattle |
| Dairy Cattle | ||
| Other Ruminants | ||
| Swine | ||
| Other Animals |
By Geography
| Australia |
| China |
| India |
| Indonesia |
| Japan |
| Philippines |
| South Korea |
| Thailand |
| Vietnam |
| Rest of Asia-Pacific |
| By Additive | Acidifiers | By Sub Additive | Fumaric Acid |
| Lactic Acid | |||
| Propionic Acid | |||
| Other Acidifiers | |||
| Amino Acids | By Sub Additive | Lysine | |
| Methionine | |||
| Threonine | |||
| Tryptophan | |||
| Other Amino Acids | |||
| Antibiotics | By Sub Additive | Bacitracin | |
| Penicillins | |||
| Tetracyclines | |||
| Tylosin | |||
| Other Antibiotics | |||
| Antioxidants | By Sub Additive | Butylated Hydroxyanisole (BHA) | |
| Butylated Hydroxytoluene (BHT) | |||
| Citric Acid | |||
| Ethoxyquin | |||
| Propyl Gallate | |||
| Tocopherols | |||
| Other Antioxidants | |||
| Binders | By Sub Additive | Natural Binders | |
| Synthetic Binders | |||
| Enzymes | By Sub Additive | Carbohydrases | |
| Phytases | |||
| Other Enzymes | |||
| Flavors and Sweeteners | By Sub Additive | Flavors | |
| Sweeteners | |||
| Minerals | By Sub Additive | Macrominerals | |
| Microminerals | |||
| Mycotoxin Detoxifiers | By Sub Additive | Binders | |
| Biotransformers | |||
| Other Mycotoxin Detoxifiers | |||
| Phytogenics | By Sub Additive | Essential Oil | |
| Herbs and Spices | |||
| Other Phytogenics | |||
| Pigments | By Sub Additive | Carotenoids | |
| Curcumin and Spirulina | |||
| Prebiotics | By Sub Additive | Fructo Oligosaccharides | |
| Galacto Oligosaccharides | |||
| Inulin | |||
| Lactulose | |||
| Mannan Oligosaccharides | |||
| Xylo Oligosaccharides | |||
| Other Prebiotics | |||
| Probiotics | By Sub Additive | Bifidobacteria | |
| Enterococcus | |||
| Lactobacilli | |||
| Pediococcus | |||
| Streptococcus | |||
| Other Probiotics | |||
| Vitamins | By Sub Additive | Vitamin A | |
| Vitamin B | |||
| Vitamin C | |||
| Vitamin E | |||
| Other Vitamins | |||
| Yeast | By Sub Additive | Live Yeast | |
| Selenium Yeast | |||
| Spent Yeast | |||
| Torula Dried Yeast | |||
| Whey Yeast | |||
| Yeast Derivatives | |||
| By Animal | Aquaculture | By Sub Animal | Fish |
| Shrimp | |||
| Other Aquaculture Species | |||
| Poultry | By Sub Animal | Broiler | |
| Layer | |||
| Other Poultry Birds | |||
| Ruminants | By Sub Animal | Beef Cattle | |
| Dairy Cattle | |||
| Other Ruminants | |||
| Swine | |||
| Other Animals | |||
| By Geography | Australia | ||
| China | |||
| India | |||
| Indonesia | |||
| Japan | |||
| Philippines | |||
| South Korea | |||
| Thailand | |||
| Vietnam | |||
| Rest of Asia-Pacific | |||
Need A Different Region or Segment?
Customize Now
Market Definition
- FUNCTIONS - For the study, feed additives are considered to be commercially manufactured products that are used to enhance characteristics such as weight gain, feed conversion ratio, and feed intake when fed in appropriate proportions.
- RESELLERS - Companies engaged in reselling feed additives without value addition have been excluded from the market scope, to avoid double counting.
- END CONSUMERS - Compound feed manufacturers are considered to be end-consumers in the market studied. The scope excludes farmers buying feed additives to be used directly as supplements or premixes.
- INTERNAL COMPANY CONSUMPTION - Companies engaged in the production of compound feed as well as the manufacturing of feed additives are part of the study. However, while estimating the market sizes, the internal consumption of feed additives by such companies has been excluded.
| Keyword | Definition |
|---|---|
| Feed additives | Feed additives are products used in animal nutrition for purposes of improving the quality of feed and the quality of food from animal origin, or to improve the animals’ performance and health. |
| Probiotics | Probiotics are microorganisms introduced into the body for their beneficial qualities. (It maintains or restores beneficial bacteria to the gut). |
| Antibiotics | Antibiotic is a drug that is specifically used to inhibit the growth of bacteria. |
| Prebiotics | A non-digestible food ingredient that promotes the growth of beneficial microorganisms in the intestines. |
| Antioxidants | Antioxidants are compounds that inhibit oxidation, a chemical reaction that produces free radicals. |
| Phytogenics | Phytogenics are a group of natural and non-antibiotic growth promoters derived from herbs, spices, essential oils, and oleoresins. |
| Vitamins | Vitamins are organic compounds, which are required for normal growth and maintenance of the body. |
| Metabolism | A chemical process that occurs within a living organism in order to maintain life. |
| Amino acids | Amino acids are the building blocks of proteins and play an important role in metabolic pathways. |
| Enzymes | Enzyme is a substance that acts as a catalyst to bring about a specific biochemical reaction. |
| Anti-microbial resistance | The ability of a microorganism to resist the effects of an antimicrobial agent. |
| Anti-microbial | Destroying or inhibiting the growth of microorganisms. |
| Osmotic balance | It is a process of maintaining salt and water balance across membranes within the body's fluids. |
| Bacteriocin | Bacteriocins are the toxins produced by bacteria to inhibit the growth of similar or closely related bacterial strains. |
| Biohydrogenation | It is a process that occurs in the rumen of an animal in which bacteria convert unsaturated fatty acids (USFA) to saturated fatty acids (SFA). |
| Oxidative rancidity | It is a reaction of fatty acids with oxygen, which generally causes unpleasant odors in animals. To prevent these, antioxidants were added. |
| Mycotoxicosis | Any condition or disease caused by fungal toxins, mainly due to contamination of animal feed with mycotoxins. |
| Mycotoxins | Mycotoxins are toxin compounds that are naturally produced by certain types of molds (fungi). |
| Feed Probiotics | Microbial feed supplements positively affect gastrointestinal microbial balance. |
| Probiotic yeast | Feed yeast (single-cell fungi) and other fungi used as probiotics. |
| Feed enzymes | They are used to supplement digestive enzymes in an animal’s stomach to break down food. Enzymes also ensure that meat and egg production is improved. |
| Mycotoxin detoxifiers | They are used to prevent fungal growth and to stop any harmful mold from being absorbed in the gut and blood. |
| Feed antibiotics | They are used both for the prevention and treatment of diseases but also for rapid growth and development. |
| Feed antioxidants | They are used to protect the deterioration of other feed nutrients in the feed such as fats, vitamins, pigments, and flavoring agents, thus providing nutrient security to the animals. |
| Feed phytogenics | Phytogenics are natural substances, added to livestock feed to promote growth, aid in digestion, and act as anti-microbial agents. |
| Feed vitamins | They are used to maintain the normal physiological function and normal growth and development of animals. |
| Feed flavors and sweetners | These flavors and sweeteners help to mask tastes and odors during changes in additives or medications and make them ideal for animal diets undergoing transition. |
| Feed acidifiers | Animal feed acidifiers are organic acids incorporated into the feed for nutritional or preservative purposes. Acidifiers enhance congestion and microbiological balance in the alimentary and digestive tracts of livestock. |
| Feed minerals | Feed minerals play an important role in the regular dietary requirements of animal feed. |
| Feed binders | Feed binders are the binding agents used in the manufacture of safe animal feed products. It enhances the taste of food and prolongs the storage period of the feed. |
| Key Terms | Abbreviation |
| LSDV | Lumpy Skin Disease Virus |
| ASF | African Swine Fever |
| GPA | Growth Promoter Antibiotics |
| NSP | Non-Starch Polysaccharides |
| PUFA | Polyunsaturated Fatty Acid |
| Afs | Aflatoxins |
| AGP | Antibiotic Growth Promoters |
| FAO | The Food And Agriculture Organization of the United Nations |
| USDA | The United States Department of Agriculture |
Need More Details on Market Definition?
Ask a Question
Research Methodology
Mordor Intelligence follows a four-step methodology in all our reports.
- Step-1: IDENTIFY KEY VARIABLES: In order to build a robust forecasting methodology, the variables and factors identified in Step-1 are tested against available historical market numbers. Through an iterative process, the variables required for market forecast are set and the model is built on the basis of these variables.
- Step-2: Build a Market Model: Market-size estimations for the forecast years are in nominal terms. Inflation is not a part of the pricing, and the average selling price (ASP) is kept constant throughout the forecast period.
- Step-3: Validate and Finalize: In this important step, all market numbers, variables and analyst calls are validated through an extensive network of primary research experts from the market studied. The respondents are selected across levels and functions to generate a holistic picture of the market studied.
- Step-4: Research Outputs: Syndicated Reports, Custom Consulting Assignments, Databases & Subscription Platforms

Get More Details On Research Methodology
Download PDF


