
Market Overview
| Study Period | 2020 - 2031 |
|---|---|
| Forecast Data Period | 2026 - 2031 |
| Base Year Market Size (2025) | USD 5.11 Billion |
| Market Size (2026) | USD 5.79 Billion |
| Market Size (2031) | USD 10.89 Billion |
| Growth Rate (2026 - 2031) | 13.44 % |
| Market Concentration | Medium |
Major Players *Disclaimer: Major Players sorted in no particular order Image © Mordor Intelligence. Reuse requires attribution under CC BY 4.0. | |
Asia Pacific Fantasy Sports Market Analysis by Mordor Intelligence
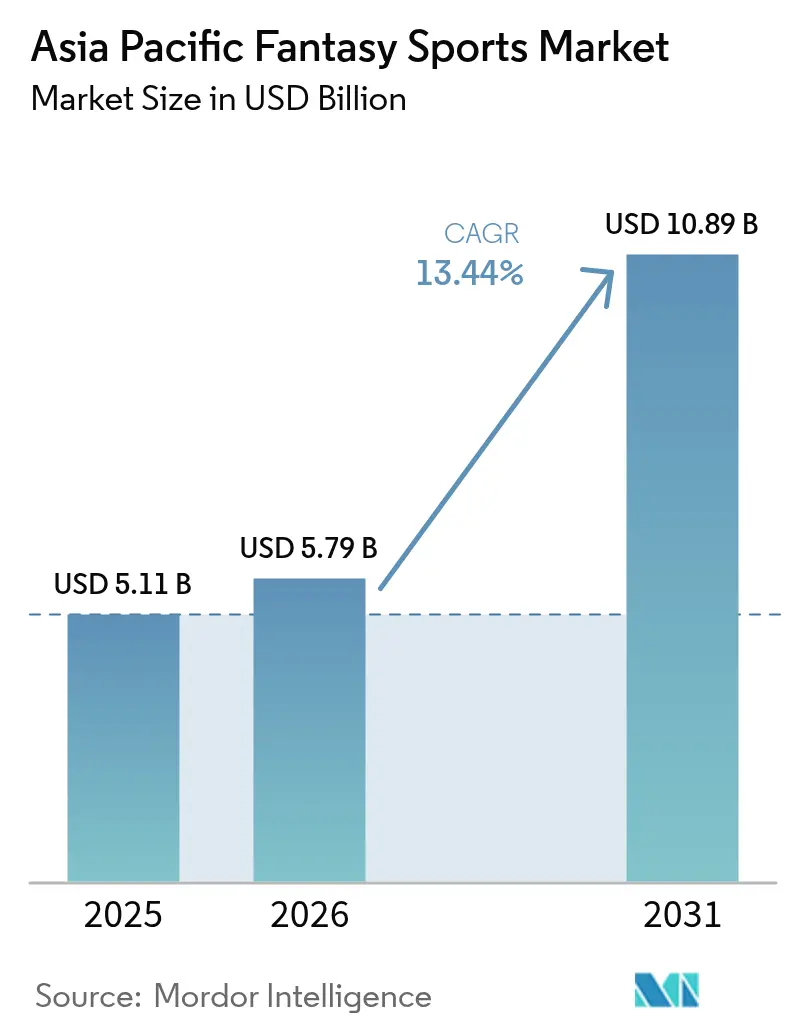
The Asia-Pacific fantasy sports market size is expected to grow from USD 5.11 billion in 2025 to USD 5.79 billion in 2026 and is forecast to reach USD 10.89 billion by 2031 at 13.44% CAGR over 2026-2031. The combination of affordable 5G data plans, sub-USD 100 smartphones, and near-instant digital payments has lowered participation barriers across both metropolitan and semi-urban pockets. Legal frameworks that classify fantasy contests as skill-based entertainment rather than gambling are encouraging institutional investment and guiding platforms toward sustainable compliance models.[1] Leading operators are broadening their ecosystems beyond seasonal cricket cycles by adding streaming services, travel experiences, and proprietary wallets, which spreads revenue risk and deepens user stickiness. Women-centric leagues are accelerating user diversification, while blockchain-enabled reward mechanics are opening fresh monetization lanes and strengthening the long-run outlook for the Asia-Pacific fantasy sports market through 2030.
Key Report Takeaways
- By geography, India held 57.62% of the Asia-Pacific fantasy sports market share in 2025, while Indonesia is forecast to post a 15.97% CAGR to 2031.
- By sporting type, cricket captured 61.45% of 2025 revenue; women’s cricket is projected to expand at a 15.55% CAGR through 2031.
- By platform, mobile applications accounted for 77.92% of engagement in 2025, whereas smart TV usage is set to rise at a 14.86% CAGR to 2031.
- By age group, users aged 25-40 years controlled 53.74% of activity in 2025, while the under-25 cohort is poised to grow at a 14.63% CAGR through 2031.
- By revenue model, paid-entry contests delivered 70.68% of receipts in 2025, and blockchain-token rewards are expected to advance at a 15.8% CAGR to 2031.
Note: Market size and forecast figures in this report are generated using Mordor Intelligence’s proprietary estimation framework, updated with the latest available data and insights as of 2026.
Asia Pacific Fantasy Sports Market Trends and Insights
Drivers Impact Analysis*
| Driver | (~) % Impact on CAGR Forecast | Geographic Relevance | Impact Timeline |
|---|---|---|---|
| Widespread smartphone penetration and affordable data | +3.20% | India, Southeast Asia, China | Medium term (2-4 years) |
| Rising engagement around marquee regional leagues | +2.80% | India, Australia, Japan, South Korea | Short term (≤ 2 years) |
| Legal recognition of fantasy sports as "games of skill" | +2.10% | India, Australia, Philippines | Long term (≥ 4 years) |
| Growth of real-time digital payments (UPI and wallets) | +2.50% | India, Southeast Asia | Short term (≤ 2 years) |
| Women-centric leagues expanding user demography | +1.80% | India, Australia, New Zealand | Medium term (2-4 years) |
| Blockchain-based token rewards and transparency | +1.40% | Global APAC, early adoption in Singapore, Hong Kong | Long term (≥ 4 years) |
| Source: Mordor Intelligence | |||
Widespread Smartphone Penetration and Affordable Data
The Asia-Pacific fantasy sports market benefits from a mobile-first environment where Indonesia alone generated 41% of Southeast Asia’s 4.2 billion mobile-game downloads in 2024.[2] Entry-level 5G handsets priced below USD 100 have made real-time statistics and live match streaming accessible to a wider audience. Local-language interfaces and simplified roster-building tools are driving sign-ups in Tier 2 and Tier 3 Indian cities, segments that posted 35% year-on-year growth for non-cricket titles. Digital wallets such as JazzCash in Pakistan and Maya in the Philippines facilitate micro-transactions in seconds, removing friction from contest entry fees. Social-sharing elements embedded within apps amplify peer-to-peer challenges, keeping customer-acquisition costs in check and reinforcing the flywheel for the Asia-Pacific fantasy sports market.
Rising Engagement Around Marquee Regional Leagues
Flagship tournaments create condensed windows of elevated traffic that translate into spike-driven revenues. The 2025 Indian Premier League drove transaction volumes that stressed banking rails, prompting additional investment in capacity upgrades for instant payments. The inaugural Women’s Premier League attracted more than 50 million views during its first week and helped increase female participation on fantasy platforms by 80% year over year. In parallel, esports events such as the Mobile Legends: Bang Bang M4 Championship reached 4.2 million peak concurrent viewers, setting the stage for cross-pollination between mobile gaming and fantasy prediction formats. The Asia-Pacific fantasy sports market leverages these high-profile events to convert casual viewers into year-round users through loyalty programs and offseason content.
Legal Recognition of Fantasy Sports as “Games of Skill"
Supreme Court rulings in India, along with clear licensing pathways in Australia and the Philippines, frame fantasy contests as skill-based activities, distancing them from gambling prohibitions. This legal clarity lowers investor risk perception and has unlocked large funding rounds, including Dream Sports’ USD 942 million raise that valued the company at USD 8 billion. The regulatory certainty in these jurisdictions encourages platform experimentation with new sports and monetization models, expanding the Asia-Pacific fantasy sports market addressable base even as policy reviews continue elsewhere.
Growth of Real-Time Digital Payments (UPI and Wallets)
India’s Unified Payments Interface processes 185 billion annual transactions, worth around USD 3 trillion, and settles them instantly, enabling last-minute contest entries and rapid prize disbursement. Southeast Asian e-wallets such as GrabPay and GoPay offer similarly seamless experiences, making micro-wagers practical across the region. Peak demand during headline matches has exposed infrastructure stress points, prompting banks to adopt real-time monitoring and auto-scaling servers. Embedded payment rails inside social messengers, notably WeChat Pay in Hong Kong, allow users to enter fantasy contests via QR codes within chat threads, reinforcing network effects for the Asia-Pacific fantasy sports market.
Restraints Impact Analysis*
| Restraint | (~) % Impact on CAGR Forecast | Geographic Relevance | Impact Timeline |
|---|---|---|---|
| Fragmented laws and higher taxation across countries | -2.80% | India, Australia, Philippines, South Korea | Medium term (2-4 years) |
| Addiction concerns and social pushback | -1.90% | India, Australia, wider APAC | Long term (≥4 years) |
| Policy volatility and blanket bans on real-money contests | -2.30% | India, China, South Korea | Short term (≤2 years) |
| Infrastructure outages during peak sporting events | -1.50% | India, Indonesia, Southeast Asia | Short term (≤2 years) |
| Source: Mordor Intelligence | |||
Fragmented Laws and Higher Taxation Across Countries
A patchwork of national rules forces operators to juggle multiple licenses and taxation levels. India’s 28% Goods and Services Tax on deposits erodes platform margins, while Google Play service fees add further cost pressure. Australia bans the use of credit cards and crypto payments for licensed online wagering, limiting flexibility and raising compliance overhead. South Korea continues to prohibit most forms of online gambling, restricting fantasy operators to offshore structures that carry reputational and operational risks. The resulting complexity slows regional rollouts and tempers the growth trajectory of the Asia-Pacific fantasy sports market.
Addiction Concerns Driving Social and Regulatory Pushback
Heightened awareness of problem gaming is shaping stricter advertising codes. India’s Online Gaming Bill 2025 temporarily halted many real-money contests, forcing platforms to adopt free-to-play formats and reduce monetization opportunities. Australia is debating a phased ban on online wagering ads, and existing rules already mandate responsible-gaming disclaimers that diminish marketing impact. Industry associations now require age-verification, spending caps, and self-exclusion portals, adding friction to onboarding flows. These measures, while essential for consumer protection, may constrain the pace at which the Asia-Pacific fantasy sports market scales.
*Our forecasts treat driver/restraint impacts as directional, not additive. The impact forecasts reflect baseline growth, mix effects, and variable interactions.
Segment Analysis
By Sporting Type: Cricket’s Dominance Faces Diversification Pressure
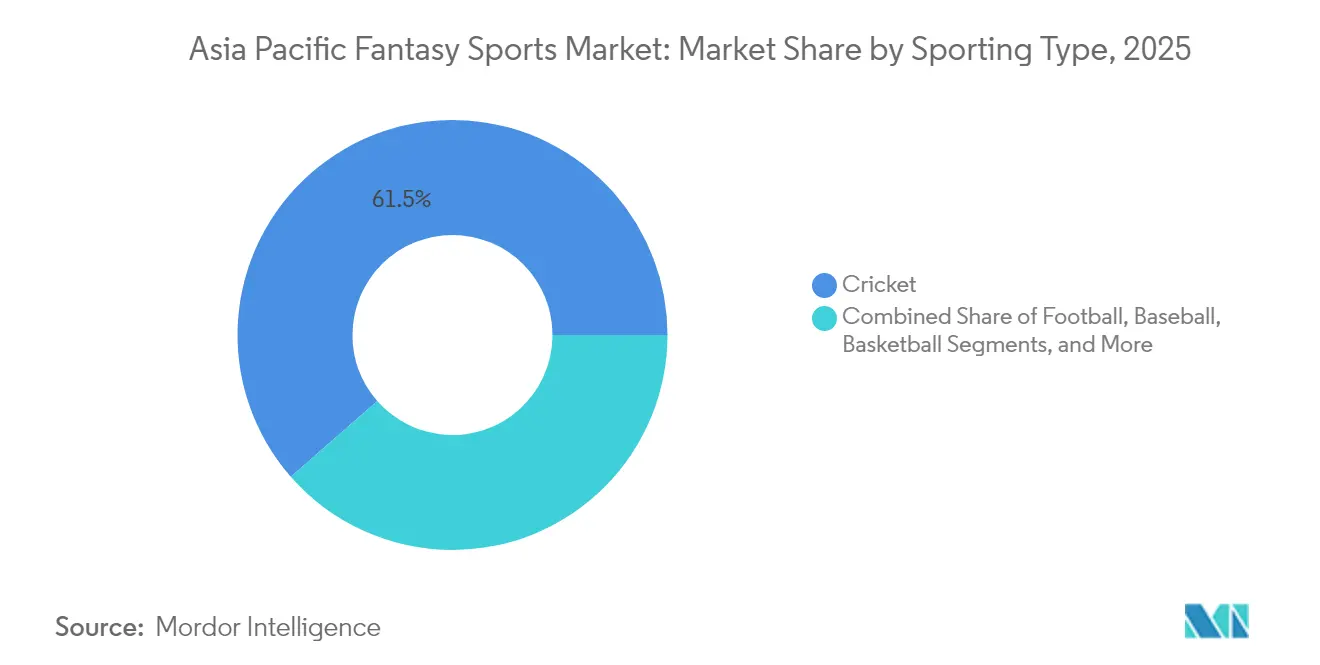
Cricket maintained 61.45% of revenue in 2025, demonstrating its entrenched cultural footprint across South Asia and diaspora communities. The Asia-Pacific fantasy sports market size for cricket is projected to widen further during marquee tournaments, yet dependence on a single sport amplifies seasonal volatility. Platforms are therefore elevating women’s cricket, which is forecast to grow at a 15.55% CAGR, spurred by the Women’s Premier League and rising female participation. Football rides Southeast Asia’s fervor for mobile esports, and basketball gains from NBA tie-ups that localize fantasy formats. Emerging categories such as kabaddi, hockey, and structured esports leagues diversify engagement calendars, cushioning revenue swings and broadening appeal among younger demographics.
Sustained investment in data analytics is reshaping how fans interact with non-cricket sports. Real-time injury feeds, player-form indices, and weather-adjusted projections enhance decision-making accuracy and foster confidence among first-time users. Blockchain-enabled collectibles in women’s cricket are creating fresh revenue streams through limited-edition tokens, demonstrating that technology can accelerate segmental growth. As more leagues adopt fantasy-friendly data standards, the Asia-Pacific fantasy sports market reflects a gradual yet steady tilt toward a balanced sports mix.

By Platform: Mobile Applications Dominate Smart TV Acceleration
Mobile apps accounted for 77.92% of engagement in 2025, underscoring the region’s smartphone-centric media consumption. Push notifications, one-tap payments, and in-app strategy guides reinforce retention during live matches. The Asia-Pacific fantasy sports market size attributable to smart TVs is comparatively small today but is advancing at a 14.86% CAGR as streaming services embed fantasy overlays in broadcast feeds. Those overlays let viewers draft lineups without leaving the couch, closing the conversion loop and lengthening watch times.
Desktop portals continue to serve power users who perform deeper statistical research, while experimental interfaces on smart speakers and wearables hint at future use cases. Integration of voice commands for roster swaps and smartwatch alerts for lineup deadlines signal a trajectory toward ubiquitous access. Overall, platform diversification ensures that the Asia-Pacific fantasy sports market remains resilient to shifts in device preferences and network conditions.
By Age Group: Prime Demographics Drive Growth
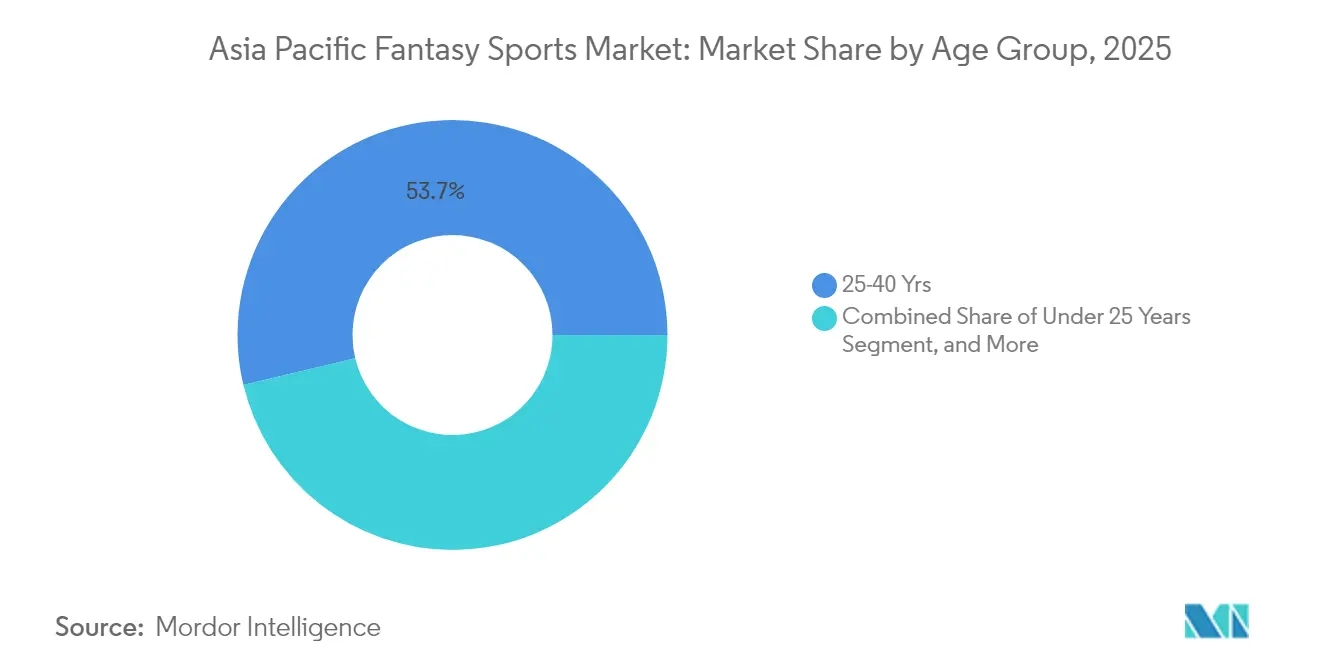
Users aged 25-40 years commanded 53.74% of 2025 participation, reflecting their disposable income and affinity for competitive digital experiences. The under-25 cohort is expected to rise at a 14.63% CAGR, propelled by mobile-first behaviour and openness to blockchain rewards. This segment shows heightened interest in esports hybrids and social leaderboards, nudging platforms to adopt gamified progression mechanics. The above-40 group values simplified interfaces and traditional sports knowledge, contributing steady ticket sizes even if growth lags younger brackets.
Demographic insights are guiding feature roadmaps. College-themed tournaments and low-stake micro-contests appeal to Gen Z, while curated expert picks and lower volatility pools attract seasoned players. Progressive jackpot formats and thematic season-passes help operators balance both acquisition and monetization, reinforcing lifetime value across age bands within the Asia-Pacific fantasy sports market.
By Revenue Model: Paid Contests Face Token Innovation
Paid-entry contests produced 70.68% of receipts in 2025, underscoring a mature appetite for cash-based competition. Nonetheless, tokenized reward models are advancing at a 15.8% CAGR, capitalizing on the region’s broader embrace of Web3 gaming. Tokens offer fractional ownership in prize pools, cross-title asset portability, and governance rights overrule changes, elevating user engagement.
Freemium tiers serve as on-ramps, allowing experimentation with lineup mechanics before committing funds. Subscription packages bundle ad-free experiences, advanced analytics, and priority withdrawals, catering to high-frequency users. Merchandise and in-app purchases add incremental revenue by enabling avatar customization and team-branded collectibles. Together, these models diversify cash flows and strengthen the economic foundation of the Asia-Pacific fantasy sports market.
Geography Analysis
India remains the cornerstone of the Asia-Pacific fantasy sports market, holding 57.62% share in 2025 due to cricket’s cultural ubiquity and the ubiquity of UPI for instant payments. Dream Sports anchors its ecosystem with fantasy contests, content streaming, and fintech products, serving more than 230 million registered users and generating over USD 150 million in combined revenue. Policy risk persists after the 2025 Online Gaming Bill paused many real-money formats, but Supreme Court precedent continues to recognize the skill-based nature of fantasy contests. If regulatory clarity stabilizes, India’s user base could surpass 500 million by 2027.
China’s stringent gambling regulations limit fantasy operations to state-sanctioned frameworks, yet the country’s USD 39 billion gaming market hints at latent potential. Should policy evolve toward skill-based exemptions, international operators could tap considerable demand. Japan offers a blend of high-spending gamers and a thriving esports scene worth JPY 14.685 billion. Local partnerships and culturally tailored content are critical entry levers. Australia’s state-by-state licensing system provides legal certainty but imposes strict marketing and responsible-gaming obligations, pushing operators to refine retention tactics and limit promotional spend. Indonesia is the fastest-growing territory, tracking a 15.97% CAGR through 2031. The nation hosts 174.1 million gamers and enjoys one of the world’s highest mobile-gaming penetrations, positioning it as a prime frontier for the Asia-Pacific fantasy sports market. Elsewhere in Southeast Asia, Malaysia, the Philippines, and Thailand combine high smartphone adoption with digital wallet ubiquity, creating favourable conditions for regional expansion. South Korea’s restrictive stance hinders direct operations, but interest in fantasy esports remains alive among gamers who leverage offshore platforms, signalling the possibility of future liberalization
Regulatory Landscape
Asia-Pacific regulation for fantasy sports remains fragmented, with more emphasis on centralized oversight, consumer protection, and clearer classification of money-stake play versus skill-based entertainment. India is the most material recent inflection for the region: the Ministry of Electronics and Information Technology notified the Promotion and Regulation of Online Gaming Rules, 2026 via Gazette notification (G.S.R. 303(E)) dated April 22, 2026, with the framework taking effect from May 1, 2026. The rules introduce a federal-level compliance and enforcement structure through the Online Gaming Authority of India (OGAI). India also continues to apply higher fiscal burdens on online gaming, and taxation treatment has become an operating constraint for platforms that previously relied heavily on paid-entry contests.
Across Southeast Asia, market entry often hinges on local-entity and licensing pathways. Vietnam Government Decree 147/2024/ND-CP reinforces requirements for foreign enterprises involved in publishing games in Vietnam to operate through local structures, with foreign ownership caps aligned to WTO commitments. Singapore operates under the Gambling Control Act 2022, administered by the Gambling Regulatory Authority (GRA), consolidating remote gambling regulation and shaping how operators position fantasy, prediction, and other interactive formats to remain compliant in a tightly supervised environment.
Competitive Landscape
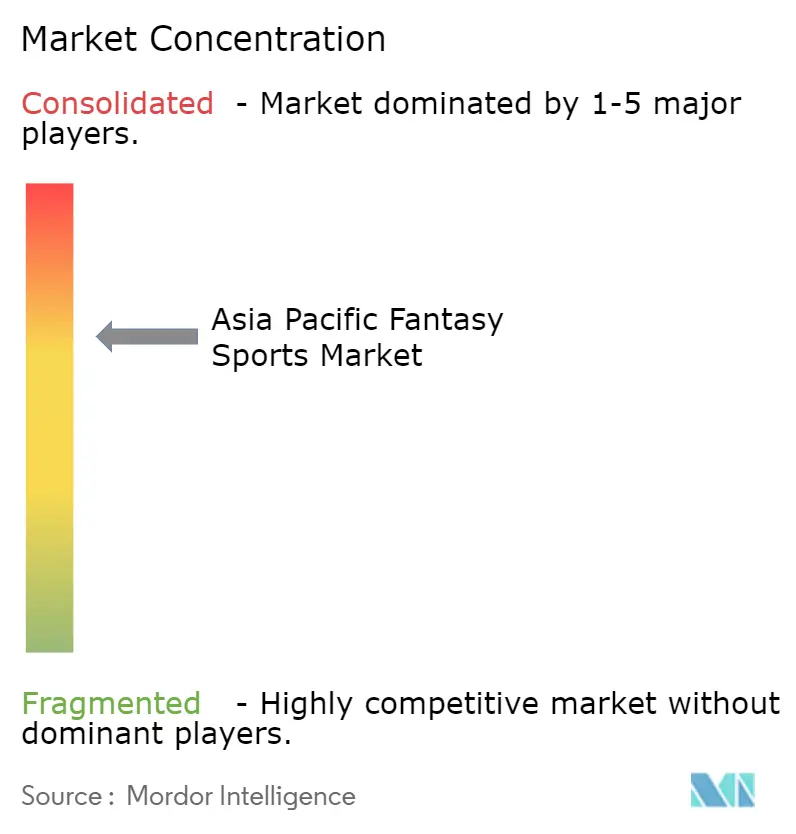
The Asia-Pacific fantasy sports market is moderately concentrated. Dream Sports leverages cross-vertical integration covering contests, streaming, travel experiences, and digital wallets to secure user lifetime value and buffer regulatory shocks. Its strategy foregrounds localized content, rapid prize settlement, and partnership with sports leagues for official data feeds. Mobile Premier League, Nazara-backed Halaplay, and Southeast Asia’s Garena employ mobile-first designs and aggressive marketing to capture first-time players, often targeting regional tournaments outside mainstream cricket calendars.
Blockchain-native entrants such as Fanton introduce decentralized governance and automated liquidity pools, attracting Web3 enthusiasts seeking transparent reward structures. Esports-focused operators bridge competitive gaming with fantasy roster mechanics, drawing younger demographics. Payment processors, telcos, and streaming giants are forging co-marketing deals that bundle subscription perks with fantasy credits, lowering acquisition costs and diversifying revenue paths.
Mergers and acquisitions revolve around technology capabilities scalable infrastructure, real-time analytics, and regional payment integrations. Investment in artificial-intelligence-driven personalization remains a shared priority, enabling tailored contest suggestions that increase play frequency. Overall, rivalry pushes incumbents to differentiate via ecosystem depth, sport diversity, and compliance rigor, shaping sustainable growth for the Asia-Pacific fantasy sports market.[4]
Asia Pacific Fantasy Sports Industry Leaders
-
Dream Sports
-
PlayUP Ltd
-
RealGM LLC
-
HalaPlay Technologies Pvt. Ltd
-
ESPN Inc.
- *Disclaimer: Major Players sorted in no particular order
Market Opportunities and Future Outlook
The biggest near-term whitespace is product redesign and monetization diversification in response to tightening rules around money-stake play. India now has a federal online gaming framework that prohibits online money games while providing pathways for social games and e-sports without staking money. That creates room for platforms to repackage engagement into free-to-play contests, subscriptions, ad-supported formats, and loyalty programs that do not hinge on entry-fee pools. The shift also increases the need for compliance-tech, classification workflows, and payments controls that support regulator-facing requirements, particularly as oversight is centralized under OGAI from May 2026.
Outside India, cross-market expansion opportunities are more tied to localization, payments, and distribution than to contest inventory alone. Southeast Asian wallet ecosystems, including GrabPay and GoPay highlighted in the report context, support micro-transactions and rapid settlement mechanics that fit low-denomination freemium and subscription bundles. Smart TV and streaming-overlay integrations also offer an additional on-screen conversion surface beyond mobile. Operator moves toward broader ecosystems, such as Dream Sports investing USD 50 million in Cricbuzz and Willow TV in April 2025 to deepen streaming, fit this direction by packaging fantasy mechanics with content, data, and community features to reduce seasonality and reliance on paid-entry contests.
Recent Industry Developments
- July 2026: Dream Sports announced the shutdown of its fintech venture Dream Money, effective July 30, 2026, less than a year after its launch. The change narrows the group focus to fewer, higher-priority consumer propositions as the operating environment for money-linked gaming and adjacent financial products becomes more compliance intensive.
- May 2026: Dream Sports announced the launch of DreamStreet, an AI-enabled stock broking platform, expanding further into financial services beyond fantasy sports. The move highlights how leading regional operators are using large user ecosystems and digital onboarding capabilities to develop new revenue streams alongside their core gaming brands.
- July 2024: Nazara Technologies reported that its subsidiaries Openplay Technologies and Halaplay Technologies received show cause notices from the Director General of GST Intelligence, Kolkata, for proposed tax liabilities covering 2017-18 to 2022-23. The action pointed to rising tax and compliance scrutiny around real-money gaming-linked entities, shaping risk management, corporate structuring, and product-mix decisions across the fantasy sports ecosystem.
Research Methodology Framework and Report Scope
Market Definition and Coverage
For this study, the market covers the revenue generated from fantasy sports contests in Asia-Pacific where users create virtual teams of real players and outcomes are decided through points from real match performance.
Scope exclusions: We exclude offline-only games, pure sports news or streaming services, and general sports betting that is not structured as fantasy contests.
Segmentation Overview
- By Sporting Type
- Cricket
- Football
- Basketball
- Baseball
- Other Sporting Types
- By Platform
- Mobile Application
- Website / Desktop
- Smart TV
- Others Platforms
- By Age Group
- Under 25 Years
- 25 - 40 Years
- Above 40 Years
- By Revenue Model
- Paid-Entry Contests
- Freemium / Ad-Supported
- Subscription
- In-App Purchases and Merchandise
- By Country
- India
- China
- Japan
- Australia
- South Korea
- South-East Asia
- Rest of Asia Pacific
Data Sources, Market Sizing, and Validation
Desk Research
Desk research was used to set the boundaries of what is counted as fantasy sports revenue in the region and to understand how usage is evolving across key sports and countries. We mainly relied on public, reputable sources such as telecom and internet adoption statistics (for example from the ITU and national telecom regulators), macro and population data from the World Bank, and country level digital economy indicators published by national statistics offices.
We also reviewed supporting material such as company annual reports, investor presentations, app store updates, and trusted press coverage to map platform monetization routes and policy signals. Where available, paid subscription sources focused on company financials and on patents were used to cross-check business scale and product direction, but the market model did not depend on any single private dataset. These examples are not exhaustive, and other sources were referenced for data collection, validation, and clarification during the research process.
Primary Interviews and Surveys
Primary work was used to validate what users actually pay for and how platform revenue is split across entry fees, commissions, advertising, and sponsorships. We spoke with operators, marketing and partnerships teams, payments and compliance stakeholders, and sports ecosystem participants across APAC, so assumptions for take rates, active user mix, and seasonality could be corrected when desk indicators were not specific enough.
Distribution of primary research fieldwork respondents
| Company type | Respondent position |
|---|---|
| Top tier: 29% | CXOs: 12% |
| Mid tier: 52% | Functional/Unit leaders: 42% |
| Smaller Players: 19% | Managers: 46% |
Market-Sizing & Forecasting
The core model is built top-down by reconstructing the demand pool for fantasy contests using country level internet and smartphone adoption, sports fan engagement signals, and an estimated share of users who participate in fantasy formats. From there, expected paying-user penetration and average revenue per paying user are applied to reach a value estimate, which is then allocated across key APAC markets and major sports based on relative adoption patterns.
To keep the totals grounded, we corroborate the output with selective bottom-up checks such as sampled pricing and contest structures, app store monetization cues, and channel checks with industry participants on typical take rates and promo intensity. Key inputs that are tracked and updated include active user mix by country, cricket and football season calendars that shape activity spikes, promotional spending intensity, entry fee and commission ranges, and local tax or policy changes that can shift net revenue.
For forecasting, scenario analysis is used because adoption and regulation can change sharply in digital sports products, and the scenarios are anchored by expert expectations on user growth and monetization stability. Where direct revenue disclosure is limited, gaps are handled by using ranges for ARPU and take rates, followed by sensitivity checks until the implied values align with practical platform economics discussed in interviews.
Data Validation & Update Cycle
Outputs are checked through multiple passes so the final values stay consistent with independent signals such as user growth trends, engagement seasonality, and publicly visible monetization changes. We review outliers at country level, revisit the assumptions that created the variance, and re-contact sources when a key input like tax treatment, contest mechanics, or monetization mix appears to have shifted.
The report is refreshed annually, and interim updates are triggered when a material event occurs, such as a major regulatory change or a step change in platform monetization behavior. Before delivery, an analyst performs a fresh validation pass so the numbers reflect the latest available information and currency conditions.
Mordor Intelligence's Asia Pacific Fantasy Sports Market Sizing Compared With Other Published Estimates
Published market sizes for fantasy sports in Asia-Pacific can look far apart because firms do not always count the same revenue streams and they also choose different timing for currency conversion and seasonality. Even small differences in what is treated as platform revenue, and when it is recognized, can move the final number by a visible margin.
A common gap comes from how ARPU is set and refreshed, since contest entry fee patterns and promotional intensity shift quickly during major tournaments, and a single static assumption can overstate a full-year run rate. Another driver is whether ad and sponsorship revenue is included across the entire ecosystem or only tied to fantasy platforms, followed by differences in how exchange rates are timed in the model, which are choices handled through the quarterly refresh checks used by Mordor Intelligence.
Benchmark comparison
| Source | Market Size | Gaps in Research Methodology |
|---|---|---|
| Mordor Intelligence | USD 5.11 B (2025) | |
| Regional Consultancy A | USD 4.60 B (2025) | Uses a narrower revenue boundary that leans on entry-fee based gaming revenue and excludes most sponsorship and advertising tied to fantasy ecosystems, and it applies conservative paying-user penetration in smaller APAC markets. |
| Trade Journal B | USD 6.30 B (2025) | Builds a higher ARPU by extrapolating peak-tournament monetization across the year and applies a single exchange rate point for the region, which can inflate reported USD values when local currencies move. |
The spread in the table mainly reflects how fast monetization assumptions are updated and whether adjacent revenue streams are counted alongside contest play. By keeping ARPU linked to seasonality and validating country level totals against practical platform economics, the market value stays traceable to clear inputs and repeatable steps.
Key Questions Answered in the Report
How large is the Asia-Pacific fantasy sports market in 2026?
It is valued at USD 5.79 billion and is on track to reach USD 10.89 billion by 2031.
What is the forecast CAGR for fantasy sports platforms in Asia-Pacific?
The market is expected to grow at a 13.44% CAGR over the 2026-2031 period.
Which sport generates the most fantasy revenue in the region?
Cricket leads with 61.45% of 2025 revenue, well ahead of other sports.
Which country offers the highest near-term growth opportunity?
Indonesia is forecast to post a 15.97% CAGR through 2031, the fastest among major markets.
How are blockchain tokens changing monetization?
Tokenized rewards are projected to expand at a 15.8% CAGR, offering users fractional ownership in prize pools and cross-title asset portability.
What age segment is growing the fastest?
Users under 25 years old are expected to expand at a 14.63% CAGR through 2031, driven by mobile-native habits and interest in Web3 features.