
Market Overview
| Study Period | 2020 - 2031 |
|---|---|
| Forecast Data Period | 2026 - 2031 |
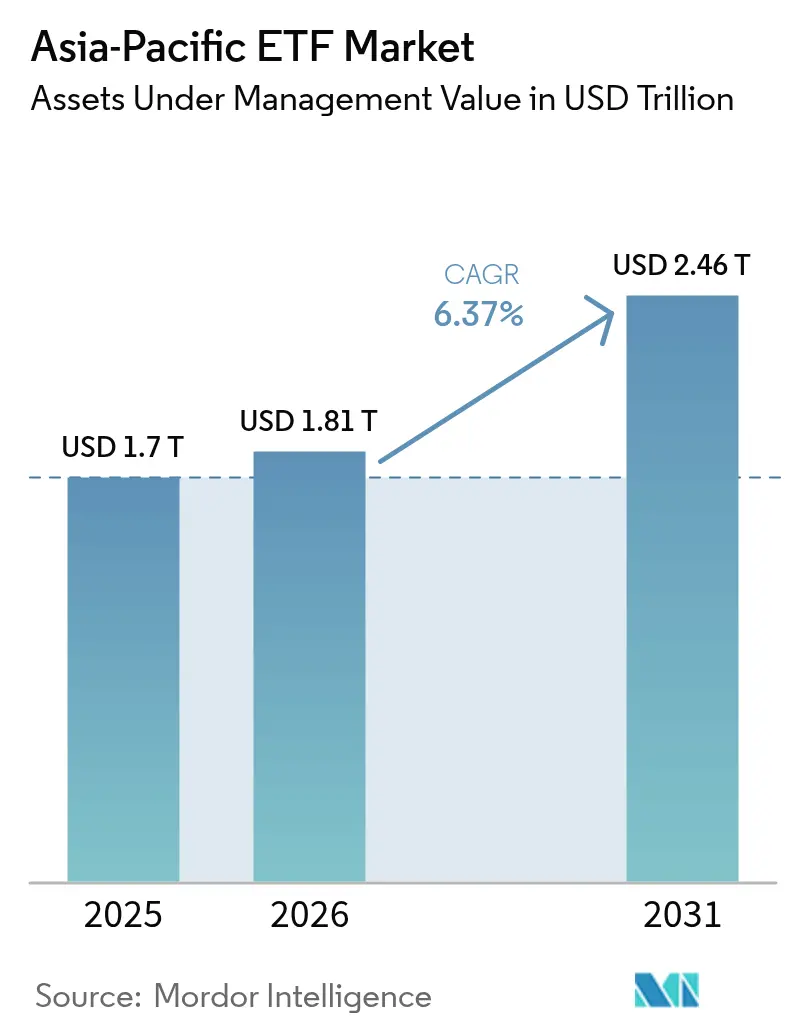
| Base Year Market Size (2025) | USD 1.70 Trillion |
| Market Size (2026) | USD 1.81 Trillion |
| Market Size (2031) | USD 2.46 Trillion |
| Growth Rate (2026 - 2031) | 6.37 % |
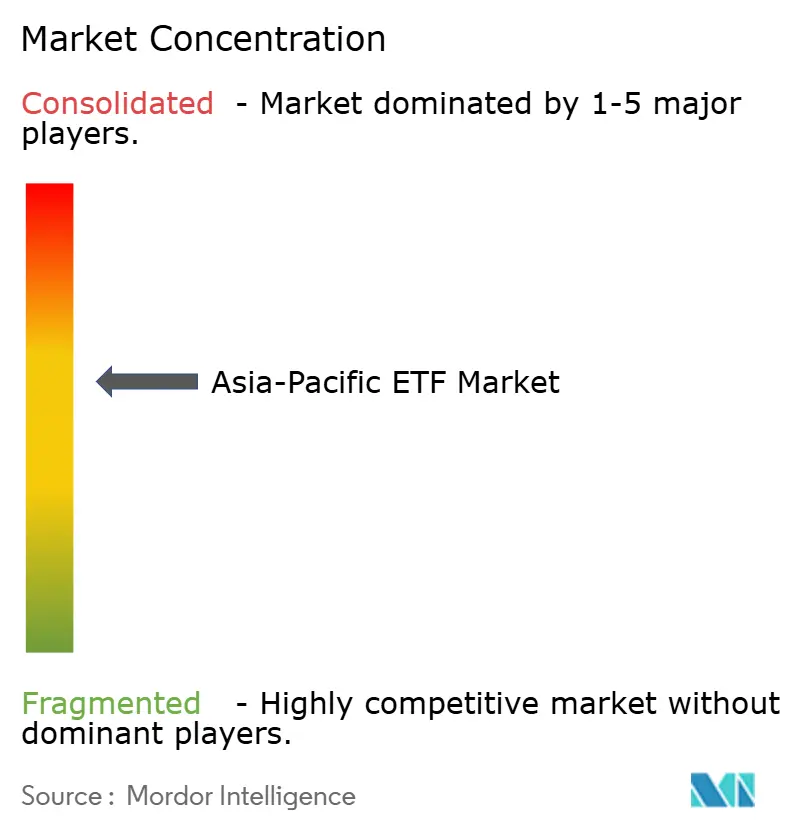
| Market Concentration | Medium |
Major Players *Disclaimer: Major Players sorted in no particular order Image © Mordor Intelligence. Reuse requires attribution under CC BY 4.0. | |
Asia-Pacific ETF Market Analysis by Mordor Intelligence
The Asia-Pacific ETF market size is expected to grow from USD 1.70 trillion in 2025 to USD 1.81 trillion in 2026 and is forecast to reach USD 2.46 trillion by 2031 at 6.37% CAGR over 2026-2031. Strong retail inflows via mobile trading apps, growing acceptance of fixed-income ETFs for balance-sheet liquidity, and tax-advantaged savings reforms are steering this expansion. Japan remains the largest single market, yet surging volumes in China, India, and South Korea signal a wider regional rebalancing. Issuers are racing to launch active, thematic, and ESG funds to capture millennial demand, while digital platforms are compressing fees and accelerating distribution. Cross-border schemes such as ETF Connect are breaking down legacy barriers and setting the stage for a more integrated Asia-Pacific ETF market.
Key Report Takeaways
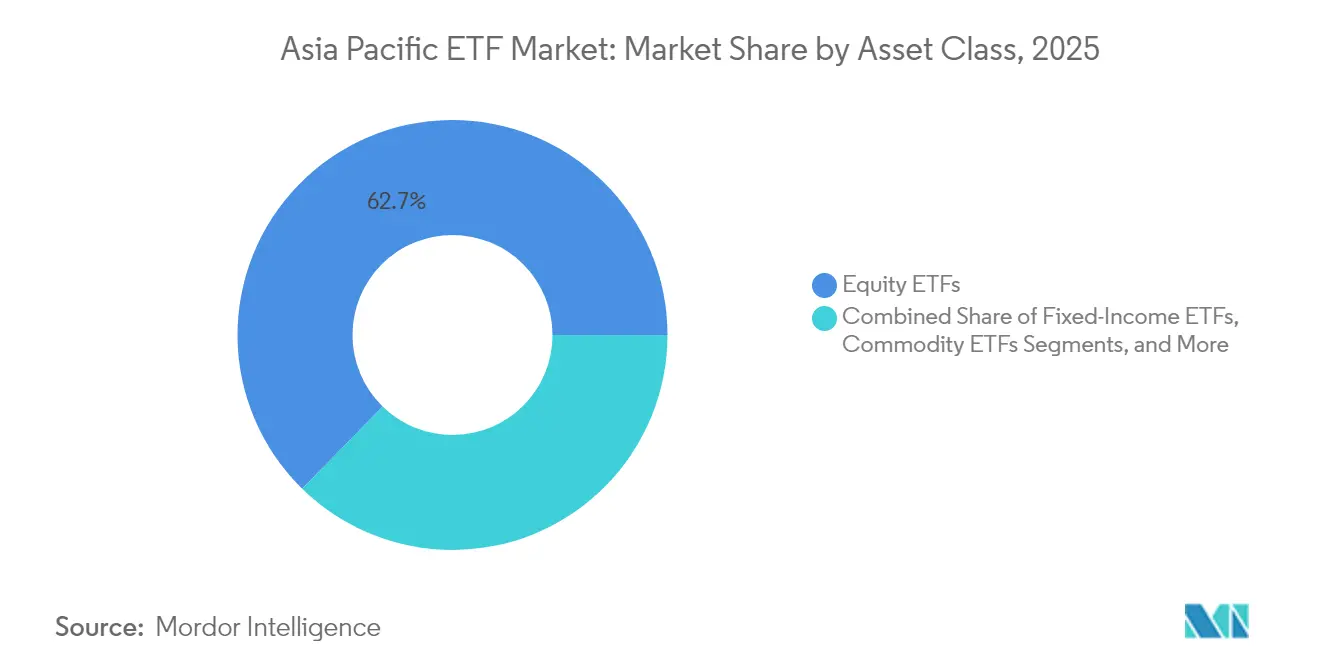
- By asset class, equity ETFs led with 62.68% of Asia-Pacific ETF market share in 2025; alternative ETFs are projected to grow at a 9.34% CAGR to 2031.
- By investment strategy, passive vehicles held 81.12% of the Asia-Pacific ETF market share in 2025, whereas active ETFs are forecasted to expand at a 12.03% CAGR through 2031.
- By investor type, retail investors accounted for 61.72% of the Asia-Pacific ETF market size in 2025 and are expected to grow at an 8.41% CAGR.
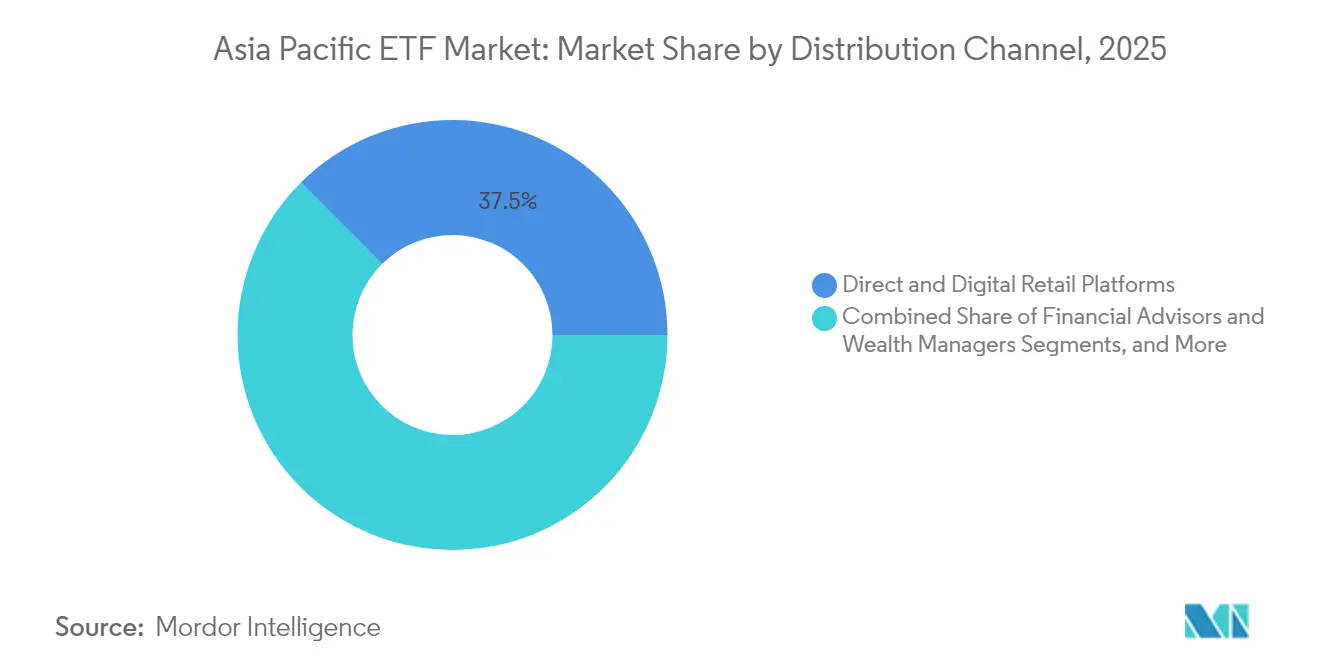
- By distribution channel, direct digital platforms captured 37.45% of the Asia-Pacific ETF market in 2025 and are projected to advance at a 9.88% CAGR.
- By country, Japan retained 31.58% Asia-Pacific ETF market share in 2025, while India is the fastest-growing market at 10.92% CAGR.
Note: Market size and forecast figures in this report are generated using Mordor Intelligence’s proprietary estimation framework, updated with the latest available data and insights as of 2026.
Market Trends and Insights
Drivers Impact Analysis of Asia-Pacific ETF Market*
| Driver | (~) % Impact on CAGR Forecast | Geographic Relevance | Impact Timeline |
|---|---|---|---|
| Retail participation surge via digital platforms | +1.8% | China, Taiwan, South Korea | Medium term (2-4 years) |
| Government-led tax incentives | +1.2% | Japan, South Korea, Singapore | Medium term (2-4 years) |
| Institutional use of fixed-income ETFs | +0.9% | Japan, Australia, Singapore, Hong Kong | Short term (≤2 years) |
| Cross-border fund passport schemes | +0.7% | Hong Kong–China, ASEAN ARFP | Long term (≥4 years) |
| Millennial demand for thematic & ESG ETFs | +1.1% | Australia, Japan, Singapore | Medium term (2-4 years) |
| Expansion of active ETF structures | +1.3% | Australia, South Korea, Taiwan | Medium term (2-4 years) |
| Source: Mordor Intelligence | |||
Retail Participation Surge Fueled by Digital Investment Platforms
Retail investors now hold 61.4% of regional ETF assets, a sharp shift from the institutional skew in North America. Mobile-first brokerage apps have removed minimum ticket sizes and simplified KYC, drawing new savers into the Asia-Pacific ETF market. Taiwan’s retail cohort is especially deep, while mainland China has recorded a rapid climb in individual activity. Issuers are redesigning education content and launching fixed-income and thematic funds once aimed at pensions. Surveys indicate that 96% of surveyed investors intend to lift ETF allocations within 12 months, with millennials leading the appetite for cryptocurrency tails[1]Brown Brothers Harriman, “2025 Global ETF Investor Survey,” bbh.com.
Government-Led Tax Incentive Programs Boosting ETF Savings Vehicles
Japan’s 2024 NISA overhaul deleted expiry windows and doubled annual limits to ¥3.6 million (USD 24,000), injecting more than ¥15 trillion (USD 100 billion) into investment accounts during FY 2024. Similar revisions to South Korea’s ISA and Singapore’s SRS are channeling household cash into low-cost ETFs. Regulators see these accounts as tools to convert dormant savings into productive capital, underpinning long-run growth for the Asia-Pacific ETF market.
Growing Appetite for Thematic & ESG Strategies Among Millennials
Millennial investors favor targeted themes such as AI, automation, and clean energy, propelling ESG inflows of ¥1.2 trillion (USD 8 billion) in Japan alone during 2024. Australia shows similar momentum, and 80% of surveyed Asian investors expect to boost cryptocurrency ETF allocations[2]Brown Brothers Harriman, “2025 Global ETF Investor Survey,” bbh.com. Issuers are accordingly racing to seed niche thematic funds.
Expansion of Active ETF Structures Under Relaxed Regulations
South Korea hosts the region’s highest active ETF penetration, while Taiwan listed its first active fund in May 2025, following rule changes that encourage multi-asset strategies[3]Taiwan Stock Exchange, “Active ETF Listing Notice,” twse.com.tw. Australia projects active products will exceed 50% of new ETF launches in 2025. Active wrappers blend stock-picking with ETF tax and trading efficiencies, diversifying the Asia-Pacific ETF market.
Restraints Impact Analysis of Asia-Pacific ETF Market*
| Restraint | (~) % Impact on CAGR Forecast | Geographic Relevance | Impact Timeline |
|---|---|---|---|
| Fragmented regulatory regimes | -0.7% | Pan-APAC, cross-border issuers | Long term (≥4 years) |
| Limited on-exchange liquidity in emerging ASEAN | -0.5% | Thailand, Indonesia, Malaysia, Philippines | Medium term (2-4 years) |
| Misconceptions about ETF risk among retail investors | -0.3% | China, India, Indonesia | Short term (≤2 years) |
| Concentration risk from Japan-focused equity funds | -0.4% | Japan, regional allocations | Medium term (2-4 years) |
| Source: Mordor Intelligence | |||
Fragmented Regulatory Regimes Creating High Listing & Compliance Costs
Varied disclosure and operational rules add 15-20% to issuer expense, deterring smaller entrants and curbing innovation. Although ARFP aims to harmonize, member states still impose country-specific filings, unlike Europe’s UCITS template.
Limited On-Exchange Liquidity in Emerging ASEAN Markets
Low trading volumes widen bid-ask spreads and elevate tracking error in Indonesia, Thailand, and Malaysia[4]FTSE Russell, “ASEAN ETF Liquidity Snapshot,” lseg.com. Fixed-income ETFs suffer most where bond price transparency is thin, keeping institutional desks on the sidelines.
*Our forecasts treat driver/restraint impacts as directional, not additive. The impact forecasts reflect baseline growth, mix effects, and variable interactions.
Asia-Pacific ETF Market Segment Analysis
By Asset Class:
Equity ETFs Dominate While Alternatives SurgeEquity funds commanded 62.68% Asia-Pacific ETF market share in 2025, anchored by Japan-listed Nikkei and TOPIX trackers. Core equity remains a first-stop allocation for both retail and pensions, sustaining turnover and liquidity. Yet alternatives—spanning commodities, private-credit replicas, and digital-asset baskets—are progressing at a 9.34% CAGR, outstripping the wider Asia-Pacific ETF market. Fixed-income ETFs, bolstered by Taiwanese demand, supply cheap duration exposure and intraday price transparency. Commodity products are gaining appeal as inflation hedges, especially in resource-importing economies, while currency-hedged ETFs stay niche tools for sophisticated accounts.
The Asia-Pacific ETF market size tied to alternatives is projected to grow significantly by 2031, expanding product diversity well beyond vanilla beta. Equity dominance will ease incrementally as new wrappers democratize once-esoteric strategies. Investors deploying balanced portfolios increasingly blend equity core positions with commodity and real-asset ETFs for shock absorption.


By Investment Strategy:
Passive Dominance Challenged by Active InnovationPassive vehicles retained an 81.12% share of the Asia-Pacific ETF market in 2025, the legacy of early broad-index launches. However, active ETFs are compounding at 12.03%, more than double the Asia-Pacific ETF market CAGR. South Korea hosts index-beating quant funds wrapped in ETF form, while Australia expects active products to form half of new listings in 2025. Taiwan’s May 2025 debut marks regulatory acceptance of the structure, and Japanese advisers increasingly model portfolios around risk-smart active ETFs.
Across fixed income, managers tout security selection and duration tilts as alpha drivers unattainable in strict index replication. A Brown Brothers Harriman poll shows 33% of investors plan to shift allocations from passive to active ETFs in 2025. The Asia-Pacific ETF market size attributed to active strategies is expected to grow significantly by 2031, carving out a sustainable premium‐fee niche.
By Investor Type:
Retail Investors Drive Growth Through Digital AdoptionRetail accounts controlled 61.72% of the share of the Asia-Pacific ETF market in 2025 and are expected to climb at an 8.41% CAGR, outpacing institutional growth. Low entry barriers, cashback promotions, and gamified interfaces encourage first-time savers to choose ETFs as their default wrapper. Mainland Chinese fintech platforms process millions of micro-orders daily, funneling liquidity into flagship CSI-linked funds. Institutional desks remain vital for block liquidity and model portfolio design, yet their proportional share is shrinking as retail expands the Asia-Pacific ETF market.
High-frequency user feedback is also shaping product design. Investors crowd-sourced suggestions for new green-hydrogen ETFs in South Korea, while Indian platforms run real-time education modules to deepen understanding of tracking error. The Asia-Pacific ETF market share claimed by retail investors could edge past 64.85% by 2031 if current digital trends persist.
By Distribution Channel:
Digital Platforms Reshape Access ParadigmsDirect digital routes held 37.45% of the share of the Asia-Pacific ETF market in 2025 and are projected to grow at a 9.88% CAGR, displacing legacy bank branches and full-service brokers. Chinese super-apps anchor multi-asset dashboards, while South Korea’s mobile banking ecosystem executes ETF trades in seconds. Advisory and wealth channels remain essential for high-net-worth clients and structured mandates but are pivoting to low-touch, model-based delivery. Traditional banks in Hong Kong and Singapore are retrofitting interfaces to retain relevance.
The Asia-Pacific ETF market size routed via digital platforms is expected to grow significantly, placing technology vendors and API aggregators at the heart of distribution. For issuers, omnichannel presence that blends robo + human touchpoints is swiftly becoming the norm.
By Country:
Japan Leads While India AcceleratesJapan’s 31.58% Asia-Pacific ETF market share in 2025 rests on deep liquidity, BOJ support, and NISA-driven retail inflows. India’s 10.92% CAGR is the region’s fastest, reflecting demographic dividends and structural reforms.
Australia’s ETF stack is anticipated to grow significantly as investors diversify globally, while South Korea leads active-ETF penetration. Taiwan holds significant assets, with bond ETFs dominating the market. ASEAN early-stage markets present optionality, though liquidity hurdles linger. Overall, divergent country growth patterns compel issuers to tailor listings, education, and marketing.
Geography Analysis
APAC ETF Market
Japan and China together hold more than half of the regional assets. Japan, supported by NISA reforms and governance-focused stock-exchange policies, logged robust net inflows in 2024. China recorded heightened retail turnover and operationalized ETF Connect, granting offshore users simplified access and letting mainland investors tap Hong Kong listings. India’s double-digit expansion underscores macro tailwinds as the economy climbs the global rankings.
East Asia and Oceania ETF Market
South Korea blends high retail trading activity with the region’s densest line-up of active ETFs. Average daily turnover positions Seoul among the most liquid ETF marketplaces. Australia shows a sustained appetite for offshore equity and ESG themes, propelling its Asia-Pacific ETF market share. Taiwan’s bond-heavy profile mirrors local yield hunting, yet the May 2025 active-ETF debut signals a gradual pivot toward diversified offerings.
ASEAN ETF Market
Emerging ASEAN venues illustrate contrasting maturity. Singapore’s wealth-hub status and regulatory clarity attract cross-border listings, especially in sustainability-linked funds. Indonesia, Thailand, and Malaysia are improving disclosure norms but still grapple with thin secondary-market liquidity, dampening institutional participation. Vietnam’s young investor base and increasing smartphone penetration hint at latent upside once trading infrastructure scales. Collectively, intra-Asian passport schemes aim to knit these markets into a larger, more fluid Asia-Pacific ETF market.
Regulatory Landscape
Asia-Pacific ETF regulation continues to vary by market, but policy moves from 2025 to 2026 point toward broader product eligibility and tighter market-quality expectations. In Australia, ASIC published Regulatory Guide RG 282 in November 2025, formalizing admission, monitoring, and compliance expectations for exchange-traded products and strengthening the operating framework for issuers and market operators. Hong Kong’s Securities and Futures Commission (SFC) implemented new ongoing public-float requirements for listed issuers effective 1 January 2026 and later updated its circular on listed structured funds to include single stock leveraged and inverse products effective 5 June 2026, indicating a more permissive stance on product breadth alongside clearer guardrails.
Several jurisdictions are also expanding what can sit inside an ETF wrapper. In South Korea, the Financial Services Commission (FSC) proposed amendments in January 2026 to the FSCMA Enforcement Decree, with a 40-day public comment window ending 11 March 2026. The proposals target rule changes that support additional ETF structures, including active and single-stock concepts. In Malaysia, the Securities Commission Malaysia updated its Guidelines on Exchange-Traded Funds in March 2026 (SC-GL/ETF-2005 (R6-2026)), explicitly permitting digital currency ETFs, which adds another regulated pathway for crypto-linked exposure within the region.
Value Chain Analysis
The Asia-Pacific ETF value chain starts with index and data inputs (benchmark administrators and market data), followed by product structuring by ETF sponsors or issuers and portfolio implementation by appointed managers. It then shifts to primary-market liquidity (authorized participants and creation or redemption logistics), secondary-market liquidity (market makers and exchange trading), and post-trade services including custody, fund accounting, transfer agency, and reporting. Regulatory and exchange rulebooks shape each step, with frameworks such as ASIC’s RG 282 (November 2025) influencing issuer obligations, disclosure, and ongoing monitoring in Australia, while other markets use exchange and regulator guidance to set operational requirements for listings and product features.
Cross-border access and liquidity provision are becoming key nodes. ETF Connect has expanded the eligible universe on the northbound leg, and China’s regulator and market stakeholders have explored measures to deepen liquidity, including CSRC considerations reported in April 2025 about allowing Western market makers such as Citadel Securities, Jane Street, and Optiver to provide liquidity in the domestic ETF market. Operationally, the chain remains sensitive to settlement, collateral, and workflow automation. This is pushing issuers and service providers to modernize OMS/PMS integration and creation-redemption processing, particularly for active and cross-border ETFs where basket complexity and intraday risk management demands are higher.
Competitive Landscape
Large global issuers—BlackRock’s iShares, State Street’s SPDR, and Vanguard—anchor multi-country line-ups and leverage scale for cost leadership. They replicate US or European flagships in local wrappers while customizing indexes for domestic benchmarks. Regional champions such as Nikko Asset Management, Samsung Asset Management, and Mirae Asset Global Investments exploit local brand equity and adviser networks to defend home-turf share and are extending reach into neighboring jurisdictions.
Chinese managers—ChinaAMC, E Fund, Harvest—benefit from policy support and fast-growing A-share liquidity, creating a formidable mainland roster. Product innovation defines the current battleground: 2025 saw launches of AI chipsets, semiconductor supply chains, and electric-vehicle battery ETFs. Active structures are another differentiator; South Korean providers license quant engines, while Australian boutiques seed concentrated high-conviction funds.
Distribution technology is a second competitive lever. Providers partner with robo-advisers and super-apps for one-click purchases, using data analytics to fine-tune education and retention campaigns. Cross-listing strategies, enabled by ETF Connect and ARFP, also boost float and visibility. In early-stage territories such as India, first-mover advantage remains up for grabs, suggesting white-space for both global and home-grown issuers to cement footprints.
Asia-Pacific ETF Industry Leaders
BlackRock iShares
State Street Global Advisors
Nikko Asset Management
Samsung Asset Management
Mirae Asset Global Investments
- *Disclaimer: Major Players sorted in no particular order
Asia-Pacific ETF Market Companies Covered in this Report
- BlackRock iShares
- State Street Global Advisors
- Nikko Asset Management
- Samsung Asset Management
- Mirae Asset Global Investments
- Nomura Asset Management
- Daiwa Asset Management
- China Asset Management (ChinaAMC)
- E Fund Management
- Harvest Fund Management
- CSOP Asset Management
- Fortune SG Fund Management
- HuaTai-PineBridge
- Cathay SITE
- Yuanta SITE
- BetaShares Capital
- VanEck
- Global X
- First Trust
- Ping An Fund Management

Market Opportunities and Future Outlook
Opportunity areas in Asia-Pacific ETFs increasingly cluster around (1) broadened product permissions and (2) improved listing and distribution infrastructure. Malaysia’s March 2026 guideline update that permits digital currency ETFs creates a regulated route for crypto-linked ETF offerings in an ASEAN market, while South Korea’s January 2026 proposed FSCMA Enforcement Decree amendments target a wider set of ETF structures that can expand the investable shelf for local and regional issuers. In Hong Kong, the SFC’s June 2026 update to include single stock leveraged and inverse products in its listed structured funds framework provides a concrete pathway for more granular equity exposure tools, alongside ongoing development of cross-border ETF access.
There is also visible whitespace in newer or less-liquid exchanges where policy changes are meant to attract issuers and improve market depth. The Philippine Stock Exchange’s June 2026 proposal to cut the ETF issuer capitalization requirement (from PHP 250 million to PHP 50 million, with a further reduction option for established firms) targets barriers to entry and can broaden the issuer set and product diversity. On the product side, exchange- and issuer-led launches around technology themes and cross-border equity access offer replication templates: HKEX facilitated the first ETF tracking the HKEX Tech 100 Index in June 2026 (managed by E Fund Management (Hong Kong)), and China Asset Management listed the Huaxia CSI Hong Kong Stock Connect Information Technology ETF on the Shanghai Stock Exchange in April 2026, reinforcing continued demand for differentiated tech exposure tied to Stock Connect-linked wrappers.
Recent Industry Developments in Asia-Pacific ETF Market
- March 2026: Amova Asset Management launched the Listed Index Fund Nikkei Bank Stock Top 10, listed on the Tokyo Stock Exchange on 18 March 2026. The launch adds another targeted Japan equity factor/sector-style exposure in an ETF wrapper, supporting broader product breadth beyond core beta. It also reinforces Tokyo as an active listing venue for new thematic and segment-specific ETFs.
- October 2025: BlackRock debuted its first iShares ETF on the Taiwan Stock Exchange, marking an expansion of its ETF footprint into Taiwan. This increases competitive intensity for local incumbents and can accelerate fee and product innovation as global issuers build local lineups. The move also broadens the menu of internationally branded ETFs available to Taiwan’s retail-led ETF base.
- June 2024: Nikko Asset Management received Tokyo Stock Exchange approval for the listing of the Listed Index Fund Nikkei Semiconductor Stock, which listed on 12 July 2024. The product added a listed vehicle aligned to a high-demand technology supply-chain theme, supporting thematic ETF adoption in Japan. It also highlighted the exchange’s role in enabling sector-specific exposures that can be packaged for both domestic and regional investors.


Asia-Pacific ETF Market Report Scope and Research Methodology
Market Definition and Coverage
We size the Asia-Pacific ETF market as the total assets under management (AUM) held in exchange-traded funds that are listed in Asia-Pacific markets and are investable through local exchange trading and fund structures.
Scope exclusions: We exclude exchange-traded notes (ETNs), leveraged certificates, and closed-end investment trusts from the market total.
Segments Covered in This Report
- By Asset Class
- Equity ETFs
- Fixed-Income ETFs
- Commodity ETFs
- Currency ETFs
- Real-Estate ETFs
- Alternative ETFs
- By Investment Strategy
- Active
- Passive
- By Investor Type
- Retail
- Institutional
- By Distribution Channel
- Direct and Digital Retail Platforms
- Financial Advisors and Wealth Managers
- Institutional Channels
- Traditional Banks and Full-Service Brokers
- By Country
- China
- India
- Japan
- South Korea
- Australia
- Indonesia
- Thailand
- Singapore
- Vietnam
- Malaysia
- Philippines
- Rest of Asia-Pacific
Data Sources, Market Sizing, and Validation
Desk Research
Desk research was used to set the market boundary, confirm country coverage, and build a clean historical view of ETF AUM patterns in the region. We relied on official and public sources such as exchange statistics from leading Asia-Pacific stock exchanges, central bank and regulator publications, and fund industry releases from associations such as EFAMA and ICI (used mainly for definitional consistency and global cross-checks).
To avoid overcounting, we also used issuer annual reports, product factsheets, and audited financial statements where available, then complemented those checks with business press coverage for large launches, closures, and rule changes. A limited set of paid subscriptions was used for company financials and news screening, and patent databases were used only for background checks on index and product innovation themes when relevant. The sources listed here are illustrative and not exhaustive, and many other public documents and filings were reviewed for data collection, validation, and clarification.
Primary Interviews and Surveys
Primary work focused on checking how AUM is being reported in each market, and on verifying the impact of listing rules, feeder structures, and cross-border access on what should be counted. We spoke with a mix of ETF issuers, exchange representatives, authorized participants, and buy-side users across major Asia-Pacific hubs, and then used those inputs to pressure-test growth assumptions and country-level splits.
Distribution of primary research fieldwork respondents
| Company type | Respondent position |
|---|---|
| Top tier: 27% | CXOs: 15% |
| Mid tier: 53% | Functional/Unit leaders: 29% |
| Smaller Players: 20% | Managers: 56% |
Market-Sizing & Forecasting
The core sizing logic uses top-down and bottom-up methods, where reported ETF AUM series by country and exchange are reconstructed, aligned to a common definition, and then summed to an Asia-Pacific total for the base year. Where a country had partial disclosure or breaks in time series, the missing points were filled using adjacent period growth, issuer-level disclosures, and exchange-level totals, and then checked again during interviews.
To keep the model grounded, the total was corroborated using selective bottom-up approximations such as sampled issuer roll-ups by major markets and product families, and AUM change was reconciled through net flows and market-move effects when those indicators were available. Key inputs tracked in the model include ETF AUM level and growth by country, net inflows or outflows trends, number of listed ETFs and product launches, equity versus fixed income mix shifts, and policy signals that affect cross-border availability (for example, access programs and listing rule updates).
Forecasts were built with scenario analysis anchored on expected investor adoption and product pipeline, then adjusted with country-level growth paths suggested by primary respondents. When forecasts produced an outlier jump versus known launch calendars or exchange aggregates, the growth path was toned down and re-checked against the assumptions driving the variance.
Data Validation & Update Cycle
Validation was done through step-by-step checks that compare the model output with independent signals, including exchange-published ETF aggregates, large market AUM disclosures, and country-level fund statistics where they exist. We also run variance checks across years so sudden changes are explained by a real event such as rule changes, major listing additions, or broad market moves, before numbers are finalized.
A second analyst review is completed before sign-off, and expert re-contacts are triggered when a key country assumption shifts or when a large market prints an unexpected AUM change. Reports are refreshed annually, with interim updates for material events, and a final pre-delivery review is completed so clients receive the latest updated view.
Mordor Intelligence's Asia Pacific Etf Market Size Compared Against Other Published Estimates
Published market sizes for Asia-Pacific ETFs can look far apart because the underlying definition is not always the same, and the AUM cut-off date can move totals quickly in a rising or falling market. Differences also come from whether the estimate is built as a clean regional sum of local markets, or as an investor-access view that blends cross-listed exposure.
A practical driver in this market is what gets counted as an ETF in each jurisdiction, since some sources roll in adjacent exchange-traded products or include offshore-domiciled funds that are distributed locally. Another driver is whether AUM is captured at the listing venue, at the domicile, or after netting out cross-listed duplication, which can shift totals when large products are traded across borders.
Benchmark comparison
| Source | Market Size | Gaps in Research Methodology |
|---|---|---|
| Mordor Intelligence | USD 1.70 T (2025) | |
| Industry Association A | USD 1.51 T (2025) | Uses a narrower ETF definition and may exclude smaller local exchanges and selected emerging Asia markets, which reduces the summed AUM total. |
| Trade Journal B | USD 1.92 T (2025) | Blends ETFs with adjacent exchange-traded products and applies mixed timing for AUM snapshots across markets, which can lift totals in volatile periods. |
The spread is mainly explained by ETF versus adjacent product inclusion and by the exact AUM snapshot timing. These inputs were held consistent using country-and-exchange totals, with re-checks on outliers through primary calls, before sign-off by Mordor Intelligence.


Key Questions Answered in the Report
What is the current size of the Asia-Pacific ETF market?
The Asia-Pacific ETF market is valued at USD 1.81 trillion in 2026 and is projected to reach USD 2.46 trillion by 2031.
Which country holds the largest share of Asia-Pacific ETF assets?
Japan leads with 31.58% Asia-Pacific ETF market share in 2025, though China is expected to overtake in the near future.
How fast are active ETFs growing in the region?
Active ETFs are expanding at a 12.03% CAGR, almost twice the overall Asia-Pacific ETF market growth rate.
Why are digital platforms important for ETF distribution?
Digital channels captured 37.45% of assets in 2025, growing at 9.88% CAGR, thanks to low fees, seamless onboarding, and broad mobile adoption.
What role do tax-advantaged accounts play in ETF adoption?
Programs such as Japan’s NISA and Singapore’s SRS direct household savings into low-cost ETFs, providing a structural tailwind for long-term growth.
Which asset class inside ETFs is attracting the fastest inflows?
Alternative ETFs, covering commodities and digital assets, are the fastest-growing segment, advancing at a 9.34% CAGR.
Page last updated on:


 Your data is secure and never sold or shared.


