
Market Overview
| Study Period | 2021 - 2031 |
|---|---|
| Forecast Data Period | 2026 - 2031 |
| Base Year Market Size (2025) | USD 2.46 Billion |
| Market Size (2026) | USD 2.65 Billion |
| Market Size (2031) | USD 3.94 Billion |
| Growth Rate (2026 - 2031) | 8.26 % |
| Market Concentration | Medium |
Major Players *Disclaimer: Major Players sorted in no particular order Image © Mordor Intelligence. Reuse requires attribution under CC BY 4.0. | |
Asia-Pacific Essential Oils Market Analysis by Mordor Intelligence
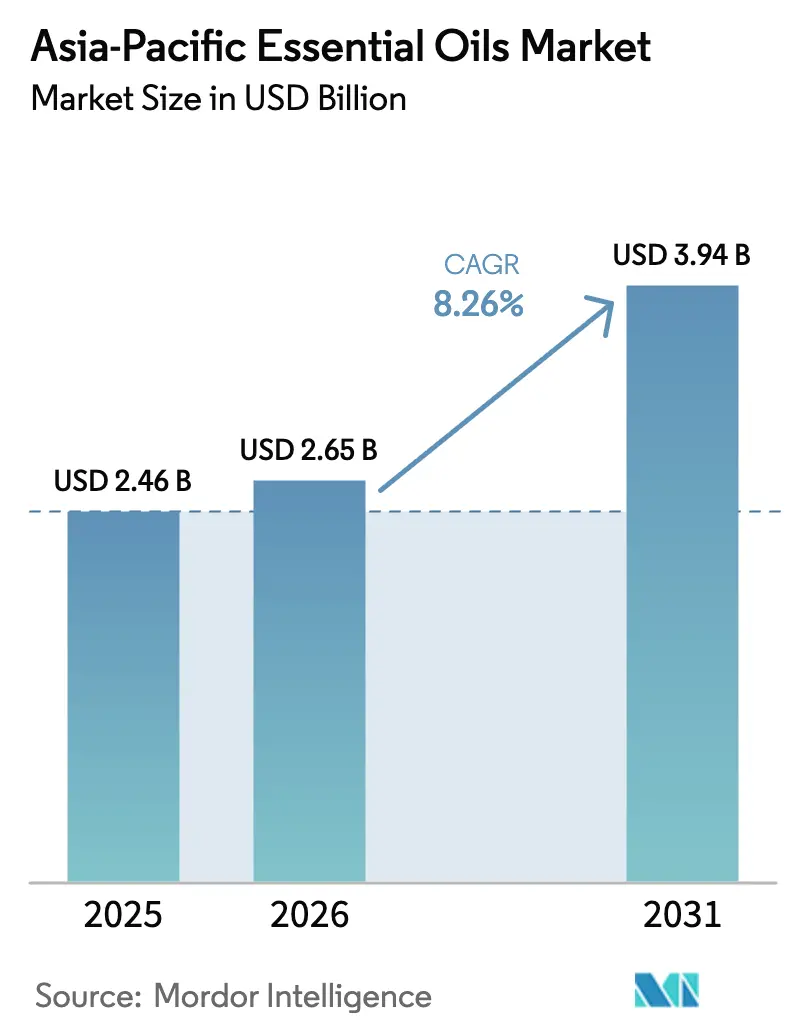
The Asia-Pacific Essential Oils Market size is expected to increase from USD 2.46 billion in 2025 to USD 2.65 billion in 2026 and reach USD 3.94 billion by 2031, growing at a compound annual growth rate (CAGR) of 8.26% over 2026-2031. This growth is influenced by multiple factors, including the implementation of stricter regulations on synthetic additives, a rise in consumer awareness regarding ingredient transparency, and the increasing institutional adoption of aromatherapy practices and clean-label products. China continues to dominate the market in terms of scale, driven by its production of citrus-peel and menthol-based essential oils. Meanwhile, Japan is emerging as the fastest-growing market in the region, primarily due to its rapidly aging population. Regulatory reforms, such as restrictions on the use of microplastics and requirements for fragrance disclosure, are further accelerating the transition toward plant-based inputs. Companies that operate with vertically integrated models, managing processes from farming and distillation to formulation, are achieving significant profit margins. Additionally, advancements in extraction technologies, including cold-press methods and supercritical carbon dioxide (CO₂) extraction, are reducing residue risks, enhancing the positioning of premium products, and encouraging the adoption of botanical solutions across various industries, including food, cosmetics, and household products.
Key Report Takeaways
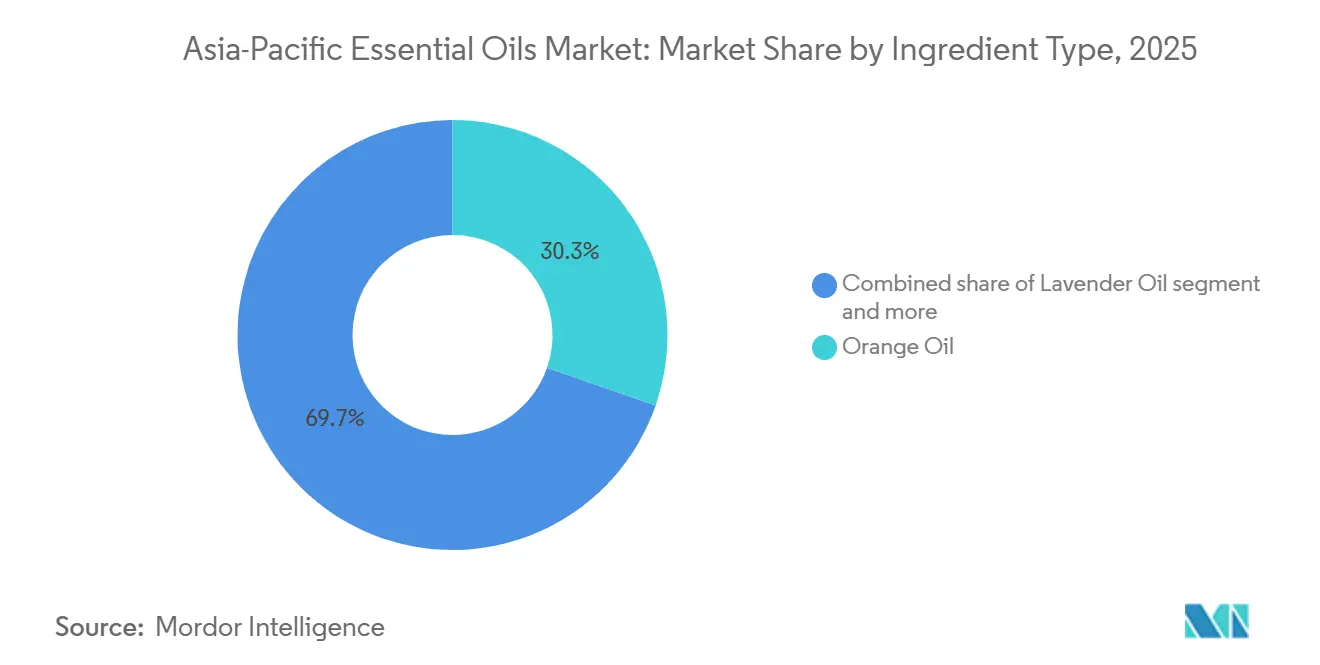
- By ingredient type, orange oil led with 30.31% of the Asia-Pacific essential oil market share in 2025, while lavender oil recorded the highest forecast growth at 8.72% CAGR through 2031.
- By source, flower extracts accounted for 35.08% of the Asia-Pacific essential oil market size in 2025 and are set to advance at a 9.00% CAGR to 2031.
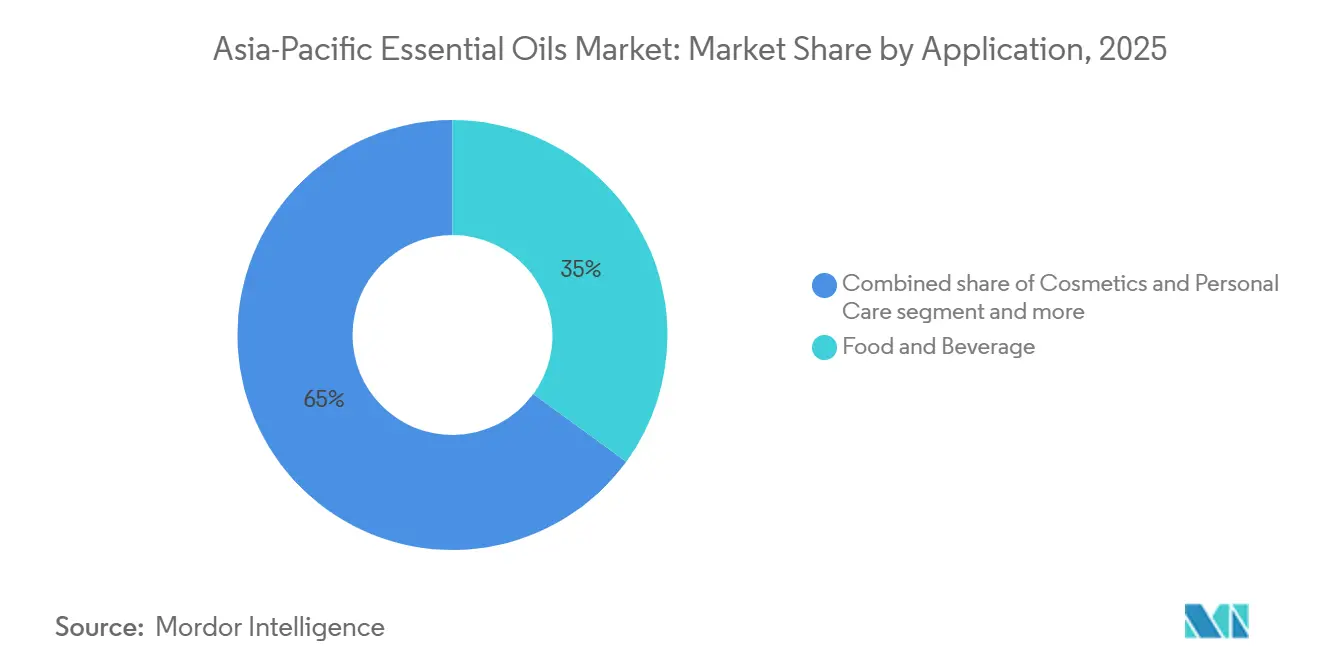
- By application, food and beverage represented 35.03% of segment revenue in 2025; cosmetics and personal care is poised to grow at a 9.62% CAGR through 2031.
- By geography, China commanded 37.21% of 2025 revenue, whereas Japan is expected to expand at a 9.43% CAGR through 2031.
Note: Market size and forecast figures in this report are generated using Mordor Intelligence’s proprietary estimation framework, updated with the latest available data and insights as of January 2026.
Market Trends and Insights
Drivers Impact Analysis of Asia-Pacific Essential Oils Market*
| Driver | (~) % Impact on CAGR Forecast | Geographic Relevance | Impact Timeline |
|---|---|---|---|
| Growing preference for natural and organic ingredients across consumer products | +1.5% | China, India, Southeast Asia with spillover to Japan and Australia | Medium term (2-4 years) |
| Rapid expansion of aromatherapy and wellness practices | +1.3% | Japan, South Korea, urban centers in China and India | Long term (≥4 years) |
| Increasing use of essential oils in natural and clean beauty formulations | +1.4% | South Korea, Japan, China, with export-driven growth in Thailand | Medium term (2-4 years) |
| Rising awareness of therapeutic and functional benefits in traditional medicine | +1.0% | China, India, Indonesia, with Traditional Chinese Medicine and Ayurveda hubs | Long term (≥4 years) |
| Innovation in flavors for food and beverage applications | +1.2% | China, Japan, Australia, Singapore, with regulatory push in packaged goods | Short term (≤2 years) |
| Shift toward chemical-free household and home-care products | +0.9% | Australia, Singapore, Japan, with eco-certification uptake | Medium term (2-4 years) |
| Source: Mordor Intelligence | |||
Growing preference for natural and organic ingredients across consumer products
Consumer goods manufacturers across the Asia-Pacific region are making significant changes to their personal care, food, and household product lines by replacing synthetic fragrances and preservatives with steam-distilled essential oils. This transition has been driven by regulatory requirements in countries like China and South Korea, which now mandate full ingredient disclosure on cosmetic labels. In 2024, China's National Medical Products Administration expanded its cosmetic-ingredient negative list to include 27 synthetic musks and phthalates. As a result, brands have started using essential oils such as geranium, rose, and sandalwood in premium skincare products. Similarly, in 2025, India's Bureau of Indian Standards revised its specifications for organic essential oils under Indian Standard 210, introducing stricter residue limits for pesticides and heavy metals. While these changes have increased compliance costs, they have also provided a competitive edge for National Accreditation Board for Testing and Calibration Laboratories (NABL)-accredited distillers by ensuring higher quality standards. At the same time, there is a growing awareness among the middle class about ingredient safety. A survey conducted in 2025 found that 68% of urban Chinese consumers checked cosmetic labels for natural claims before making a purchase. This preference for natural ingredients is not limited to cosmetics but also extends to the food and beverage industry. For instance, clean-label mandates in Australia and Singapore have encouraged beverage manufacturers to replace artificial citrus flavors with cold-pressed orange and lemon oils, offering both flavor authenticity and marketing appeal. Additionally, organic certification schemes such as United States Department of Agriculture (USDA) Organic and European Union (EU) Organic are gaining popularity in export-oriented markets. Indian and Thai distillers are increasingly investing in these certifications to access premium price points in markets like Japan and Australia.
Rapid expansion of aromatherapy and wellness practices
The adoption of aromatherapy is growing significantly across Japan, South Korea, and urban China, driven by an aging population, workplace stress reduction programs, and its integration into traditional wellness practices. In Japan, the Ministry of Health, Labour and Welfare approved 12 new essential-oil-based aromatherapy products for over-the-counter sale in 2025, recognizing their role in reducing stress and improving sleep among the aging population. In South Korea, the wellness tourism sector, which attracted 4.2 million visitors in 2025, now includes essential-oil massages and diffuser experiences in 73% of spa facilities, incorporating oils such as lavender, eucalyptus, and peppermint into hospitality services. In China, the State Administration of Traditional Chinese Medicine endorsed aromatherapy as a complementary approach in its 2024 guidelines for integrative health clinics, prompting provincial governments to subsidize essential-oil diffusers in eldercare facilities across Jiangsu and Zhejiang provinces. Meanwhile, India's Ayurvedic wellness centers, which numbered over 8,000 in 2025, are increasingly incorporating steam-distilled oils such as sandalwood, vetiver, and jasmine into therapeutic treatments, supported by research from the Council of Scientific and Industrial Research's Central Institute of Medicinal and Aromatic Plants. Additionally, direct-selling networks such as doTERRA and Young Living expanded their distributor bases in Southeast Asia by 18% in 2025, leveraging social media education and home-party models to make aromatherapy more accessible beyond urban elite markets.
Increasing use of essential oils in natural and clean beauty formulations
Korean and Japanese beauty brands are incorporating essential oils into anti-aging serums, cleansers, and sheet masks to comply with microplastic bans and address consumer demand for transparent ingredient lists. In 2024, South Korea's Ministry of Food and Drug Safety banned microbeads in rinse-off cosmetics and extended the restrictions to leave-on products in 2025. This regulatory shift has led formulators to replace synthetic exfoliants and preservatives with essential oils such as tea tree, lavender, and rosemary, which provide antimicrobial and antioxidant benefits. In Japan, major cosmetic companies like Shiseido and Kao introduced 34 new essential-oil-infused product lines in 2025, focusing on cold-pressed yuzu, hinoki cypress, and camellia oils sourced from domestic farms to support "Made in Japan" premiumization strategies. Meanwhile, China's C-beauty market, which recorded a 22% year-on-year growth in 2025, prominently features essential oils as key ingredients in brands like Florasis and Proya, leveraging Traditional Chinese Medicine themes with ginseng, goji, and osmanthus extracts. In Thailand, contract manufacturers, responsible for 40% of ASEAN's private-label cosmetics, reported a 29% increase in essential-oil procurement in 2025, driven by export demand from Australia and Singapore, where clean-beauty retail channels have expanded shelf space for natural formulations. Regulatory standards such as ISO 9235 for oleoresins and ISO 4730 for essential-oil nomenclature provide quality benchmarks that facilitate cross-border trade, reducing formulation risks for multinational brands entering the region.
Rising awareness of therapeutic and functional benefits in traditional medicine
Traditional medicine systems in the Asia-Pacific region are increasingly adopting essential oils into clinical practices, driven by government support and research that highlights their antimicrobial, anti-inflammatory, and pain-relieving properties. The World Health Organization's 2024 Traditional Medicine Strategy emphasized essential oils as proven interventions for respiratory infections and stress-related disorders. This has encouraged health ministries in countries like China, India, and Indonesia to include aromatherapy in primary care guidelines [1]. For example, India's Ministry of Ayurveda, Yoga and Naturopathy, Unani, Siddha, and Homeopathy (AYUSH) allocated INR 120 crore (USD 14.4 million) in 2025 to promote research on essential oils in Ayurvedic formulations. Research conducted at the All India Institute of Medical Sciences has shown the effectiveness of eucalyptus and peppermint oils in managing symptoms of chronic obstructive pulmonary disease. Similarly, China's State Administration of Traditional Chinese Medicine published a 2025 compendium that identified 47 essential oils for therapeutic use, such as sandalwood for reducing anxiety and ginger oil for improving digestion, enabling licensed Traditional Chinese Medicine practitioners to prescribe them. In Indonesia, the National Agency of Drug and Food Control approved 19 essential-oil-based Jamu products in 2025, combining traditional formulations with modern extraction methods to meet export standards for markets like Malaysia and Singapore. Clinical studies have further validated these developments, including a 2025 study in the Journal of Ethnopharmacology that demonstrated tea tree oil's effectiveness against antibiotic-resistant Staphylococcus aureus, which has supported its use in hospital infection-control protocols across Australia and New Zealand.
Restraints Impact Analysis of Asia-Pacific Essential Oils Market*
| Restraint | (~) % Impact on CAGR Forecast | Geographic Relevance | Impact Timeline |
|---|---|---|---|
| High production costs and volatile raw material prices | -1.1% | India, China, Indonesia, with climate-sensitive lavender and citrus regions | Short term (≤2 years) |
| Quality control problems, adulteration, and dilution in the supply chain | -0.8% | China, India, Southeast Asia, with spot-market concentration | Medium term (2-4 years) |
| Limited standardization of grades, specifications, and certification schemes | -0.6% | ASEAN economies, with fragmented national regulations | Long term (≥4 years) |
| Competition from cheaper synthetic fragrances and flavors | -0.9% | Indonesia, Thailand, Philippines, with price-sensitive consumer segments | Medium term (2-4 years) |
| Source: Mordor Intelligence | |||
High production costs and volatile raw material prices
Essential-oil production continues to face significant cost pressures due to labor-intensive harvesting, energy-intensive distillation processes, and climate-induced yield variability, which disrupt supply chains and reduce margins for distillers. In 2024, lavender cultivation in China's Xinjiang region and India's Kashmir valley experienced yield declines of 18% and 23%, respectively, caused by unseasonal frost and erratic monsoon patterns. These factors drove spot prices for lavender oil from USD 45 per kilogram in January 2024 to USD 68 per kilogram by December 2025. Citrus-peel oil production, which depends on by-product streams from juice manufacturing, remains susceptible to fluctuations in fruit prices. A drought in 2025 in China's Jiangxi province reduced orange harvests by 14%, tightening the supply of cold-pressed orange oil and increasing prices by 22% year-on-year. Additionally, steam-distillation energy costs, which constitute 30 to 40% of production expenses, rose sharply in 2025. Natural gas and electricity tariffs increased by 12% and 9%, respectively, in India and Indonesia, further squeezing margins for small-scale distillers who lack access to renewable energy infrastructure. Labor scarcity adds to these challenges, particularly for crops like jasmine, rose, and ylang-ylang, which require 200 to 300 person-hours per hectare for hand-harvesting. Wage inflation in Thailand and Vietnam, where agricultural labor costs rose by 8% in 2025, forced some growers to abandon low-yield plots. These conditions benefit vertically integrated players who manage cultivation, distillation, and formulation processes, while creating significant barriers for new entrants and commodity traders reliant on spot markets.
Quality control problems, adulteration, and dilution in the supply chain
Adulteration remains a significant issue in the Asia-Pacific essential oil trade, with chromatography audits identifying synthetic additives, carrier-oil dilution, and species substitution that undermine product quality and erode brand trust. The International Organization for Standardization (ISO) Technical Committee 54, which oversees essential oil standards, reported 127 cases of adulterated lavender oil in 2024. These cases included samples blended with synthetic linalool and linalyl acetate to mimic authentic lavender profiles [2]. Similarly, in 2025, the Bureau of Indian Standards (BIS) found that 34% of lemon oil samples tested contained added limonene or terpene fractions. This practice is primarily driven by price differences, as cold-pressed citrus oils are priced at USD 18 per kilogram, compared to isolated terpenes at USD 6 per kilogram. In China, spot markets in Guangzhou and Shanghai, which account for 40% of the regional essential oil trade, do not require third-party testing. This lack of regulation enables brokers to mix lower-cost oils, such as eucalyptus, into peppermint or spearmint without disclosure. Advanced detection methods like gas chromatography-mass spectrometry (GC-MS) and nuclear magnetic resonance (NMR) spectroscopy, which are highly effective in identifying adulteration, remain underutilized outside Australia and Japan due to the high cost of equipment, which exceeds USD 150,000 per laboratory. In India, the National Accreditation Board for Testing and Calibration Laboratories (NABL) accredited only 23 essential oil testing facilities as of 2025, which is insufficient to monitor the 4,800 distilleries operating in states such as Uttar Pradesh, Tamil Nadu, and Kerala. This gap in quality control reduces buyer confidence, particularly among multinational flavor and fragrance companies that require ISO 4730-compliant certificates of analysis.
*Our forecasts treat driver/restraint impacts as directional, not additive. The impact forecasts reflect baseline growth, mix effects, and variable interactions.
Asia-Pacific Essential Oils Market Segment Analysis
By Ingredient Type:
Citrus Dominance Meets Floral AccelerationAdvancements in cold-press extraction methods and the utilization of by-products have enabled orange oil to account for 30.31% of the ingredient type segment in 2025. Lavender oil, on the other hand, is projected to grow at a compound annual growth rate (CAGR) of 8.72% through 2031, driven by increased cultivation in China and India. Orange oil benefits from its integration with citrus juice production, where peel waste from China's 7.5 million metric tons of orange production in 2025 is used in cold-press mills. This process yields d-limonene-rich oil at a lower cost compared to standalone distillation methods [3]. Food and beverage applications account for 58% of orange oil consumption, with beverage manufacturers in Japan and Australia replacing synthetic citrus esters to comply with clean-label requirements. Lavender oil's growth is supported by expanded cultivation in Xinjiang, where 12,000 hectares began production in 2024 and 2025, and in Kashmir, where state subsidies facilitated the planting of 3,400 hectares. These developments have reduced import dependence and lowered procurement costs for domestic aromatherapy brands.
Peppermint oil and spearmint oil, primarily used in pharmaceutical and oral-care applications, are witnessing growth driven by increasing demand for menthol in India's cough-drop and analgesic-balm industries. Eucalyptus oil, sourced mainly from Australia's 28,000 hectares of plantation forests, is expanding due to its antimicrobial applications in household cleaners and pharmaceutical inhalants. Tea tree oil, a niche segment concentrated in New South Wales and Queensland, is growing as Korean and Japanese cosmetic brands include it in acne treatments and scalp-care products, bolstered by clinical studies demonstrating effectiveness against Propionibacterium acnes. Lemon oil, rosemary oil, and geranium oil support fragrance and flavor applications where distinct sensory profiles command premium pricing in specialized formulations.

By Source:
Flower Extraction Leads on Premium PositioningFlower-based sources accounted for 35.08% of the source segment in 2025 and are projected to grow at a CAGR of 9.00% through 2031. This growth is attributed to advancements in steam-distillation efficiency and the premium pricing of extracts such as rose, jasmine, and ylang-ylang. Rose oil, requiring 4,000 kilograms of petals to produce 1 kilogram of oil, is priced at over USD 300 per kilogram, making it a luxury ingredient in high-end perfumery and anti-aging cosmetics. In 2025, India's Kannauj region and China's Gansu province collectively produced 2,800 kilograms of rose oil, utilizing solar-powered distillation units that reduced energy costs by 18% while maintaining the ester profiles demanded by European and Japanese buyers. Jasmine oil, harvested at night to preserve its volatile compounds, is used in perfumery and aromatherapy, with Thailand and India exporting 1,200 kilograms in 2025 at an average price of USD 180 per kilogram. Ylang-ylang oil, distilled in Indonesia and the Philippines.
Leaf-based sources, including eucalyptus, tea tree, and peppermint, constituted a significant portion of the segment and are experiencing notable growth. This growth is supported by Australia's plantation-forestry model, which ensures consistent yields and facilitates mechanized harvesting. Bark-based sources, primarily cinnamon from Indonesia and Sri Lanka, accounted for a smaller portion of the segment and are growing steadily, driven by their use in food flavoring and pharmaceutical applications. Root-based sources, such as vetiver and ginger, represented another portion of the segment and are expanding, although growth is limited by labor-intensive harvesting processes and multi-year cultivation cycles. Other sources, including seeds, peels, and resins, made up the remaining portion of the segment. Oils such as nutmeg, clove, and frankincense serve niche markets in fragrance and traditional medicine applications.
By Application:
Food Maturity Versus Cosmetics AccelerationIn 2025, food and beverage applications accounted for 35.03% of the application segment, driven by clean-label mandates in packaged snacks and beverages. However, cosmetics and personal care applications are projected to grow at a compound annual growth rate (CAGR) of 9.62% through 2031, outpacing other end-use segments. This growth is attributed to Korean and Japanese brands reformulating anti-aging serums with tea tree, lavender, and geranium oils to comply with microplastic bans. In China, beverage manufacturers, who produced 180 million liters of flavored sparkling water in 2025, transitioned from synthetic citrus esters to cold-pressed orange and lemon oils due to a 2024 regulation requiring "natural flavor" claims to be substantiated with botanical extracts. Japan's functional beverage market, valued at USD 8.2 billion in 2025, incorporated peppermint and ginger oils into energy drinks and wellness shots, leveraging their thermogenic and digestive properties to differentiate from caffeine-based formulations. Australia's craft beverage segment, which grew by 31% in 2025, utilized essential oils in botanical gins, kombucha, and cold-brew coffee, with distillers sourcing native lemon myrtle and Tasmanian pepperberry oils to create terroir-driven flavor profiles.
Aromatherapy applications, including diffusers, massage oils, and spa treatments, captured 22% of the segment in 2025 and are expected to grow at a CAGR of 8.9%, driven by Japan's aging population and South Korea's wellness tourism sector. Pharmaceutical applications, which include cough syrups, analgesic balms, and antimicrobial ointments, held an 18% share of the segment in 2025 and are projected to grow at a CAGR of 7.7%. This growth is supported by clinical validation of eucalyptus and tea tree oils in respiratory and dermatological therapies.
Geography Analysis
China Essential Oils Market
China is expected to lead the regional essential oils market with a 37.21% share in 2025. This leadership is attributed to its dual role as the largest producer and consumer of essential oils in the region. The country's production is supported by citrus-peel processing activities in Jiangxi and Hunan provinces. A significant portion of the locally produced essential oils is utilized by the domestic cosmetics market, which continues to grow steadily. Additionally, food and beverage applications accounted for a notable share of consumption, driven by clean-label regulations that require the use of natural flavoring in packaged goods. Furthermore, the State Administration of Traditional Chinese Medicine in China included aromatherapy as a complementary modality in its 2024 guidelines for integrative health clinics, encouraging provincial governments in Jiangsu and Zhejiang provinces to subsidize essential-oil diffusers for eldercare facilities.
Japan Essential Oils Market
Japan is projected to exhibit the fastest growth in the regional essential oils market, with a compound annual growth rate (CAGR) of 9.43% through 2031. This growth is supported by demographic trends, as a significant portion of Japan's population was aged 65 and older in 2025. The aging population has driven demand for aromatherapy products that address issues such as sleep disorders, cognitive decline, and chronic pain. In 2025, the Ministry of Health, Labour and Welfare approved 12 new essential-oil-based aromatherapy products for over-the-counter sale, recognizing their effectiveness in reducing stress and improving sleep. Additionally, Japan's cosmetics industry, which generated substantial revenue in 2025, has increasingly incorporated essential oils such as cold-pressed yuzu, hinoki cypress, and camellia oils into anti-aging serums and cleansers. These efforts align with "Made in Japan" premiumization strategies, which emphasize high-quality, locally sourced ingredients.
India Essential Oils Market
India accounted for a significant share of essential oil production in 2025, primarily due to its menthol and mint-oil production in Uttar Pradesh, which supplied a majority of the global demand for menthol. Despite this strong production capacity, the domestic essential-oil market in India remains underpenetrated, presenting opportunities for further growth and development. In 2025, India’s menthol production, along with other essential oils, contributed to a total output of 18,400 metric tons. The country’s production capabilities highlight its potential to expand its presence in the global essential oils market, particularly as demand for natural and sustainable products continues to rise.
Regulatory Landscape
Across Asia-Pacific, essential oils used as flavorings, fragrances, and wellness inputs sit at the intersection of food-additive, novel ingredient, cosmetic, and natural health-product rules, which often determines the compliance pathway and time to market. For food applications, Singapore Food Agency (SFA) requires pre-approval of food additives under the Sale of Food Act and applies a pre-market safety assessment route for novel foods and novel food ingredients (updated guidance issued March 2025). This raises documentation requirements when an essential oil is positioned as a new ingredient or functional component rather than a traditional flavoring.
Australia and New Zealand regulate additives through the Food Standards Code (including Standard 1.3.1), and novel foods must be assessed and listed in the Code (Section S25-2) before sale, shaping how suppliers position essential oil fractions and delivery formats. In India, FSSAI governs additive use via the Food Safety and Standards (Food Products Standards and Food Additives) Regulations, 2011, with non-specified foods and ingredients handled through the 2017 regulations, which increases the need for manufacturing and safety dossiers when products fall outside existing standards. At the regional level, ASEAN member states reference Codex GSFA principles and the ASEAN Annex on maximum use levels for food additives (April 2025 update). This supports partial harmonization for cross-border product rollout, even as enforcement and interpretation remain national.
Value Chain Analysis
The Asia-Pacific essential oils value chain typically runs from crop selection and cultivation (smallholders and plantations for citrus, mint, eucalyptus, patchouli, lavender, clove, and other botanicals) to harvesting and primary processing (steam distillation or cold-press for citrus). Downstream steps include fractionation, blending, and formulation into food and beverage, cosmetics, aromatherapy, and pharmaceutical products. Indonesia remains structurally important for patchouli supply, with sourcing commonly moving through multi-tier channels from farmers to local collectors, distillers, and exporters before reaching regional and global flavor and fragrance houses, creating traceability and consistency risks for buyers that require standardized certificates of analysis.
Midstream processing is split between small and mid-sized distillers and larger integrated players, with multinational and regional processors (e.g., Givaudan, Symrise, and Takasago) increasingly tying procurement to agronomic support and quality assurance programs. In Indonesia, named suppliers and processors such as PT Van Aroma, PT Haldin Pasific Semesta, and Agrapana Spices illustrate the exporter-processor role that bridges local biomass with overseas buyers. Quality gates are often executed through testing and certifications (e.g., ISO 9001 and FSSC 22000, plus market-driven Halal and Kosher requirements), while bottlenecks tend to cluster around harvest volatility, energy-intensive distillation economics, and limited end-to-end testing infrastructure outside the most mature markets. This keeps direct-trade and tighter supplier qualification central to procurement strategies.
Competitive Landscape
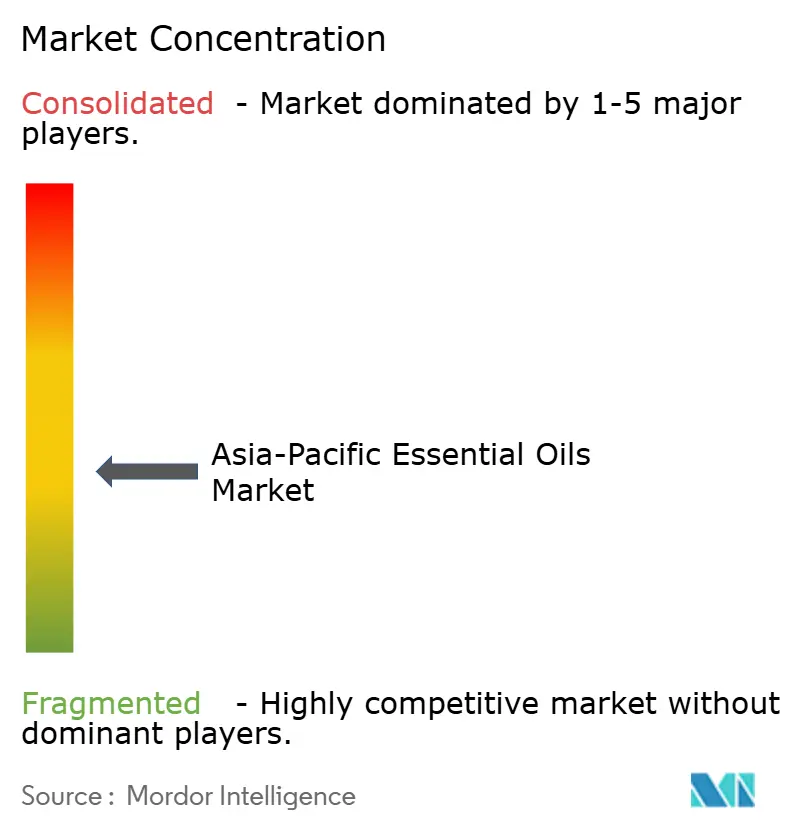
The Asia-Pacific essential oil market is moderately fragmented, comprising multinational corporations, regional distillers, and small-scale producers. Prominent players include multinational flavor and fragrance companies such as Givaudan SA, Symrise AG, and Takasago, along with direct-selling networks like doTERRA International, LLC and Young Living. Regional distillers, including Synthite Industries and VedaOils, as well as numerous small-scale producers in countries such as China, India, and Indonesia, further enhance the market's diversity. Multinational companies often adopt vertical integration strategies, overseeing the entire supply chain from upstream cultivation through contract farming to midstream distillation in owned facilities and downstream formulation. For instance, Givaudan's 2025 acquisition of a 40% stake in a Chinese lavender cooperative in Xinjiang secures an annual supply of 1,200 metric tons.
Direct-selling companies like doTERRA and Young Living adopt asset-light models, outsourcing distillation to third-party processors while focusing on distributor recruitment and consumer education. In 2025, doTERRA's distributor base in the Asia-Pacific region grew by 18%, reaching 420,000 members across Japan, South Korea, and Australia. Meanwhile, Young Living introduced 14 new product SKUs in Malaysia and Singapore, incorporating essential oils into household cleaners and personal-care products. Similarly, Symrise expanded its Indonesian clove-oil sourcing network to include 800 smallholder farms, integrating agronomic support and quality assurance to maintain consistent volume and purity. These strategies highlight the diverse approaches adopted by companies to strengthen their market presence.
Regional distillers differentiate themselves through organic certification, terroir branding, and positioning their products for therapeutic benefits. For instance, Synthite Industries achieved USDA Organic and European Union (EU) Organic certifications in 2025 for its mint and spice-oil operations in Kerala. This accomplishment not only highlights product quality but also enables premium pricing in export markets. The market is also witnessing emerging opportunities, such as biotechnology-derived essential-oil analogs. Fermentation platforms can produce rose and sandalwood molecules at costs 40% lower than traditional botanical extraction methods. Additionally, precision agriculture is gaining traction, with Indian and Chinese growers utilizing technologies like soil-moisture sensors and drone-based pest monitoring. These advancements have led to stabilized yields and a 15% reduction in input costs, enhancing efficiency and sustainability in the region.
Asia-Pacific Essential Oils Industry Leaders
-
doTERRA International, LLC
-
Young Living Essential Oils, LC
-
Ultra International
-
Givaudan SA
-
Symrise AG
- *Disclaimer: Major Players sorted in no particular order
Asia-Pacific Essential Oils Market Companies Covered in this Report
- doTERRA International, LLC
- Young Living Essential Oils, LC
- Ultra International
- Givaudan SA
- Symrise AG
- Firmenich
- IFF
- Robertet
- Takasago
- Biolandes
- Sydney Essential Oil Co.
- Australian Botanical Products
- AWO (Australian Wholesale Oils)
- BMV Fragrances
- Synthite Industries
- VedaOils
- Florihana
- Moksha Lifestyle Products
- Oshadhi
- Essential Oils of New Zealand
Market Opportunities and Future Outlook
Formulation-driven substitution in packaged foods and beverages is a visible opportunity area, with essential oils used as natural flavoring and preservation tools as manufacturers reduce reliance on synthetic additives and tighten documentation for natural claims. This ties directly to regulatory and retailer-driven transparency: when oils are positioned as food ingredients (rather than traditional flavors), suppliers that can provide traceability, robust specifications, and fit-for-purpose stability data are better positioned to access higher-volume accounts, especially in functional beverages and other clean-label categories.
Technology-led differentiation centers on making essential oils easier to use in industrial food matrices, where volatility, oxidation, and solubility constraints limit dosing and sensory control. Encapsulation and nanoemulsion approaches are moving from lab validation toward application development, supported by recent peer-reviewed work such as a 2026 Food Control review on encapsulated essential oils for spoilage control and a 2026 MDPI Foods study combining essential oil nanoemulsions with ultrasound to control foodborne pathogens. For Asia-Pacific suppliers, these delivery systems create room to differentiate beyond commodity grades, particularly when paired with premium extraction routes already used in the region (e.g., cold-press and supercritical CO2 extraction cited in the market context) and with compliance positioning aligned to residual-solvent expectations in more regulated end markets.
Recent Industry Developments in Asia-Pacific Essential Oils Market
- June 2026: doTERRA held the SEA Shine Convention 2026 in Thailand, convening regional Wellness Advocates around product discovery and education. The scale and localization of this event reinforces Southeast Asia as a priority commercialization corridor for aromatherapy-led essential oil consumption. It also strengthens channel engagement for repeat purchases in a category where community-led selling models play a central role.
- May 2026: Young Living marked a partnership with Yusen Logistics at a Bangkok event focused on direct-to-consumer fulfillment. The move signals investment in distribution capability that supports faster delivery, improved handling requirements, and broader reach across Southeast Asia. It also raises the competitive bar for service levels in markets where temperature sensitivity and product integrity influence customer retention.
- October 2024: BO International (India) obtained Kosher certification covering essential oils and related product lines. This certification supports access to export and institutional customer segments that require recognized third-party assurances. It also complements broader quality-positioning strategies in a region where adulteration concerns continue to influence buyer qualification.
Asia-Pacific Essential Oils Market Report Scope and Research Methodology
Market Definition and Coverage
For this study, the market is defined as sales of essential oils across Asia-Pacific, counted as finished oil value sold into end-use industries, regardless of botanical source.
Scope exclusions: We exclude synthetic fragrance chemicals, carrier oils, blends where the essential oil component cannot be separated, and downstream retail markups outside the essential oil value.
Segments Covered in This Report
- By Ingredient Type
- Lavender Oil
- Orange Oil
- Eucalyptus Oil
- Peppermint Oil
- Spearmint Oil
- Lemon Oil
- Rosemary Oil
- Geranium Oil
- Tea Tree Oil
- Other Oils
- By Source
- Flowers
- Leaves
- Bark
- Roots
- Others
- By Application
- Food and Beverage
- Aromatherapy
- Pharmaceuticals
- Cosmetics and Personal Care
- Others
- By Geography
- China
- India
- Japan
- Australia
- Indonesia
- South Korea
- Thailand
- Singapore
- Rest of Asia-Pacific
Data Sources, Market Sizing, and Validation
Desk Research
Desk research helped us map the supply base, demand pools, and trade-linked flows for essential oils in Asia-Pacific, and then set realistic ranges for volumes and pricing. Public sources such as UN Comtrade, FAOSTAT, the World Bank, national customs and statistics offices, and patent databases were reviewed to understand production footprints, import dependency, and product innovation themes.
We also checked company annual reports, investor presentations, reputed press, and association websites linked to flavors, fragrances, and aromatherapy to confirm demand direction and capacity additions. When needed, we referenced paid subscriptions for company financials and intelligence, shipment-level import and export data, and patent coverage to fill disclosure gaps and cross-check directional trends. These sources are not exhaustive, and many other public and paid references were used for data collection, validation, and clarification.
Primary Interviews and Surveys
Primary inputs came from interviews and structured surveys with manufacturers, ingredient distributors, contract processors, brand-side formulators, and large buyers across food, personal care, and wellness. For Asia-Pacific coverage, we ensured the sample captured views across major consumption and production hubs, and then used responses to confirm pricing ladders, application mix, and the realism of trade-based demand signals.
Distribution of primary research fieldwork respondents
| Company type | Respondent position |
|---|---|
| Top tier: 37% | CXOs: 15% |
| Mid tier: 47% | Functional/Unit leaders: 30% |
| Smaller Players: 16% | Managers: 55% |
Market-Sizing & Forecasting
Sizing was built using a top-down and bottom-up model approach, where regional demand is reconstructed from country-level trade movements, production proxies, and end-use pull indicators, then converted into value using validated average selling prices. We also corroborated results with selective bottom-up approximations, such as rolling up a sampled set of supplier revenues and checking implied liters against typical application usage rates shared by buyers.
Inputs in the model included essential oil import and export trends for major economies, observed price spreads by oil type (for example citrus and mint families versus tea tree and floral oils), the split of demand between cosmetics and personal care versus food and beverages and aromatherapy, and changes in local cultivation and extraction capacity. Forecasts were created using scenario analysis, where the base case was shaped by expert views on natural ingredient preference, new product launches, and expected pricing normalization after supply shocks. Where country detail was thin, gaps were handled through trade mirrors, peer-country ratios, and conservative pricing bands, then rechecked with respondents.
Data Validation & Update Cycle
Validation is done by triangulating model outputs against independent signals such as trade intensity, implied per-capita usage for major applications, and supply availability suggested by cultivation and processing footprints. Outliers are flagged, assumptions are revisited, and follow-up calls are triggered when variances cannot be explained through timing, currency, or one-off events.
Before sign-off, a second analyst reviews the worksheets, and a final variance check is completed at country and regional level so the story matches the numbers. Reports are refreshed annually, and interim updates are made when material events occur, such as sharp raw material swings or regulatory changes. Before delivery, we do a fresh pass so clients receive the latest updated view.
Mordor Intelligence's Asia Pacific Essential Oils Market Estimate Compared With Other Published Estimates
Published market values for Asia-Pacific essential oils can look far apart because sources do not always count the same products, the same selling point in the chain, or the same set of countries. Differences in how prices are averaged across oil types, and how currency timing is handled, can also move the value meaningfully even when the volume story is similar.
Some published figures fold in broader fragrance ingredients or aroma chemicals, and some lean on headline projections without showing how liters and pricing link back to end-use applications. A tighter count is obtained when only pure essential oils sold into food and beverages, aromatherapy, pharmaceuticals, and cosmetics and personal care are included, and Mordor Intelligence applies that filter before reconciling totals to trade and realistic price bands by oil type.
Benchmark comparison
| Source | Market Size | Gaps in Research Methodology |
|---|---|---|
| Mordor Intelligence | USD 2.46 B (2025) | |
| Trade Journal A | USD 4.91 B (2025) | Uses a broader regional total with limited clarity on whether fragrance ingredients beyond pure essential oils are included, and the pricing basis by oil type is not shown, which can lift blended ASPs. |
| Regional Consultancy B | USD 2.16 B (2023) | Anchors to an earlier base year and may apply a narrower country mix and application set, and the bridge from trade signals to final value is not explicitly rechecked with buyer-side price validation. |
The spread in the table mainly comes from scope breadth and how the average selling price is constructed across very different oil families. By keeping the build-up traceable to a stated country set, clear applications, and repeatable trade and pricing checks, the final number stays easier to test and update when market conditions shift.
Key Questions Answered in the Report
How large is the Asia-Pacific essential oil market in 2026?
The Asia-Pacific essential oil market size is USD 2.65 billion in 2026 and is forecast to reach USD 3.94 billion by 2031.
Which ingredient holds the largest share of sales?
Orange Oil leads, accounting for 30.31% of 2025 revenue.
What is the fastest-growing application for essential oils?
Cosmetics and personal care products are set to expand at a 9.62% CAGR through 2031.
Which country is growing quickest?
Japan posts the highest national CAGR at 9.43% over the forecast period.