Market Overview
| Study Period | 2018 - 2030 |
|---|---|
| Base Year For Estimation | 2024 |
| Forecast Data Period | 2025 - 2030 |
| Market Size (2025) | USD 22.22 Billion |
| Market Size (2030) | USD 31.36 Billion |
| Growth Rate (2025 - 2030) | 7.14% CAGR |
| Market Concentration | Low |
Major Players*Disclaimer: Major Players sorted in no particular order Image © Mordor Intelligence. Reuse requires attribution under CC BY 4.0. |
|

Asia-Pacific Energy Drinks Market Analysis by Mordor Intelligence
The Asia-Pacific Energy Drinks Market size is estimated at 22.22 billion USD in 2025, and is expected to reach 31.36 billion USD by 2030, growing at a CAGR of 7.14% during the forecast period (2025-2030).
The Asia-Pacific energy drink market is experiencing a significant transformation driven by evolving consumer preferences and health consciousness. A notable shift is occurring as consumers increasingly prioritize natural energy drink options with clean-label attributes and natural ingredients. This trend is particularly evident in major markets across the region, where in 2022, approximately 40-50% of consumers reported paying high attention to the natural ingredients used in their food and beverages. Energy drink manufacturers are responding to this demand by reformulating their products to include natural extracts, reduced sugar content, and functional ingredients, moving away from artificial additives and preservatives.
The market is witnessing a remarkable shift in consumption patterns, particularly among younger demographics. Traditional caffeinated beverages like coffee are being displaced by energy drinks, especially among millennials and Generation Z consumers. This transition is reflected in recent consumption data, with 2023 statistics showing that approximately 18% of Vietnamese consumers now consume energy drinks multiple times per week. The appeal extends beyond a mere energy boost, as consumers increasingly seek functional benefits such as enhanced mental acuity, improved physical performance, and sustained energy release.
Innovation in product formulation and flavor profiles is reshaping the competitive landscape. Manufacturers are introducing sophisticated blends incorporating natural stimulants, vitamins, and functional ingredients like ginseng, guarana, and various botanical extracts. In 2022, the Japanese market demonstrated this trend's impact, with over 55% of consumers showing a preference for established brands that offered innovative formulations. Companies are also expanding their portfolios to include sugar-free variants, functional energy shots, and natural energy drink options to cater to diverse consumer preferences.
The market's growth is further propelled by increasing health and fitness consciousness across the region. In 2022, China alone recorded approximately 440 million people participating in regular sports and physical activities, creating a substantial consumer base for energy drinks. This fitness trend has prompted manufacturers to develop specialized products targeting athletes, fitness enthusiasts, and active lifestyle consumers. Energy drink brands are increasingly positioning their products as lifestyle beverages rather than mere stimulant drinks, incorporating elements like enhanced hydration, electrolyte balance, and recovery-supporting ingredients to appeal to health-conscious consumers. This shift underscores the broader transformation within the energy drink industry, emphasizing the importance of energy drink market growth and capturing a larger energy drink market share.
Asia-Pacific Energy Drinks Market Trends and Insights
Growing requirements for instant energy and alertness, especially among the younger generation boost the sales
- In the Asia Pacific region, consumption of energy drinks has been observed to be growing owing to their definitive advantages in developing an individual's physical and mental abilities.
- As energy drink consists of stimulants other than caffeine, consumers have been inclined towards its consumption as it becomes a better and an an effective alternative than other carbonated or caffeinated beverages, and this has urged the manufacturers to innovate in this arena.
- Energy drinks are typically more expensive in developed countries than developing countries and that is majorly influenced by factors like factors such as availability and cost of ingredients, cost of transportation and most importantly tax slabs.
- Major brands across the region are continuing to double down on their reformulation efforts across sugar, salt and fat reduction led to a rapid increase in consumer awareness and demand for healthier products.
Understand The Key Trends Shaping This Market
Download PDF
OTHER KEY INDUSTRY TRENDS COVERED IN THE REPORT
- Manufacturers are infusing more natural herbal extract ingredients into energy drinks to meet the growing consumer demand
- Many brands in the market are investing heavily in marketing campaigns to build brand awareness and appeal to the target demographic
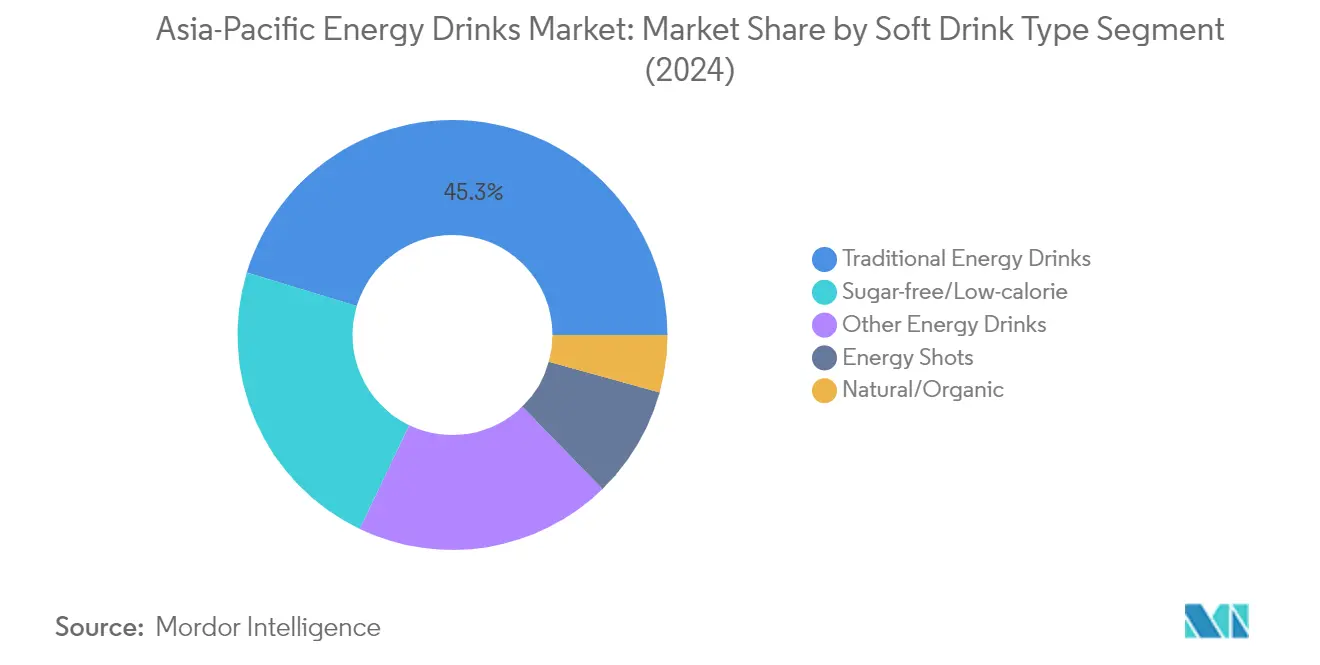
Segment Analysis: Soft Drink Type
Traditional Energy Drinks Segment in Asia-Pacific Energy Drinks Market
Traditional sports drinks continue to dominate the Asia-Pacific energy drinks market, commanding approximately 45% market share in 2024. This significant market position is attributed to the segment's strong brand recognition and established consumer base, particularly among athletes and fitness enthusiasts. The segment's success is driven by continuous product innovations, with major players like Red Bull and Monster Energy leading the way through strategic marketing campaigns that position these drinks as performance drinks and stamina boosters. The segment's growth is further supported by the region's evolving lifestyles and increasing demand for instant energy solutions, with around 75% of energy drink consumers falling in the 18-35 age bracket.
Natural/Organic Energy Drinks Segment in Asia-Pacific Energy Drinks Market
The natural energy drinks segment is emerging as the most dynamic category in the Asia-Pacific market, projected to grow at approximately 9% through 2029. This remarkable growth is driven by increasing consumer awareness regarding the potential hazards of chemicals used in conventional beverage production and growing appreciation for the benefits of organic products. Manufacturers are actively expanding their natural energy drink offerings, incorporating ingredients like guayusa, yerba mate, fenugreek seed, and cardamom seed, along with natural sweeteners such as maple syrup. The segment's expansion is particularly notable in markets like Japan and China, where health-conscious consumers are increasingly seeking cleaner ingredients and simpler recipes with fewer, more natural components.
Remaining Segments in Soft Drink Type
The market's diversity is further enhanced by segments including sugar-free/low-calorie energy drinks, energy shots, and other specialized variants. Sugar-free and low-calorie options are gaining significant traction among health-conscious consumers and those managing diabetes, while energy shots cater to consumers seeking concentrated energy boosts in convenient, single-serve packages. The other energy drinks segment, comprising flavored, caffeine-free, and hybrid options, continues to evolve with innovative formulations and unique flavor profiles, contributing to the market's overall dynamism and meeting diverse consumer preferences across the region.
Segment Analysis: Packaging Type
Metal Can Segment in Asia-Pacific Energy Drinks Market
Metal cans dominate the Asia-Pacific energy drinks market, commanding approximately 54% of the market share in 2024. This dominance can be attributed to several key advantages that metal cans offer over other packaging types. Their lightweight nature and superior portability make them ideal for on-the-go consumption, while their widespread availability across various retail outlets, from kiosks to supermarkets, has further cemented their popularity in the Asian market. Metal cans excel at protecting energy drinks from light and oxygen exposure, which could otherwise compromise product quality and nutritional content. This packaging type also enables rapid cooling in refrigerators, making them perfect for chilled beverages. Major players like Red Bull have embraced metal cans, with over 95% of their beverages being sold in 100% recyclable aluminum cans.
Glass Bottles Segment in Asia-Pacific Energy Drinks Market
The glass bottle segment is emerging as the fastest-growing packaging format in the Asia-Pacific energy drinks market, driven by increasing consumer concerns about potential health risks associated with certain packaging materials like plastic and aluminum. Glass bottles are gaining traction due to their non-reactive nature, which ensures energy drinks remain uncontaminated, while their transparency enhances the visual appeal by allowing consumers to gauge the drink's color. The segment's growth is further supported by glass bottles' recyclability, reusability, and sustainability credentials. Their non-porous, non-toxic, and impermeable properties make them highly hygienic, while their ability to preserve freshness, nutritional content, and sensory attributes of energy drinks over extended periods has made them increasingly attractive to manufacturers and consumers alike.
Remaining Segments in Packaging Type
PET bottles represent a significant segment in the Asia-Pacific energy drinks market, offering a balance between convenience and cost-effectiveness. These bottles are particularly favored for their lightweight properties and durability, making them suitable for various distribution channels. Manufacturers appreciate PET bottles for their 100% recyclability and sustainability features, with major companies like Coca-Cola, PepsiCo Inc., and Monster Beverage Corporation actively investing in recycled polypropylene (rPP) initiatives. The segment continues to evolve with innovations in packaging design and improved recycling capabilities, maintaining its important position in the market.
Segment Analysis: Distribution Channel
Off-trade Segment in Asia-Pacific Energy Drinks Market
The off-trade channel continues to dominate the Asia-Pacific energy drinks market, commanding approximately 52% of the market share in 2024. This dominance is primarily driven by supermarkets and hypermarkets, which offer an extensive array of energy drink brands like Red Bull, Monster Energy, Rockstar, 5-hour Energy, and Bang Energy across diverse flavors and sizes. Major retail chains such as Carrefour, D-Mart, Woolworths, Coles, and IGA have strengthened their position through strategic loyalty programs and extensive store networks. The segment's strong performance is further bolstered by the increasing consumer preference for healthier options, with supermarkets dedicating specific sections to natural and reduced-sugar energy drinks. The convenience and accessibility offered by these retail formats, combined with their ability to maintain competitive pricing through bulk purchasing, has cemented their position as the preferred distribution channel for energy drinks in the region.
On-trade Segment in Asia-Pacific Energy Drinks Market
The on-trade segment is emerging as the fastest-growing distribution channel in the Asia-Pacific energy drinks market, projected to expand at approximately 9% CAGR from 2024 to 2029. This remarkable growth is primarily driven by the surge in international tourism, evolving lifestyles emphasizing dining out, and increasing social gatherings. The segment's expansion is particularly notable in the nightlife sector, with cities like Bangkok, Kuala Lumpur, Phuket, Tokyo, Delhi, and Pattaya witnessing increased consumption of sports energy drinks in bars, clubs, and pubs. The growing trend of using functional energy drinks as mixers in cocktail offerings has further accelerated this growth. Additionally, foodservice operators near corporate offices and educational institutions are capitalizing on the rising demand for sports drinks, positioning energy drinks as an ideal midday boost for their customers.
Remaining Segments in Distribution Channel
Within the off-trade channel, several sub-segments play crucial roles in the market's development. Convenience stores, strategically located in residential areas, offer 24/7 accessibility and quick purchase options for consumers. The online retail segment has gained significant traction, leveraging the convenience of doorstep delivery and extensive product selection. Other distribution channels, including warehouse club stores, vending machines, and departmental stores, contribute to the market's diversity by catering to specific consumer preferences and shopping behaviors. The presence of these varied distribution channels ensures comprehensive market coverage and meets the diverse purchasing patterns of energy drink consumers across the region.
Asia-Pacific Energy Drinks Market Geography Segment Analysis
Energy Drinks Market in China
China dominates the Asia-Pacific energy drinks landscape, commanding approximately 51% of the market value in 2024. The market's robust performance is driven by the country's large youth demographic and their evolving lifestyle preferences. The increasing focus on fitness and physical activities has created a strong demand base, with over 440 million people actively participating in sports and physical activities. Energy drinks have gained significant traction among working professionals seeking performance enhancement during work hours, particularly due to the country's demanding work culture. The market is characterized by a diverse range of offerings, from traditional energy drinks to innovative formulations catering to specific consumer needs. Major brands like Red Bull, Monster, and EastRoc have established strong distribution networks across both urban and rural markets. The trend toward healthier alternatives has led to the introduction of natural ingredients and reduced sugar variants, reflecting the market's adaptability to changing consumer preferences.
Energy Drinks Market in Vietnam
Vietnam's energy drink market is experiencing remarkable momentum and is projected to grow at approximately 6% annually from 2024 to 2029. The market's evolution is closely tied to the country's growing focus on physical and mental well-being, with about 35.6% of Vietnamese citizens engaging in regular exercise. The emergence of gaming culture has created a unique market segment, with manufacturers developing specialized energy drinks formulated to enhance focus, reaction time, and cognitive abilities for the country's 18 million esports players. The market is witnessing a significant shift toward clean-label and organic options, with manufacturers introducing sugar-free and low-calorie variants to meet evolving consumer preferences. The incorporation of functional ingredients like lutein, choline, and L-theanine demonstrates the market's innovation in catering to specific consumer needs. Distribution channels have expanded significantly, with supermarkets and hypermarkets playing a pivotal role in product accessibility and market penetration.
Energy Drinks Market in Japan
Japan's energy drinks market showcases a unique blend of traditional preferences and innovative offerings. The market is characterized by strong brand loyalty, with established players like Red Bull and Power Gold commanding significant consumer trust. Japanese consumers' heightened health consciousness has led to a notable shift toward functional beverages that offer additional nutritional benefits beyond energy enhancement. Traditional energy drinks maintain a strong presence, accounting for a significant portion of the market share, while manufacturers continue to innovate with vitamin-fortified and electrolyte-enhanced formulations. The market's evolution is shaped by the country's work culture and increasing consumer awareness of wellness products. Distribution networks are well-established, with convenient accessibility through various retail channels contributing to steady market growth.
Energy Drinks Market in Australia
Australia's energy drinks market demonstrates sophisticated consumer preferences and strong regulatory frameworks. The market is characterized by a growing emphasis on healthier alternatives, with consumers increasingly gravitating toward sugar-free and natural energy drinks. The consumption patterns are particularly notable among secondary school students, reflecting the need for targeted marketing and responsible consumption guidelines. The market has witnessed significant product innovations, with manufacturers focusing on clean-label products and natural ingredients. Distribution channels are well-developed, with a strong presence across retail outlets and increasing penetration of online platforms. The market's growth is supported by the country's active lifestyle culture and the rising demand for functional beverages among health-conscious consumers. The energy drink market share in Australia is indicative of these trends, with a significant portion of consumers opting for healthier options. Energy drink consumption statistics in Australia further highlight the shift towards natural ingredients and reduced sugar formulations.
Energy Drinks Market in Other Countries
The energy drinks market in other Asia-Pacific countries, including South Korea, Thailand, Malaysia, and Indonesia, exhibits diverse growth patterns and consumer preferences. South Korea's market is particularly influenced by its gaming culture and student population, while Thailand's market benefits from its well-established fitness culture and urban lifestyle trends. Malaysia's market shows strong potential in innovative product formulations, especially in the halal-certified segment. Indonesia's market is characterized by its large youth population and increasing urbanization. Each country presents unique opportunities and challenges, shaped by local cultural preferences, regulatory environments, and distribution networks. The markets are witnessing increased competition with both international and local players introducing innovative products to capture market share.
Get Analysis on Important Geographic Markets
Download PDF
Competitive Landscape
Top Companies in Asia-Pacific Energy Drinks Market
The Asia-Pacific energy drinks market features prominent global players like Red Bull GmbH, Monster Beverage Corporation, and PepsiCo, alongside strong regional contenders such as T.C. Pharmaceutical Industries and Eastroc Beverage Group. Companies are actively pursuing product innovations, particularly in natural and functional ingredients, while also expanding their sugar-free and low-calorie offerings to meet evolving consumer preferences. Operational agility is demonstrated through investments in modern manufacturing facilities and sustainable packaging solutions, with many players adopting recyclable materials and reducing plastic usage. Strategic partnerships, especially with sports organizations, cultural events, and e-commerce platforms, have become crucial for market penetration and brand visibility. Companies are also focusing on geographical expansion through distribution network enhancement and local manufacturing facilities, while some pursue growth through strategic acquisitions and joint ventures to strengthen their market position.
Market Dominated by Mix of Global-Local Players
The Asia-Pacific energy drinks market exhibits a balanced mix of global beverage conglomerates and specialized regional players, creating a dynamic competitive environment. Global giants leverage their extensive research capabilities and international brand recognition, while local players capitalize on their deep understanding of regional preferences and established distribution networks. The market structure is moderately fragmented, with several medium-sized players maintaining significant regional presence through specialized product offerings and strong local brand equity. Many local companies have evolved from single-product specialists to diversified beverage manufacturers, expanding their portfolio to compete with multinational corporations.
The market has witnessed increased consolidation activity, particularly through strategic acquisitions by larger beverage companies looking to expand their energy drinks portfolio. Major beverage conglomerates are actively pursuing partnerships with local players to enhance their market penetration and distribution capabilities. Regional players are forming strategic alliances to compete more effectively with global brands, while also investing in production capabilities and marketing initiatives to maintain their market position. The industry is characterized by continuous evolution in distribution partnerships and marketing collaborations, particularly in emerging markets.
Innovation and Distribution Key to Growth
Success in the Asia-Pacific energy drinks market increasingly depends on companies' ability to innovate while maintaining strong distribution networks. Incumbent players must focus on product differentiation through unique ingredients, functional benefits, and sustainable packaging solutions to maintain their market position. Building strong relationships with retailers and distributors remains crucial, while developing direct-to-consumer channels through e-commerce platforms is becoming increasingly important. Companies need to invest in local manufacturing facilities to ensure cost competitiveness and maintain pricing flexibility, while also developing marketing strategies that resonate with local consumer preferences and cultural nuances.
For contenders looking to gain energy drinks market share, focusing on underserved market segments and developing innovative products tailored to local tastes presents significant opportunities. Success requires building strong distribution partnerships, particularly in rural and emerging markets where established players may have limited presence. Companies must also prepare for potential regulatory changes regarding ingredient composition and health claims, while maintaining flexibility to adapt to evolving consumer preferences. The market shows moderate substitution risk from other functional beverages, making it essential for companies to clearly communicate their products' unique value proposition and maintain strong brand differentiation through targeted marketing initiatives. Notably, Red Bull's market share continues to influence market dynamics, setting benchmarks for other brands.
Asia-Pacific Energy Drinks Industry Leaders
-
Eastroc Beverage(Group) Co., Ltd.
-
Fujian Dali Food Group Co., Ltd.
-
Monster Beverage Corporation
-
Red Bull GmbH
-
T.C. Pharmaceutical Industries Company Limited
- *Disclaimer: Major Players sorted in no particular order

Need More Details on Market Players and Competitors?
Download PDF
Recent Industry Developments
- September 2023: PepsiCo India launched a limited edition flavor of its Sting Energy drink, called Sting Blue Current. Sting Blue Current is available at 200 ml in single-serve packs across India.
- April 2023: Prime has released a new energy drink, Prime Energy, containing 200mg of caffeine and zero sugar.The new drinks hold 300mg of electrolytes and contain ten calories, and come in blue raspberry, tropical punch, lemon lime, orange mango and strawberry watermelon flavours.
- January 2023: Monster is innovating its enery drinks and announced to launch affordable energy drink expansion to drive Asia growth.
Asia-Pacific Energy Drinks Market Report Scope
Energy Shots, Natural/Organic Energy Drinks, Sugar-free or Low-calories Energy Drinks, Traditional Energy Drinks are covered as segments by Soft Drink Type. Glass Bottles, Metal Can, PET Bottles are covered as segments by Packaging Type. Off-trade, On-trade are covered as segments by Distribution Channel. Australia, China, India, Indonesia, Japan, Malaysia, South Korea, Thailand, Vietnam are covered as segments by Country.
Soft Drink Type
| Energy Shots |
| Natural/Organic Energy Drinks |
| Sugar-free or Low-calories Energy Drinks |
| Traditional Energy Drinks |
| Other Energy Drinks |
Packaging Type
| Glass Bottles |
| Metal Can |
| PET Bottles |
Distribution Channel
| Off-trade | Convenience Stores |
| Online Retail | |
| Supermarket/Hypermarket | |
| Others | |
| On-trade |
Country
| Australia |
| China |
| India |
| Indonesia |
| Japan |
| Malaysia |
| South Korea |
| Thailand |
| Vietnam |
| Rest of Asia-Pacific |
| Soft Drink Type | Energy Shots | |
| Natural/Organic Energy Drinks | ||
| Sugar-free or Low-calories Energy Drinks | ||
| Traditional Energy Drinks | ||
| Other Energy Drinks | ||
| Packaging Type | Glass Bottles | |
| Metal Can | ||
| PET Bottles | ||
| Distribution Channel | Off-trade | Convenience Stores |
| Online Retail | ||
| Supermarket/Hypermarket | ||
| Others | ||
| On-trade | ||
| Country | Australia | |
| China | ||
| India | ||
| Indonesia | ||
| Japan | ||
| Malaysia | ||
| South Korea | ||
| Thailand | ||
| Vietnam | ||
| Rest of Asia-Pacific | ||
Need A Different Region or Segment?
Customize Now
Market Definition
- Carbonated Soft Drinks (CSDs) - Carbonated soft drinks (CSDs) refer to non-alcoholic beverages that are carbonated and typically flavored, containing dissolved carbon dioxide to create effervescence. These beverages commonly include cola, lemon-lime, orange, and various fruit-flavored sodas. Marketed in cans, bottles, or fountain dispense.
- Juices - We have considered packaged juices which encompass non-alcoholic beverages derived from fruits, vegetables, or a combination thereof, processed and sealed in various packaging formats such as bottles, cartons, or pouches. Excluding fresh juices, this market segment involves commercially prepared and preserved juices, often with added preservatives and flavors.
- Ready-to-Drink (RTD) Tea and RTD Coffee - Ready-to-Drink (RTD) tea and RTD coffee are pre-packaged, non-alcoholic beverages that are brewed and prepared for consumption without further dilution. RTD tea typically includes various tea varieties, infused with flavors and sweeteners, and comes in bottles, cans, or cartons. Similarly, RTD coffee involves pre-brewed coffee formulations, often mixed with milk, sugar, or flavorings, and is conveniently packaged for on-the-go consumption.
- Energy Drinks - Energy drinks are non-alcoholic beverages formulated to provide a quick boost of energy and alertness. Whereas, sports drinks are beverages designed to hydrate and replenish electrolytes, particularly after physical exertion, exercise, or intense activity
| Keyword | Definition |
|---|---|
| Carbonated Soft Drinks | Carbonated soft drinks (CSDs) are a combination of carbonated water and flavouring, sweetened by sugar or a non-sugar sweeteners. |
| Standard Cola | Standard Cola is defined as the original flavor of cola soda. |
| Diet Cola | A cola-based soft drink containing no or low amounts of sugar |
| Fruit Flavored Carbonates | A carbonated beverage prepared from fruit juice/fruit flavor with carbonated water and containing sugar, dextrose, invert sugar or liquid glucose either singly or in combination. It may contain peel oil and fruit essences. |
| Juice | Juice is a drink made from the extraction or pressing of the natural liquid contained in fruit and vegetables. |
| 100% Juice | Fruit/vegetable juice made from fruit in the form of its juice with no water added to make up the volume. It is not permitted to add sugars, sweeteners, preservatives, flavourings or colourings to fruit juice. |
| Juice Drinks (up to 24% Juice) | Fruit/vegetable juice drinks with up to 24% fruits/vegetable extract. |
| Nectars (25-99% Juice) | Juices that can have between 25 and 99% of fruit, with the minimum legal limits defined depending on the type of fruit |
| Juice concentrates | Juice Concentrates are those form of juices when most of this liquid is removed resulting in a thick, syrupy product known as juice concentrate. |
| RTD Coffee | Packaged coffee beverages that are sold in a prepared form and are ready for consumption at the time of purchase. |
| Iced Coffee | An iced coffee is a cold version of coffee, usually a combination of hot espresso and milk with ice added to it. |
| Cold Brew Coffee | Cold brew also called cold water extraction or cold pressing is made by steeping ground coffee in room-temperature water for several hours. |
| RTD Tea | Ready-to-drink (RTD) tea is a packaged tea product ready for immediate consumption without brewing or preparation |
| Iced Tea | Ice tea or iced tea is a drink made from tea without milk but with sugar and sometimes fruit flavourings, drunk cold. |
| Green Tea | Green tea is a tea beverage which promotes mental alertness, relieving digestive symptoms and promoting weight loss. |
| Herbal Tea | Herbal tea beverages are made from the infusion or decoction of herbs, spices, or other plant material in hot water. |
| Energy Drink | A type of drink containing stimulant compounds, usually caffeine, which is marketed as providing mental and physical stimulation. They may or may not be carbonated and may also contain sugar, other sweeteners, or herbal extracts, among numerous possible ingredients. |
| Sugar-free or Low-calories Energy Drinks | Sugar-free or Low-calories Energy Drinks are sugar-free, artificially sweetened energy drinks with few or no calories. |
| Traditional Energy Drink | Traditional Energy Drinks are functional soft drinks containing ingredients designed to boost the consumer's energy. |
| Natural/Oraganic Energy Drinks | Natural/Organic energy drinks are energy drinks free of artificial sweeteners and synthetic colorings. Instead, they contain naturally derived ingredients such as green tea, yerba mate, and botanical extracts. |
| Energy Shots | A small but highly concentrated energy drink that contains large amounts of caffeine and/or other stimulants. The quantity is comparatively smaller compared to energy drinks. |
| Sports Drink | Sports drinks are beverages designed specifically for the rapid supply of fluid, carbohydrates, and electrolytes before, during or after exercise. |
| Isotonic | Isotonic drinks contain similar concentrations of salt and sugar as in the human body, and are designed to quickly replace fluids lost during exercise but with an increase of carbohydrate. |
| Hypertonic | Hypertonic drinks have a higher concentration of salt and sugar than the human body. They are best drunk after exercise as it is important to replace glycogen levels quickly after exercise. |
| Hypotonic | Hypotonic drinks are designed to quickly replace fluids lost during exercise. They have very low carbohydrate content and a lower concentration of salt and sugar than the human body. |
| Electrolyte-Enhanced Water | Electrolyte water is water infused with electrically-charged minerals, such as sodium, potassium, calcium, and magnesium. |
| Protein-based Sport Drinks | Protein-based sports drinks are those sports drinks which has added protein in it that will improve performance and reduce muscle protein breakdown. |
| On-Trade | The on-trade refers to places that sell beverages for immediate consumption on the premises like bars, restaurants, and pubs |
| Off-Trade | Off-trade usually means places like liquor stores, supermarkets and other places where you don't consume the beverage right away. |
| Convenience Store | A retail business that provides the public with a convenient location to quickly purchase a wide variety of consumable products and services, generally food and gasoline. |
| Specialty store | A specialty store is a shop/store that carries a deep assortment of brands, styles, or models within a relatively narrow category of goods |
| Online Retail | Online retail is a type of eCommerce whereby a business sells goods or services directly to consumers from a website. |
| Aseptic Packaging | Aseptic packaging refers to the filling of a cold, commercially sterile product under sterile conditions into a presterilized container and closure under sterile conditions to form a seal that effectively excludes microorganisms. These includes tetra packs, cartons, pouches etc. |
| PET Bottle | PET bottle means a bottle made of polyethylene terephthalate. |
| Metal Cans | Metal containers made of aluminum or tin- plated or zinc-plated steel, which are commonly used for packaging food, beverages or other products. |
| Disposable Cups | Disposable Cup means a cup or other container designed for single use to serve beverages, such as water, cold drinks, hot drinks and alcoholic beverages. |
| Gen Z | A way of referring to the group of people who were born in the late 1990s and early 2000s. |
| Millenial | Anyone born between 1981 and 1996 (ages 23 to 38 in 2019) is considered a Millennial |
| Taurine | Taurine is an amino acid that supports immune health and nervous system function. |
| Bars & Pubs | It is a drinking establishment licensed to serve alcoholic drinks for consumption on the premises. |
| Café | It is a foodservice establishment serving refreshments (mainly coffee) and light meals. |
| On the go | It means doing / dealing with while busily engaged with something and not diverting plans in order to accommodate. |
| Internet Penetration | The Internet Penetration Rate corresponds to the percentage of the total population of a given country or region that uses the Internet. |
| Vending Machine | A machine that dispenses small articles such as food, drinks, or cigarettes when a coin or token is inserted |
| Discount store | A discount store or discounter offers a retail format in which products are sold at prices that are in principle lower than an actual or supposed "full retail price". Discounters rely on bulk purchasing and efficient distribution to keep down costs. |
| Clean Label | Clean label on the beverage market are drinks that are made from few ingredients of natural origin and are not or only slightly processed. |
| Caffeine | An alkaloid compound which is a stimulant of the central nervous system. It is mainly used recreationally, as a mild cognitive enhancer to increase alertness and attentional performance. |
| Extreme sport | Action sports, adventure sports or extreme sports are activities perceived as involving a high degree of risk. |
| High-intensity interval training | It incorporates several rounds that alternate between several minutes of high intensity movements to significantly increase the heart rate to at least 80% of one's maximum heart rate, followed by short periods of lower intensity movements. |
| Shelf life | The length of time for which an item remains usable, fit for consumption, or saleable. |
| Cream Soda | Cream soda is a sweet soft drink. Generally flavored with vanilla and based on the taste of an ice cream float |
| Root Beer | Root beer is a sweet North American soft drink traditionally made using the root bark of the sassafras tree Sassafras albidum or the vine of Smilax ornata as the primary flavor. Root beer is typically, but not exclusively, non-alcoholic, caffeine-free, sweet, and carbonated. |
| Vanilla Soda | A carbonated soft drink flavoured with vanilla. |
| Dairy-Free | A product that does not contain any milk or milk products from cows, sheep or goats. |
| Caffeine-Free Energy Drinks | Caffeine-free energy drinks rely on other ingredients to boost the energy. Popular choices include amino acids, B vitamins, and electrolytes. |
Need More Details on Market Definition?
Ask a Question
Research Methodology
Mordor Intelligence follows a four-step methodology in all our reports.
- Step-1: IDENTIFY KEY VARIABLES: In order to build a robust forecasting methodology, the variables and factors identified in Step 1 are tested against available historical market numbers. Through an iterative process, the variables required for market forecast are set, and the model is built on the basis of these variables.
- Step-2: Build a Market Model: Market-size estimations for the forecast years are in nominal terms. Inflation is not a part of the pricing, and the average selling price (ASP) is kept constant throughout the forecast period for each country.
- Step-3: Validate and Finalize: In this important step, all market numbers, variables, and analyst calls are validated through an extensive network of primary research experts from the market studied. The respondents are selected across levels and functions to generate a holistic picture of the market studied.
- Step-4: Research Outputs: Syndicated reports, custom consulting assignments, databases & subscription platforms

Get More Details On Research Methodology
Download PDF


