
Market Overview
| Study Period | 2020 - 2031 |
|---|---|
| Forecast Data Period | 2026 - 2031 |
| Base Year Market Size (2025) | USD 25.95 Billion |
| Market Size (2026) | USD 27.19 Billion |
| Market Size (2031) | USD 34.33 Billion |
| Growth Rate (2026 - 2031) | 4.78% CAGR |
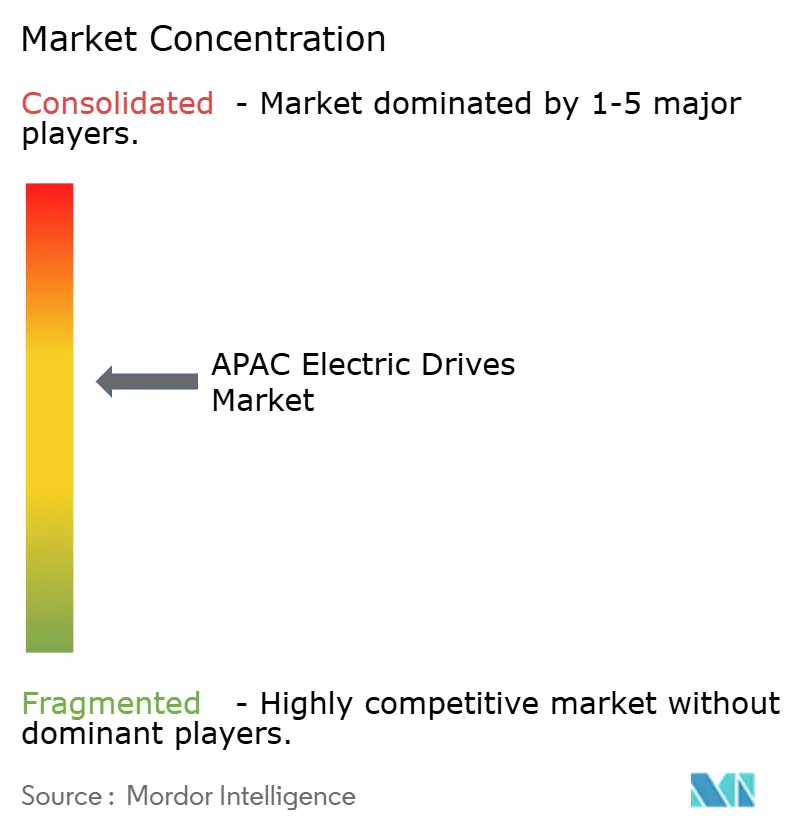
| Market Concentration | Medium |
Major Players *Disclaimer: Major Players sorted in no particular order Image © Mordor Intelligence. Reuse requires attribution under CC BY 4.0. | |
Asia-Pacific Electric Drives Market Analysis by Mordor Intelligence
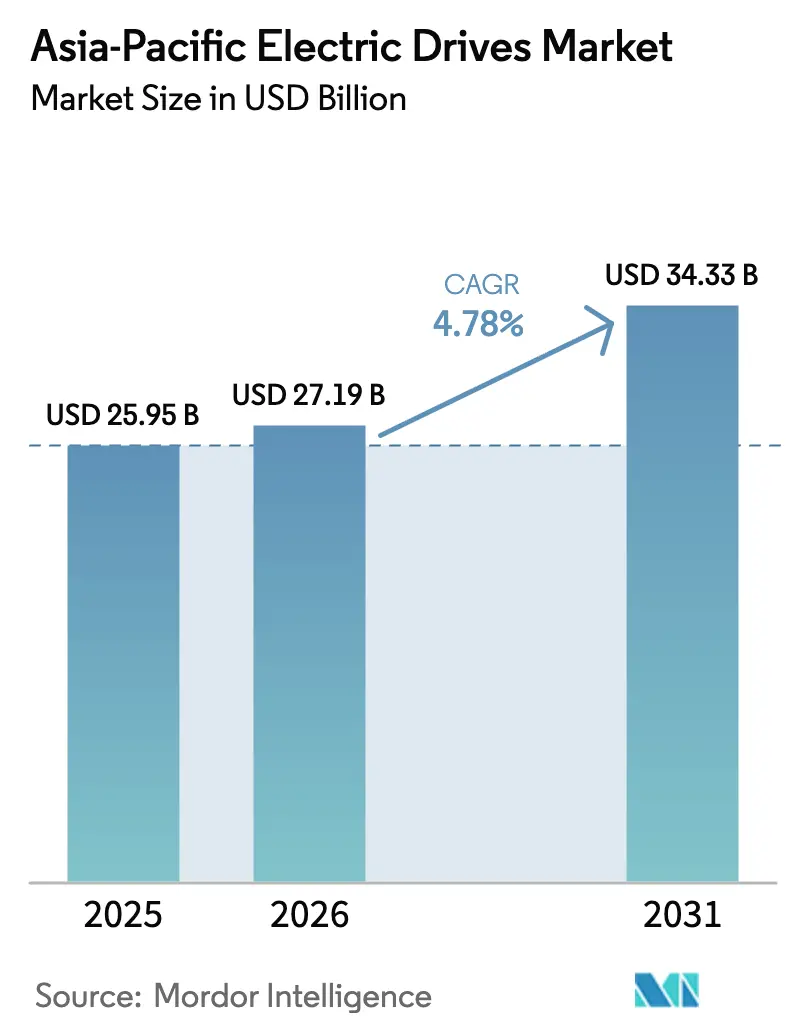
The APAC electric drives market size was valued at USD 25.95 billion in 2025 and estimated to grow from USD 27.19 billion in 2026 to reach USD 34.33 billion by 2031, at a CAGR of 4.78% during the forecast period (2026-2031). Demand is moving from basic motion control toward precision-engineered automation as factories digitize and regulators tighten energy-efficiency rules. Large-scale electrification projects in process industries, together with widespread HVAC upgrades in commercial real-estate, underpin a steady replacement cycle for variable-speed drives. Silicon-carbide power devices, once confined to niche aerospace programs, are being designed into mass-market drive platforms, trimming switching losses and shrinking cabinet footprints. Supply-chain risk around rare-earth magnets has prompted many firms to dual-source permanent-magnet machines and revisit induction-motor designs, an adjustment that tempers price volatility without slowing overall market adoption.
Key Report Takeaways
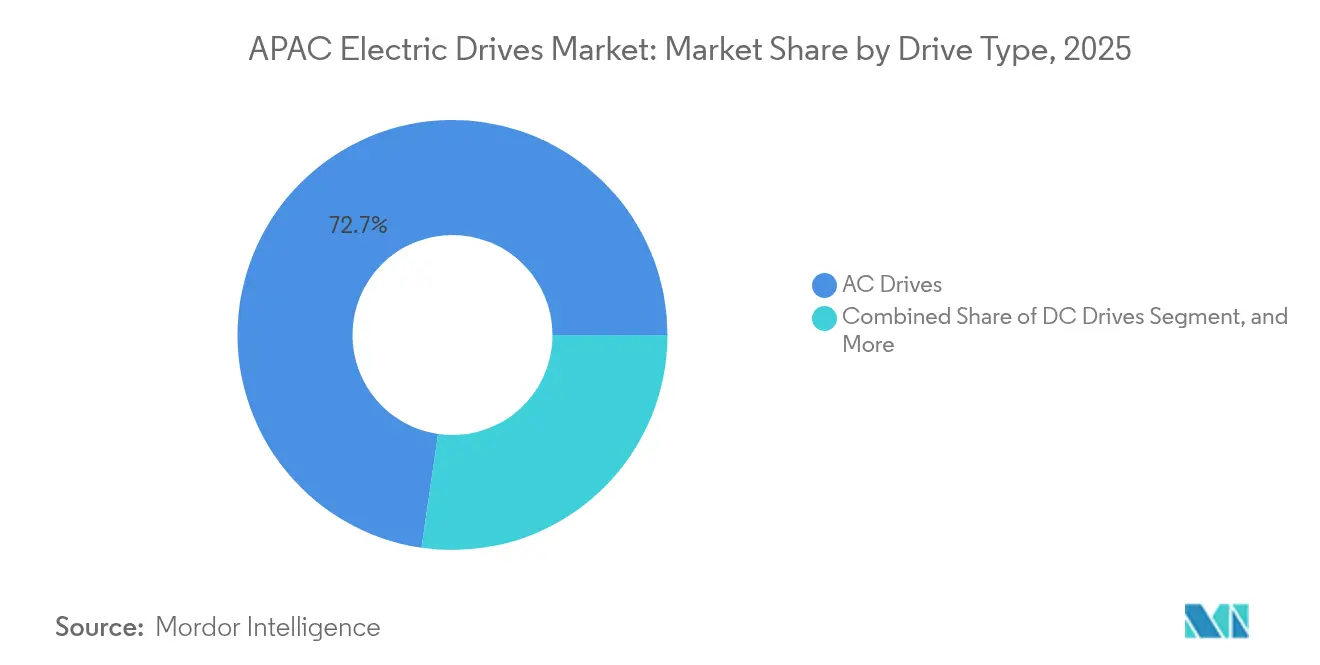
- By drive type, AC drives led with 72.70% revenue share in 2025, while servo drives are projected to post the fastest 7.80% CAGR through 2031.
- By voltage class, low-voltage units (<1 kV) accounted for 65.40% of 2025 sales; medium-voltage drives (1-36 kV) are expected to expand at a 6.68% CAGR to 2031.
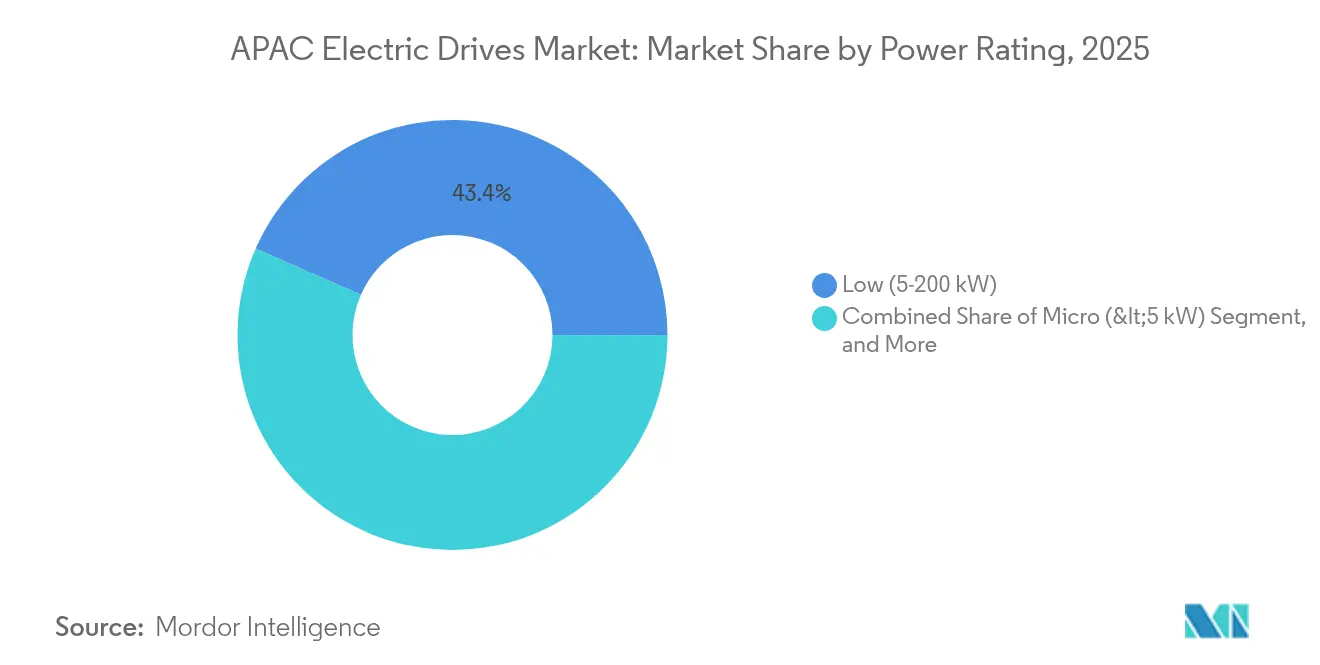
- By power rating, the 5-200 kW segment held 43.40% of the APAC electric drives market share in 2025, whereas drives above 1 MW are forecast to grow at 8.13% CAGR.
- By end-user industry, oil & gas captured 23.50% of 2025 revenue, while water & wastewater treatment is set to record a 7.14% CAGR through 2031.
- By geography, China dominated with 54.50% of 2025 revenue; India is the fastest-growing market at 6.15% CAGR through 2031.
Note: Market size and forecast figures in this report are generated using Mordor Intelligence’s proprietary estimation framework, updated with the latest available data and insights as of 2026.
Asia-Pacific Electric Drives Market Trends and Insights
Drivers Impact Analysis*
| Driver | (~) % Impact on CAGR Forecast | Geographic Relevance | Impact Timeline |
|---|---|---|---|
| Rapid automation across discrete and process industries | +1.2% | China, India, Japan, South Korea | Medium term (2-4 years) |
| Regulatory pressure for IE4+ motors and drive retrofits | +0.8% | Japan, Australia, South Korea | Short term (≤ 2 years) |
| Surging HVAC adoption in commercial real-estate | +0.6% | China, India, ASEAN | Medium term (2-4 years) |
| Green hydrogen electrolyzer build-out needs precision drives | +0.4% | Japan, Australia, South Korea | Long term (≥ 4 years) |
| ASEAN state subsidies for servo-driven packaging lines | +0.3% | Thailand, Vietnam, Malaysia | Short term (≤ 2 years) |
| Grid-interactive buildings deploying VFD-based demand response | +0.2% | Japan, South Korea, Singapore | Medium term (2-4 years) |
| Source: Mordor Intelligence | |||
Rapid Automation Across Discrete and Process Industries
Tight labor markets, especially in coastal China, South Korea, and parts of Japan, are accelerating investment in fully automated “lights-out” facilities that rely on high-speed servo systems for pick-and-place, palletizing and quality-inspection tasks. Semiconductor plant expansions in western Japan and advanced packaging lines in Taiwan require nanometer-level positioning accuracy, fueling demand for digitally networked servo drives with gigahertz-class control loops. Process plants in chemicals and petrochemicals are modernizing older induction-motor starters with variable-frequency drives (VFDs) that trim energy use by up to 30%, an imperative as commodity margins stay thin. Variable-speed pump control in India’s growing fertilizer industry illustrates how even legacy facilities can capture quick wins on electricity cost without major civil work. Although inventory corrections dampened Japanese vendor shipments in late 2024, purchase orders from ASEAN producers of consumer electronics have since stabilized the book-to-bill ratio at above 1.05, signaling continued capital-equipment momentum.[1]Yaskawa Electric, “FY2024 1st Half Financial Results,” yaskawa-global.com
Regulatory Pressure for IE4+ Motors and Drive Retrofits
Successive rounds of minimum-efficiency legislation tighten the screws on installed motors across the region. Japan’s Top Runner Program demands 11.4% efficiency gains in distribution transformers by 2027, pushing facility managers to pair IE4 motors with new drives capable of synchronous-reluctance or permanent-magnet control. Export-oriented manufacturers in Vietnam and Thailand pre-emptively comply with European IE4 mandates on 75-200 kW motors to avoid re-certification costs, making high-efficiency drives a ticket to retain market access. Australia and New Zealand’s MEPS program, refreshed in 2025, tips purchasing models toward silicon-carbide-based drives that breach the 98% efficiency threshold.[2]Eaton, “Energy-Efficiency Classes Variable-Speed Drives,” eaton.com
Surging HVAC Adoption in Commercial Real-Estate
Commercial real-estate pipelines in Bengaluru, Ho Chi Minh City and Shenzhen continue to deliver floor space that must meet tougher building-performance benchmarks. Developers specify smart HVAC architectures where VFD-enabled chillers and air-handling units talk directly to building-management systems, enabling demand-response participation with local grid operators. Field data from multi-source heat-pump installations show 20% lower energy use in cooling mode and 14% in heating when compared with fixed-speed solutions, savings magnified by photovoltaic-thermal integration that slashes primary energy by 70%. Precision cooling for hyperscale data centers in Singapore and Jakarta, whose rack densities exceed 15 kW, requires redundancy arrays of quick-response drives to maintain thermal set-points within ±1 °C, making low-harmonic performance and ride-through capability critical selection criteria.
Green-Hydrogen Electrolyzer Build-Out Needs Precision Drives
Japan’s hydrogen roadmap targets 3 million t/y supply by 2030, triggering procurement of megawatt-scale polymer-electrolyte and alkaline electrolyzers. Electrolysis stacks work best when compressors and circulation pumps modulate dynamically with renewable power input, a task suited to closed-loop VFDs with millisecond-class torque response. Rotational-state control algorithms boost hydrogen output by 10.73% compared with fixed-speed setups, according to recent hybrid-electrolyzer studies. Seawater electrolyzer prototypes now clock 10,000-hour lifespan at 0.5 A/cm², prompting Australian project developers to specify drive platforms built for start-stop cycling that aligns with solar irradiance.[3]Nature, “10,000-h-Stable Intermittent Alkaline Seawater Electrolysis,” nature.com
Restraints Impact Analysis*
| Restraint | (~) % Impact on CAGR Forecast | Geographic Relevance | Impact Timeline |
|---|---|---|---|
| High capex and integration cost for medium-voltage drives | -0.9% | China, India, ASEAN | Medium term (2-4 years) |
| Skilled-labour shortages for commissioning and maintenance | -0.6% | India, ASEAN, Australia | Long term (≥ 4 years) |
| Persistent voltage-quality issues in CLMV grids | -0.4% | Cambodia, Laos, Myanmar, Vietnam | Medium term (2-4 years) |
| Trade-policy risk on rare-earth magnets for PM drives | -0.3% | Global, concentrated impact on India, Japan | Short term (≤ 2 years) |
| Source: Mordor Intelligence | |||
High Capex and Integration Cost for Medium-Voltage Drives
Total installed cost for a 6.6 kV, 2 MW VFD can exceed equipment price by 50% once switchgear, step-down transformers and harmonic filters are added. Small and mid-size Asian manufacturers, often operating on thin margins, defer such upgrades until asset lifetimes stretch beyond twenty years. Exchange-rate volatility in Indonesia and Malaysia balloons financing costs for imported medium-voltage hardware, forcing buyers to negotiate long-tenor supplier credit lines. Rockwell Automation’s sync-transfer technology partially offsets sticker shock by letting one drive control multiple motors, slashing capex by roughly 50%. Still, scarcity of certified engineers makes many operators hesitant to embark on complex retrofits, restraining volume growth in this slice of the APAC electric drives market.
Skilled-Labour Shortages for Commissioning and Maintenance
Drive-system commissioning requires expertise in power electronics, fieldbus networks and motor tuning—skills not yet commonplace among electricians trained on legacy starters. ASEAN governments invest in vocational retraining, but annual graduate output lags industry demand by a factor of three. Predictive-maintenance features embedded in premium drives generate actionable alerts, yet plants struggle to hire data analysts who can translate vibration harmonics into maintenance work orders. Yaskawa’s i3-Mechatronics platform aims to shrink skill barriers by offering auto-tuning and cloud-based diagnostics, but complex motion sequences still need domain specialists during acceptance testing.
*Our forecasts treat driver/restraint impacts as directional, not additive. The impact forecasts reflect baseline growth, mix effects, and variable interactions.
Segment Analysis
By Drive Type: AC Dominance with Servo Upswing
AC drives generated 72.70% of 2025 revenue and remain the workhorse across pumps, fans and conveyors where cost and reliability trump pinpoint accuracy. Price erosion over the past five years keeps average selling prices nearly 18% below 2019 levels, helping the APAC electric drives market penetrate SME users. Servo drives, although smaller in absolute dollars, will clock a 7.80% CAGR through 2031 on the back of pick-and-place robotics, electronic assembly and 3-D printing lines that demand sub-millisecond speed response. This micro-segment benefits from integration with EtherCAT and Time-Sensitive Networking, features not generally required by bulk-handling applications.
Servo uptake also reflects growing on-machine intelligence: feedback-rich encoders feed real-time position data to digital twins, slashing commissioning time by 30% in new robotic cells. Meanwhile, permanent-magnet drives exploit high torque density to gain share in elevator hoists and commercial HVAC, although supply-chain vulnerability constrains faster substitution. Collectively, precision motion segments keep the APAC electric drives market on a technology-innovation footing despite price pressures in commodity vector control.


By Voltage Class: Low-Voltage Prevalence, Mid-Voltage Momentum
Low-voltage drives below 1 kV captured 65.40% revenue in 2025, reflecting the ubiquity of 380–415 V utility feeds across Asian factories. Commodity HVAC and water-treatment installations account for most volume, aided by standardized IP55 enclosures and plug-and-play fieldbus adapters that trim installation cost. The APAC electric drives market size for medium-voltage (1–36 kV) equipment is forecast to expand at 6.68% CAGR as miners, refiners and LNG liquefaction plants seek megawatt-class energy savings.
Manufacturers are narrowing the feature gap: integrated cell-stack architectures reduce harmonic distortion to below 2.3% THDi without external filters, making MV drives attractive even for brownfield retrofits. At the opposite end, micro-drives under 2 kW adopt single-chip inverter ICs, shaving PCB count by 40% and enabling fan-less cooling for food-processing lines with sanitary washdown requirements. As semiconductor fabs upgrade from 415 V to 690 V power distribution to cut copper losses, low-voltage platforms inch upward in rating, muddying traditional voltage-class boundaries while enlarging the addressable APAC electric drives market.
By Power Rating: Mid-Range Core with High-Power Horizon
The 5-200 kW band, responsible for 43.40% of 2025 sales, remains the sweet spot: it covers irrigation pumps in India’s agri-corridors, conveyor drives in Indonesian nickel mines and extruders in Chinese plastics plants. Off-the-shelf harmonics compliance and ready availability of spare parts keep total cost of ownership low, reinforcing installed base stickiness. Drives above 1 MW, set to grow 8.13% CAGR, are riding a wave of industrial electrification as heavy-duty compressor stations, rolling mills and desalination plants shift from diesel or steam turbines to electric drives for carbon-footprint reduction.
Developers of offshore wind support vessels, for example, specify 3–5 MW hybrid-propulsion systems using water-cooled VFDs to meet zero-emission port-call rules. At the micro end, sub-5 kW modules embed wireless commissioning tools, allowing start-up via smartphones—a productivity feature that resonates with service contractors facing labor shortages. Growth across the power spectrum underscores how the APAC electric drives market adapts to diverse infrastructure needs without ceding volume to alternative motion technologies.
By End-User Industry: Oil & Gas Command, Water Treatment Upscale
Oil & gas absorbed 23.50% of 2025 revenue, leveraging VFDs to optimize pump pressure in upstream fields and to modulate compressor trains in LNG re-gas terminals. Process engineers credit digital torque control with shaving 8–12% energy use in mature onshore assets, gains that drop straight to the bottom line at USD 70/bbl pricing. Water & wastewater treatment, advancing at 7.14% CAGR, benefits from public investment in desalination plants and sewage upgrade programs from Queensland to Gujarat. Variable-speed blowers in activated-sludge aeration, for instance, cut electricity consumption by up to 45% versus fixed-speed systems and qualify for green-utility tariffs.
Food & beverage processors deploy servo-driven augers and slicing machines for portion-controlled packaging, while chemical plants favor VFDs equipped with conformal-coated boards that survive aggressive atmospheres. Power-generation utilities increasingly install drives on ID/FD fans to balance boiler draft, a retrofit action that can free 1–2 % plant-wide efficiency—significant in carbon-price regimes. Each use case reinforces the diversification of the APAC electric drives market, buffering cyclical downturns in any single vertical.
Geography Analysis
China commanded 54.50% of 2025 revenue, a scale advantage rooted in extensive domestic component supply, state-backed smart-manufacturing grants and the world’s largest renewable-energy build-out. Nevertheless, export-oriented OEMs face rising scrutiny over geopolitical risk, nudging multi-nationals to adopt a “China-plus-one” sourcing model that dilutes future share. Siemens reported an 8% year-on-year revenue dip in its China digital-industries unit in 2024 even as local automation capex stayed firm, illustrating margin pressure from local contenders.
India, projected to expand at 6.15% CAGR through 2031, is buoyed by lower landed-cost structures and a USD 2.75 billion production-linked incentive to localize electronics components. Rapid EV adoption—EV share doubled to 4.4% in May 2025—drives auxiliary inverter demand across traction and charging infrastructure. Yet India’s 93% dependency on Chinese rare-earth inputs for permanent-magnet machines remains a strategic wildcard.
Japan and South Korea form a mature high-value corridor centered on semiconductor, robotics and shipbuilding verticals. Japan’s Top Runner framework pushes systematic retrofits, pushing domestic drive makers to bundle motors and digital services to extract incremental revenue. South Korean yards, designing all-electric LNG carriers, specify high-power VFDs to meet forthcoming IMO decarbonization rules, reinforcing local demand for megawatt-scale modules. Australia and New Zealand focus on mining and infrastructure electrification; meanwhile, ASEAN’s CLMV economies wrestle with grid-quality constraints but still attract packaging OEM investments thanks to labor-cost advantages.
Regulatory Landscape
Energy-efficiency and localization rules across APAC are shaping electric drive specifications and compliance pathways. India is tightening both building and e-mobility requirements. The 2026 Energy Conservation Building Code (ECBC) includes provisions that push higher-efficiency motors (IE3 or above) and the use of variable speed drives for new high-load commercial buildings. The Ministry of Heavy Industries issued phased manufacturing programme (PMP) updates in March 2026 for N2 and N3 electric trucks, and followed with an April 2026 notification that ties truck subsidy eligibility to domestic manufacturing of key electronics (including BMS, DC-DC converters, and VCUs) from September 1, 2026.
Southeast Asia and Northeast Asia add further standard-setting pressure on motors and connected automation. Thailand brought into force its Ministry of Industry regulation on industrial standards compliance for three-phase induction AC motors effective April 17, 2026, increasing the emphasis on certified motor-drive pairings for importers and local assemblers. In South Korea, the Korea Agency for Technology and Standards (KATS) taking the secretariat role for IEC smart manufacturing standardization work (SC65F) in July 2026 reinforces momentum toward interoperable, data-connected factories. That shift affects how drive suppliers approach communications, cybersecurity, and digital-twin readiness alongside energy performance.
Value Chain Analysis
The APAC electric drives value chain runs from power semiconductors (IGBT and increasingly SiC), passive components, and control electronics, to electromechanical subsystems (motors, gearboxes, encoders) through drive OEM design and assembly, panel builders and system integrators, and distribution to end users in process industries, discrete manufacturing, HVAC and buildings, and infrastructure. Tier-1 suppliers (global conglomerates and leading Japanese vendors) typically manage firmware, functional safety, and application libraries in-house, while Tier-2 ecosystems supply enclosures, filters, cooling, and fieldbus modules. After-sales service, spares, and retrofit engineering are key value capture points given the long installed base in pumps, fans, compressors, and conveyors.
Two supply-side constraints highlighted in the market context are driving procurement and design choices: rare-earth magnet exposure for permanent-magnet machines and wide-bandgap device capacity for next-generation high-efficiency drives. That dynamic is pushing dual-sourcing of motor technologies, including renewed interest in induction and synchronous-reluctance solutions, along with a stronger focus on localized component supply where feasible, particularly in India and parts of ASEAN. Industrial localization efforts in the broader electrification ecosystem also reinforce downstream demand for drive systems and controls, illustrated by Nidec’s October 2024 supply partnership with Ashok Leyland in India for electric motor-controller systems and Toyota Motor Manufacturing Indonesia’s September 2025 partnership with CATL to localize hybrid battery production in Karawang.
Competitive Landscape
European and Japanese conglomerates dominate but face intensifying competition from cost-optimized Chinese brands. ABB’s Motion division posted USD 32.2 billion in 2024 sales, up 9%, leveraging energy-efficient SynRM motors tightly paired with drives to lock in aftermarket parts. Siemens closed a USD 10 billion acquisition of Altair Engineering in March 2025, folding finite-element and AI-driven simulation into its drive-selection workflow, a move that shortens design cycles and embeds Siemens gear at the digital-twin stage.
Mitsubishi Electric is investing USD 500 million to secure silicon-carbide wafer supply, aiming for an 8% operating margin in its power-devices unit and de-risking long-term sourcing for its vertically integrated drives. Rockwell Automation differentiates via TotalFORCE predictive analytics that auto-tune drive parameters and issue health alerts, reducing downtime for high-speed bottling lines. Yaskawa and Delta Electronics leverage local manufacturing to keep lead times under six weeks for custom panel builds, enticing OEMs with fast-track delivery.
Patent filings in wide-bandgap semiconductors from 2023 to 2025 doubled compared with the prior triennium, signaling a technological arms race. Regional specialists such as Inovance Technology bundle condition-monitoring gateways that feed data into Alibaba Cloud, forging an ecosystem play aimed at China’s mid-tier machinery builders. Moderate market concentration persists because Tier-1 vendors lock in service contracts for mission-critical installations, while Tier-2 brands undercut on price in commoditized segments. This stratification allows the APAC electric drives market to absorb new entrants without destabilizing incumbent share.
Asia-Pacific Electric Drives Industry Leaders
Nidec Corporation
Danfoss A/S
Rockwell Automation Inc.
Schneider Electric SE
TMEIC Corporation
- *Disclaimer: Major Players sorted in no particular order

Market Opportunities and Future Outlook
Compliance-led retrofits and localization programs are expanding whitespace for drive suppliers that can certify across multiple jurisdictions while maintaining local supply. India’s ECBC 2026 provisions that promote high-efficiency motors and variable speed drives in new high-load commercial buildings create a clear channel for HVAC and building-services VFD packages bundled with commissioning tools and power-quality features. In e-mobility-adjacent manufacturing, India’s March to April 2026 PMP and localization notifications for electric trucks, with subsidy eligibility linked to domestically made control electronics from September 1, 2026, reinforce opportunities for locally produced motor-control electronics, test services, and application engineering. These changes can shorten qualification cycles for OEMs and Tier-1s.
On the supply side, active capacity investments and digitalization moves by major vendors support adoption of higher-value drive platforms that integrate software and lifecycle services. In July 2026, ABB committed about USD 75 million toward manufacturing and R&D expansion in India focused on low-voltage drives and specialized industrial motors. Schneider Electric increased capex for its Kolkata medium-voltage components facility to reach 250,000 units annual capacity (MV vacuum interrupters), improving regional availability for MV drive installations tied to industrial power systems. Japan’s METI launched Smart Factory 2026 import subsidy actions aimed at accelerating digital manufacturing equipment procurement. Vietnam’s 2026-2035 supporting-industry program prioritizes automation and smart electronics, creating whitespace for suppliers that can localize assemblies, train commissioning talent, and provide digital connectivity stacks (drives plus analytics) for factories modernizing beyond basic motion control.
Recent Industry Developments
- July 2026: Schneider Electric Infrastructure approved increasing capital expenditure for its Kolkata Medium Voltage Components facility to INR 184 crore, with plans that reference scaling output to 250,000 units annually and adding related mechanism assembly capability. The expansion strengthens local availability of medium-voltage components that sit upstream of MV drive deployments in industrial power systems, supporting faster project execution and reducing dependency on imported subassemblies.
- June 2026: Schneider Electric entered a definitive agreement to acquire Cognite Holding B.V. for USD 3.1 billion in an all-cash transaction. Bringing industrial data and AI software deeper into Schneider Electric’s Industrial Automation portfolio accelerates the convergence of connected drives, asset analytics, and digital-twin workflows that end users increasingly specify in modernization projects.
- April 2026: Nidec Drive Technology opened a new press machine assembly factory in Ritto, Shiga Prefecture, Japan, doubling production capacity from 60 to 120 units per year. Higher in-region capacity for production equipment supports motor and drive manufacturing throughput, improving lead times for OEM supply chains that are tightening around automation and electrification programs.


Research Methodology Framework and Report Scope
Market Definition and Coverage
For this study, the Asia-Pacific electric drives market is defined as the revenue generated from electric drive systems used to control motor speed, torque, and motion in industrial and building applications across APAC, reported in USD.
Scope exclusions: We exclude upstream motor-only sales, general electrical components that are not sold as drive systems, and pure maintenance labor that is not bundled with a drive sale.
Segmentation Overview
- By Drive Type
- AC Drives
- DC Drives
- Servo Drives
- Permanent-Magnet Drives
- By Voltage Class
- Low Voltage (<1 kV)
- Medium Voltage (1–36 kV)
- High Voltage (>36 kV)
- By Power Rating
- Micro (<5 kW)
- Low (5–200 kW)
- Medium (200 kW–1 MW)
- High (>1 MW)
- By End-user Industry
- Oil and Gas
- Chemical and Petrochemical
- Food and Beverage
- Water and Wastewater
- Power Generation
- Metals and Mining
- Pulp and Paper
- HVAC and Building Services
- Discrete Manufacturing
- Other Industries
- By Country
- China
- India
- Japan
- South Korea
- Australia and New Zealand
- Rest of Asia-Pacific
Data Sources, Market Sizing, and Validation
Desk Research
Desk research was first used to map where electric drives are commonly installed across APAC, and to understand how demand moves with industrial output and energy-efficiency rules. We relied on public sources such as IEA energy efficiency and electricity use indicators, UN Comtrade trade flows for electrical equipment, national statistics agencies in China, India, Japan, and South Korea for industrial production and manufacturing value-add, and government energy ministries for policy and efficiency programs.
We also reviewed manufacturer annual reports, investor presentations, and technical literature in journals and standards publications (including IEC-related materials) to anchor typical drive replacement cycles, voltage class usage, and adoption drivers in process industries. To avoid missing smaller suppliers and import-led channels, we complemented this with paid subscriptions for company financials and news intelligence, plus shipment-level import and export databases where available for electrical machinery categories. The sources listed above are illustrative, and many other public and paid references were used during data collection, cross-checking, and clarification.
Primary Interviews and Surveys
Primary work was run in parallel to confirm what portion of drive demand is tied to new projects versus replacements, and how pricing differs by voltage class and end-user industry. We spoke with a mix of drive suppliers, distributors, and system integrators, plus plant engineering teams, procurement functions, and maintenance roles across major APAC countries. Follow-up calls were then used to close gaps where desk inputs were inconsistent.
Distribution of primary research fieldwork respondents
| Company type | Respondent position | Region |
|---|---|---|
| Top tier: 32% | CXOs: 12% | |
| Mid tier: 49% | Functional/Unit leaders: 29% | |
| Smaller Players: 19% | Managers: 59% |
Market-Sizing & Forecasting
Sizing starts with a top-down build that reconstructs the demand pool from APAC industrial activity and equipment investment patterns, then filters it through drive adoption by end-user industry and voltage class. To keep the totals realistic, we corroborated the output with selective bottom-up checks such as sampled ASP x shipment volume for common drive categories, plus channel checks on project-led orders versus replacement demand.
Key inputs used in the model include industrial production growth in large manufacturing economies, the pace of automation investments in discrete industries, energy-efficiency program intensity that supports variable speed adoption, installed base replacement cycles for motors and drives in process industries, and mix shifts between low and medium voltage drives. When data was thin for smaller countries, we used proxy indicators like manufacturing value-add and import intensity to avoid overstating local production.
For forecasting, scenario analysis was applied around industrial capex and energy costs, then stabilized using exponential smoothing on historical demand signals where the series was noisy. Assumptions such as ASP movement and the split between new build and retrofit were reviewed with interview inputs and adjusted when the implied growth path conflicted with known capacity additions and project pipelines.
Data Validation & Update Cycle
Outputs are validated by comparing the model result against independent signals such as trade flows for relevant electrical equipment categories, plant expansion announcements, and the pace of industrial electrification in key sectors. Outliers are flagged country by country, and the drivers are rechecked before the numbers move to sign-off, which helps prevent one strong country trend from being incorrectly applied across the full region.
We refresh the report annually, and interim updates are made when there are material changes such as sharp currency swings, major policy changes tied to efficiency, or unexpected shifts in industrial output. Before delivery, a final review pass is completed so clients receive the latest view that can still be traced back to clear inputs and documented assumptions.
Mordor Intelligence's Asia Pacific Electric Drives Market Size Compared With Other Published Estimates
Published market values for electric drives in APAC can differ even when they appear to cover the same scope, because the underlying counting rules and inclusions are not always aligned. Differences usually come from what is included as a drive system, whether motor-only revenue is mixed in, and how currency timing and inflation are treated.
In APAC specifically, the biggest swings often come from whether servo and low-voltage drives used in discrete automation are counted alongside process-industry drives, and whether the model uses an installed-base replacement lens versus only new project additions. The table points to this scope and weighting issue, where motor-only and broader motion components are screened out and the country totals are tied to end-user adoption factors and voltage mix, a modeling choice applied by Mordor Intelligence.
Benchmark comparison
| Source | Market Size | Gaps in Research Methodology |
|---|---|---|
| Mordor Intelligence | USD 27.19 B (2026) | |
| Industry Portal A | USD 9.48 B (2025) | Uses a narrower definition that appears closer to low-voltage drives only, with limited weighting for medium-voltage demand in power generation, metals, and other heavy process users across APAC. |
| Regional Consultancy B | USD 10.40 B (2026) | Focuses on low-voltage drives and technology subtypes, and the total seems to exclude several end-user pools (such as oil and gas and mining) and parts of the replacement cycle. |
Across publishers, the spread is mainly explained by whether the estimate is a low-voltage subset or a wider electric drives total that also reflects medium-voltage and process-industry usage. By keeping inclusion rules consistent across countries and validating the demand mix with adoption and replacement signals, our number stays easier to reproduce and to audit during planning discussions.


Key Questions Answered in the Report
What is the current value of the APAC electric drives market?
The market is worth USD 27.19 billion in 2026 and is projected to reach USD 34.33 billion by 2031 at a 4.78% CAGR.
Which drive type is growing the fastest?
Servo drives are anticipated to record a 7.80% CAGR through 2031, outpacing other categories.
Why are medium-voltage drives gaining attention despite high cost?
Energy-intensive sectors such as LNG, mining and metals require megawatt-class efficiency gains, and new architectures now reduce harmonics without bulky filters, making upgrade economics more attractive.
How does rare-earth supply risk affect drive selection?
Dependence on Chinese neodymium threatens permanent-magnet motor pricing; some operators pivot to induction or synchronous-reluctance designs to hedge supply volatility.
What role do silicon-carbide devices play in future drives?
SiC power modules slash switching losses and allow higher operating temperatures, enabling smaller, more efficient drives across voltage classes, a capability already drawing USD 500 million in new investment from Mitsubishi Electric.
Which country offers the highest growth potential?
India, expanding at 6.15% CAGR through 2031, combines cost-competitive manufacturing with policy incentives that favor local production of drive components.
Page last updated on:






