Asia-Pacific Electric Bus Battery Pack Market Size and Share
Market Overview
| Study Period | 2017 - 2029 |
|---|---|
| Base Year For Estimation | 2024 |
| Forecast Data Period | 2025 - 2029 |
| Market Size (2025) | USD 4.9 Billion |
| Market Size (2029) | USD 6.53 Billion |
| Growth Rate (2025 - 2029) | 7.44% CAGR |
| Market Concentration | Medium |
Major Players*Disclaimer: Major Players sorted in no particular order Image © Mordor Intelligence. Reuse requires attribution under CC BY 4.0. | |

Asia-Pacific Electric Bus Battery Pack Market Analysis by Mordor Intelligence
The Asia-Pacific Electric Bus Battery Pack Market size is estimated at 4.9 billion USD in 2025, and is expected to reach 6.53 billion USD by 2029, growing at a CAGR of 7.44% during the forecast period (2025-2029).
The Asia-Pacific electric bus battery pack industry is experiencing transformative growth driven by technological advancements and evolving market dynamics. Major industry players are strategically expanding their manufacturing capabilities to meet the rising demand, with companies like BYD leading the market transformation. In March 2023, BYD announced the construction of a new bus assembly and battery manufacturing plant in Indonesia, demonstrating the industry's commitment to regional expansion. The industry has witnessed significant consolidation, with established manufacturers holding substantial market positions. Notably, BYD secured a 20.93% market share of EV sales in the APAC region in 2022, highlighting the market's competitive landscape.
Battery technology innovation continues to shape the industry landscape, with manufacturers focusing on developing more efficient and sustainable solutions. Prismatic batteries have emerged as the dominant technology choice, accounting for approximately 87% market share in 2022, owing to their superior energy density and cost-effectiveness. The industry has seen substantial improvements in battery chemistry and material composition, with cobalt maintaining a significant 57.27% value share in battery materials during 2022, reflecting the ongoing importance of traditional materials while manufacturers explore alternative compositions.
Infrastructure development and manufacturing capacity expansion are becoming increasingly crucial for market growth. Countries across the region are announcing ambitious plans for bus electrification, with Thailand announcing plans to deploy 8,000 electric buses by 2025. This regional expansion is supported by the establishment of new manufacturing facilities and the development of supporting infrastructure, creating a robust ecosystem for the electric bus battery pack market. The industry is witnessing a shift towards localized production, with over 90% of battery demand being met by Chinese manufacturers in 2022, though other countries are rapidly developing their manufacturing capabilities.
The market is experiencing a notable shift towards sustainable and efficient battery technologies, with manufacturers investing heavily in research and development. Advanced battery management systems, improved thermal management solutions, and enhanced safety features are becoming standard offerings in the market. The industry is witnessing increased collaboration between battery manufacturers and electric bus producers, leading to more integrated and efficient solutions. This integration is particularly evident in the development of customized battery pack solutions that address specific regional requirements and operating conditions, contributing to improved overall system performance and reliability.
Asia-Pacific Electric Bus Battery Pack Market Trends and Insights
A VARIETY OF AUTOMAKERS ARE PRESENT IN THE MARKET, MAJORLY DRIVEN BY TOYOTA, TESLA, AND WULING
- The APAC electric vehicle market is bustling with numerous competitors, but its momentum is chiefly steered by five dominant corporations, collectively grasping over 50% of the 2022 market share. Leading the charge is BYD, securing a remarkable 20.93% of EV sales in the region. Its potent financial standing, coupled with its advanced R&D infrastructure, has positioned BYD as a powerhouse. The company's competitive pricing, coupled with its vast sales and after-sales network, effectively appeals to new consumers.
- Following BYD, the Toyota Group clinches the second spot, with about 12.88% of the market. Its well-established reputation across the APAC region, bolstered by its extensive sales and service framework, instills trust among consumers, further cementing its footprint. Tesla claims the third position, seizing 8.27% of the market. Renowned for its avant-garde, tech-driven offerings, Tesla enjoys a seamless supply chain across nations, notably China and Australia.
- Wuling comes in fourth, holding approximately 7.10% of the market. Operating under its parent company, Liuzhou Wuling Automobile Industry Co. Ltd, Wuling has carved a niche in countries like China and Indonesia, catering to a diverse clientele with its varied EV lineup. Rounding out the top five is Honda, with a 3.85% market share. Other notable contenders in the APAC EV market encompass brands like Nissan, Chery, Changan, and Neta, among others.

IN 2022, WULING, TESLA, AND BYD WERE THE BIGGEST BATTERY PACK DEMAND GENERATORS IN APAC
- The electric vehicle landscape, encompassing cars, buses, and trucks, has witnessed a notable upswing across various Asian countries in the past few years. While the appetite for electric vehicles fluctuates across regions and nations, it is evident that SUVs have carved a niche in major markets like China, India, and Japan. As a direct reflection of Asia's growing preference for SUVs over traditional sedans, due to their enhanced utility and spaciousness, electric SUVs have seen a parallel surge across the Asia-Pacific belt.
- Recent times have spotlighted a burgeoning affinity for compact SUVs among the Asian populace. Tesla's Model Y stands out with its all-electric drivetrain, sterling 5-star NCAP safety rating, seven-seat capacity, commendable range, and other features, making it a sought-after option in pivotal APAC markets, notably China. BYD's Song DM, with its competitive pricing and efficient fuel dynamics, has resonated well with customers across several Asian territories.
- The year 2022 saw Tesla's Model 3 clinching accolades as one of the top sellers in the Asian domain, a testament to its purely electric mechanism, paired with an array of attractive functionalities. The dynamic APAC EV arena also presents a myriad of electric SUV and sedan alternatives from established global manufacturers. The year 2022 anticipated robust sales for vehicles like Toyota's Yaris Cross and BYD's Dolphin. Other players, such as the Toyota Corolla and Wuling's Hongguang MINIEV, also form a robust lineup in the APAC EV ecosystem.

OTHER KEY INDUSTRY TRENDS COVERED IN THE REPORT
- GOVERNMENT INITIATIVES AND COMMERCIAL VEHICLE ELECTRIFICATION ARE RAPIDLY DRIVING THE DEMAND AND SALES OF EVS IN ASIA-PACIFIC
- THE DEMAND FOR EVS IN ASIA-PACIFIC IS FUELED BY FALLING BATTERY PRICES
- INCREASING GOVERNMENT SUPPORT FOR ELECTRIC VEHICLES IN ASIA-PACIFIC CAUSED PRICES TO DROP
- DEMAND FOR ELECTRIC VEHICLES DRIVES INTERNATIONAL AUTOMAKERS TO LAUNCH NEW PRODUCTS, EXPANDING THE ASIA-PACIFIC EV BATTERY PACK MARKET
- RISING POPULARITY OF LFP BATTERIES IN ASIAN COUNTRIES IS AIDING THE MARKET
- THE LFP BATTERIES SEGMENT HEADS THE ASIA-PACIFIC ELECTRIC VEHICLE BATTERY DEMAND
- RISING ELECTRIC VEHICLE DEMAND AND ADVANCEMENTS IN BATTERY TECHNOLOGY DRIVE GROWTH IN THE ASIA-PACIFIC REGION
Segment Analysis: Propulsion Type
BEV Segment in Asia-Pacific Electric Bus Battery Pack Market
Battery Electric Vehicles (BEVs) dominate the Asia-Pacific electric bus battery pack market, commanding approximately 99% of the total market share in 2024. This overwhelming dominance can be attributed to several factors, including the superior operational efficiency and lower maintenance costs associated with BEVs compared to other propulsion types. The segment's growth is further bolstered by substantial government support across various Asian countries, particularly in China, India, and Japan, through initiatives like purchase subsidies and tax incentives. Major manufacturers in the region have significantly expanded their BEV bus production capabilities, with companies like BYD, Yutong, and CATL leading the charge in battery technology development. The increasing focus on zero-emission public transportation, coupled with advancements in battery technology and charging infrastructure, has made BEVs the preferred choice for public transport operators across the region.
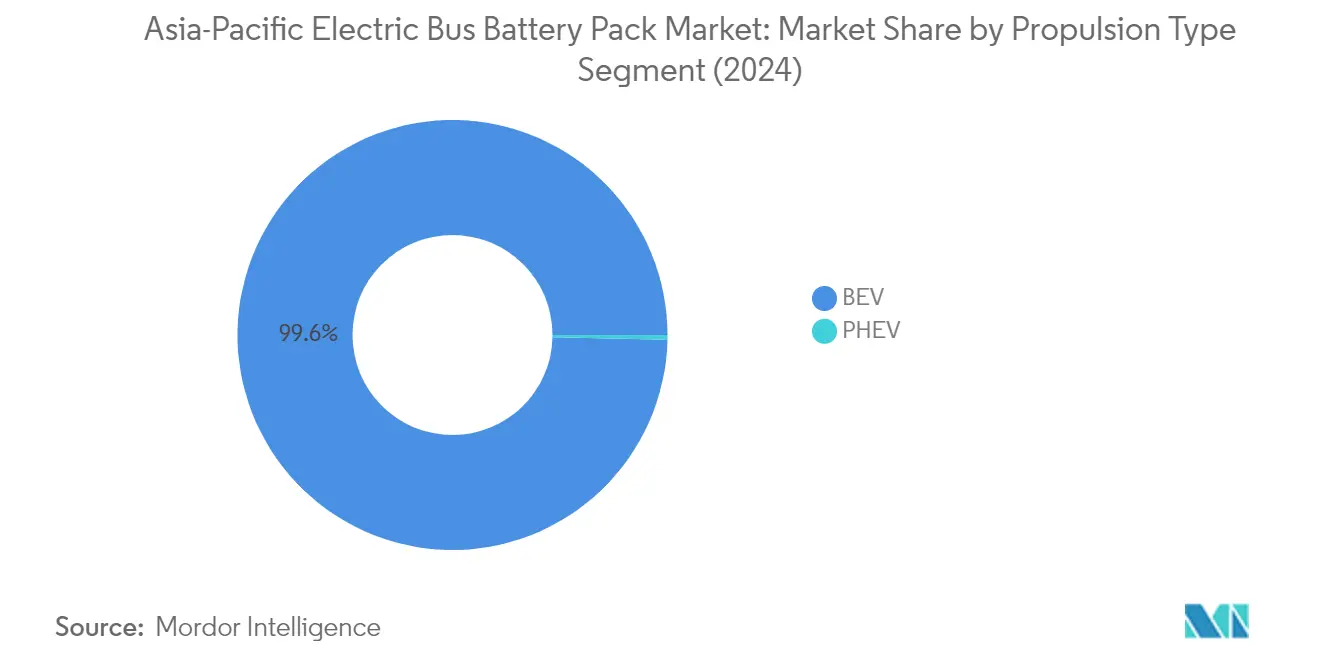
PHEV Segment in Asia-Pacific Electric Bus Battery Pack Market
The Plug-in Hybrid Electric Vehicle (PHEV) segment is experiencing rapid growth in the Asia-Pacific electric bus battery pack market, with a projected growth rate of approximately 10% from 2024 to 2029. This growth is driven by the segment's ability to offer a practical transition solution for operators who require extended range capabilities while still maintaining lower emission profiles. The increasing adoption of PHEVs is supported by their dual-power source advantage, which helps alleviate range anxiety concerns in regions with developing charging infrastructure. Several major Asian cities are incorporating PHEV buses into their fleets as part of their gradual transition to fully electric transportation systems. The segment is witnessing significant technological advancements in battery management systems and powertrain efficiency, making PHEV buses increasingly attractive for routes where pure electric vehicles may face operational challenges.
Segment Analysis: Battery Chemistry
LFP Segment in Asia-Pacific Electric Bus Battery Pack Market
Lithium Iron Phosphate (LFP) batteries have emerged as the dominant chemistry in the Asia-Pacific electric bus battery pack market, commanding approximately 56% of the total market share in 2024. This substantial market leadership can be attributed to several key advantages that LFP batteries offer, including enhanced safety features, longer lifecycle, and better thermal stability compared to other chemistries. The segment's dominance is particularly pronounced in China, where major manufacturers have invested heavily in LFP technology for electric buses. The lower production costs associated with LFP batteries, combined with their proven reliability in commercial vehicle battery applications, have made them the preferred choice for electric bus manufacturers across the region. Additionally, the absence of cobalt in LFP batteries has helped shield manufacturers from the price volatility and supply chain concerns associated with cobalt-based chemistries.
NCA Segment in Asia-Pacific Electric Bus Battery Pack Market
The Nickel Cobalt Aluminum (NCA) battery segment is experiencing remarkable growth in the Asia-Pacific electric bus battery pack market, with an expected growth rate of approximately 8% from 2024 to 2029. This growth trajectory is driven by the increasing demand for high-energy-density solutions in electric buses, particularly in premium and long-range applications. The segment's expansion is supported by significant technological advancements in NCA chemistry, leading to improved performance metrics and enhanced safety features. Major battery manufacturers in South Korea and Japan are investing in research and development to optimize NCA technology for electric bus applications, focusing on increasing energy density while maintaining thermal stability. The segment is also benefiting from the growing preference for NCA batteries in regions with extreme weather conditions, where their superior performance characteristics provide advantages for electric bus operations.
Remaining Segments in Battery Chemistry
The other battery chemistry segments in the market, including NCM (Nickel Cobalt Manganese) and NMC (Nickel Manganese Cobalt), continue to play important roles in the Asia-Pacific electric bus battery pack landscape. These chemistries offer unique advantages in terms of energy density and performance characteristics, making them suitable for specific applications and operating conditions. The NCM/NMC segments are particularly strong in markets where high-performance requirements take precedence over cost considerations. The presence of multiple viable battery chemistries has fostered healthy competition and innovation in the market, leading to continuous improvements in battery technology. This diversity in battery chemistry options allows electric bus manufacturers to choose the most suitable technology based on their specific requirements, operating conditions, and cost considerations.
Segment Analysis: Capacity
Above 80 kWh Segment in Asia-Pacific Electric Bus Battery Pack Market
The Above 80 kWh segment has emerged as both the dominant and fastest-growing segment in the Asia-Pacific electric bus battery pack market, commanding approximately 62% market share in 2024. This segment's leadership position is driven by the increasing demand for long-range electric buses in major metropolitan areas across Asia-Pacific, particularly in China and India. The preference for high-capacity batteries is further bolstered by the expanding intercity bus routes and the need for extended operational hours without frequent charging stops. Battery manufacturers are focusing on developing advanced thermal management systems and enhanced energy density solutions specifically for this capacity range, making it more attractive for public transport operators. The segment's growth is also supported by government initiatives promoting zero-emission public transportation and the increasing adoption of electric buses in both tier-1 and tier-2 cities. Additionally, improvements in charging infrastructure and declining battery costs have made high-capacity battery packs more feasible for transport authorities and private operators, further cementing this segment's market leadership.
Remaining Segments in Capacity
The other capacity segments in the market include 40 kWh to 80 kWh, 15 kWh to 40 kWh, and Less than 15 kWh, each serving specific use cases in the electric bus ecosystem. The 40 kWh to 80 kWh segment caters primarily to inner-city buses and shorter routes where frequent charging opportunities are available. The 15 kWh to 40 kWh segment serves specialized applications such as shuttle services and campus transportation, where routes are predetermined and charging infrastructure is readily accessible. The Less than 15 kWh segment, while smaller, fills a niche in the market for short-distance transit solutions and pilot projects in smaller cities. These segments collectively complement the market by providing varied options for different operational requirements, route lengths, and charging infrastructure availability. The diversity in capacity options allows transport operators to optimize their fleet based on specific route requirements, operational costs, and infrastructure constraints, contributing to the overall growth of the electric bus market in the region.
Segment Analysis: Method
Laser Segment in Asia-Pacific Electric Bus Battery Pack Market
The laser segment has emerged as the dominant force in the Asia-Pacific electric bus battery pack market, commanding approximately 97% of the market share in 2024. This method has gained significant traction due to its superior precision and consistency in battery pack manufacturing. The laser technology offers numerous advantages, including high-quality connections, compatibility with irregular surfaces, and extended operational lifespans, making it particularly suitable for high-current battery applications. The segment is also experiencing robust growth, projected to expand at around 8% during 2024-2029, driven by increasing adoption of advanced manufacturing techniques in battery production. The growing emphasis on improved performance, safety, and durability of battery packs has further accelerated the adoption of laser methods. Manufacturers are increasingly investing in laser technology due to its ability to deliver consistent quality and precise cutting capabilities, which are crucial for maintaining high standards in battery pack production. The advancement in laser technology, coupled with innovative techniques for battery assembly, continues to strengthen its position as the preferred method in the market.
Wire Segment in Asia-Pacific Electric Bus Battery Pack Market
The wire bonding method represents a traditional approach in the Asia-Pacific electric bus battery pack market, offering a cost-effective solution for battery pack manufacturing. This method continues to serve specific applications where conventional connection techniques are preferred, particularly in low to medium power applications. Wire bonding provides advantages such as established manufacturing processes, lower initial investment costs, and proven reliability in certain battery configurations. The method's flexibility in terms of material selection and bonding parameters makes it suitable for various battery pack designs. However, the segment faces challenges from advancing technologies and increasing demands for higher performance battery packs. Manufacturers utilizing wire bonding are focusing on improving their processes to enhance connection quality and reliability. The method maintains its relevance in specific market niches where traditional bonding techniques align with product requirements and cost considerations.
Segment Analysis: Component
Cathode Segment in Asia-Pacific Electric Bus Battery Pack Market
The cathode segment has emerged as both the largest and fastest-growing component in the Asia-Pacific electric bus battery pack market, commanding approximately 69% of the total market share in 2024. This dominance can be attributed to cathodes being the most crucial component of battery packs, making up about 52% of the overall battery cost and playing a vital role in determining battery performance, range, and thermal safety. The segment's leadership position is further strengthened by increasing investments in cathode material development and manufacturing capabilities across major Asian markets, particularly in China, Japan, and South Korea. The growing emphasis on high-performance cathode materials, such as nickel-rich compositions and advanced coating technologies, has contributed to enhanced battery efficiency and longevity. Additionally, the segment is expected to maintain its growth trajectory, driven by technological advancements in cathode chemistry, increasing focus on sustainable cathode production methods, and the rising demand for high-energy-density batteries in electric buses.
Remaining Segments in Component Segmentation
The other significant electric bus components in the Asia-Pacific electric bus battery pack market include anodes, electrolytes, and separators, each playing crucial roles in battery performance and functionality. Anodes, typically made from materials like graphite and silicon, contribute significantly to battery capacity and charging speed. The electrolyte component, which facilitates ion movement between electrodes, is essential for battery efficiency and safety, making up approximately 4% of the total battery cost. Separators, while representing a smaller portion of the battery cost at around 7%, are critical for battery safety and performance by preventing direct contact between positive and negative electrodes while allowing ion flow. These components are witnessing continuous technological improvements, with manufacturers focusing on developing advanced materials and manufacturing processes to enhance overall battery performance, safety, and cost-effectiveness in electric bus applications.
Segment Analysis: Material Type
Natural Graphite Segment in Asia-Pacific Electric Bus Battery Pack Market
Natural graphite has emerged as the dominant material segment in the Asia-Pacific electric bus battery pack market, driven by its essential role in anode production and superior electrochemical properties. The material's high conductivity, stability, and cost-effectiveness have made it particularly attractive for electric bus battery manufacturers. Natural graphite's prominence is further reinforced by its extensive use in various battery chemistries, including LFP and NMC batteries, which are widely adopted in the region's electric bus sector. The material's sustainable sourcing capabilities and established supply chains, particularly in China, have contributed to its market leadership. Additionally, technological advancements in graphite processing and purification have enhanced its performance characteristics, making it increasingly valuable for high-capacity battery applications in electric buses.
Nickel Segment in Asia-Pacific Electric Bus Battery Pack Market
The nickel segment is experiencing remarkable growth in the Asia-Pacific electric bus battery pack market, driven by increasing demand for high-energy-density batteries. The segment's expansion is supported by technological advancements in nickel-rich cathode materials, which offer improved performance and longer range capabilities for electric buses. Manufacturers are increasingly incorporating higher nickel content in their battery formulations to achieve better energy density and overall battery performance. The growth is further accelerated by the development of advanced nickel-based battery chemistries that offer enhanced thermal stability and longer lifecycle. Strategic investments in nickel processing capabilities and the establishment of regional supply chains are also contributing to the segment's rapid expansion in the Asia-Pacific market.
Remaining Segments in Material Type
The other material segments, including lithium, cobalt, and manganese, play crucial roles in the Asia-Pacific electric bus battery pack market. Lithium remains fundamental to all battery chemistries, serving as the primary charge carrier in lithium-ion batteries. Cobalt, despite efforts to reduce its usage, continues to be important for providing structural stability and enhancing battery performance. Manganese offers a balance between cost and performance, making it valuable for various battery formulations. These materials complement each other in different battery chemistries, with manufacturers often adjusting their proportions to optimize performance, cost, and sustainability factors. The ongoing research and development in these materials continue to drive innovations in battery technology, while efforts to secure sustainable supply chains for these materials remain a priority for manufacturers in the region.
Asia-Pacific Electric Bus Battery Pack Market Geography Segment Analysis
Asia-Pacific Electric Bus Battery Pack Market in China
China continues to dominate the Asia-Pacific electric bus battery pack market, commanding approximately 92% of the total market volume in 2024. The country's supremacy in this sector is built upon its robust manufacturing infrastructure, comprehensive supply chain network, and strong government support for electric bus adoption. Chinese manufacturers have established themselves as global leaders in electric bus battery technology, consistently introducing innovations in battery chemistry and management systems. The country's focus on developing advanced lithium iron phosphate (LFP) batteries has particularly strengthened its position in the electric bus segment. Local manufacturers benefit from economies of scale, enabling them to offer competitive pricing while maintaining high-quality standards. The presence of major battery manufacturers and their ongoing investments in research and development continues to reinforce China's position as the epicenter of electric bus battery production in the region.
Asia-Pacific Electric Bus Battery Pack Market in Japan
Japan's electric bus battery pack market is experiencing remarkable growth, with a projected CAGR of approximately 109% from 2024 to 2029. The country's success in this sector is driven by its cutting-edge battery technology and strong emphasis on sustainable transportation solutions. Japanese manufacturers are particularly focused on developing high-energy-density batteries that offer superior performance and longevity. The country's robust research and development ecosystem, supported by collaborations between industry leaders and academic institutions, continues to drive innovation in battery technology. Japanese companies are increasingly investing in next-generation battery technologies, including solid-state batteries, positioning themselves at the forefront of technological advancement. The country's stringent quality control standards and emphasis on safety features have helped establish Japanese battery manufacturers as preferred suppliers in the global market. The integration of advanced battery management systems and thermal control technologies further distinguishes Japanese battery packs in the market.
Asia-Pacific Electric Bus Battery Pack Market in India
India's electric bus battery pack market is experiencing significant transformation as the country accelerates its transition to bus electrification. The government's ambitious plans for public transportation electrification have created a robust demand for electric bus battery packs. Local manufacturers are rapidly expanding their production capabilities, while international players are establishing manufacturing facilities to cater to the growing market. The country's focus on developing a comprehensive electric vehicle ecosystem, including battery manufacturing and charging infrastructure, is creating new opportunities for market growth. Indian manufacturers are particularly focusing on developing battery packs that can withstand diverse climatic conditions and challenging operating environments. The emphasis on localization of battery production, supported by various government initiatives and incentives, is helping reduce the overall cost of electric bus batteries. The country's strong automotive manufacturing base and growing technical expertise in battery technology are contributing to its emerging role as a significant player in the regional market.
Asia-Pacific Electric Bus Battery Pack Market in South Korea
South Korea has established itself as a key player in the electric bus battery pack market, leveraging its advanced technological capabilities and strong automotive industry base. The country's battery manufacturers are known for their focus on high-performance battery solutions, particularly in the development of advanced nickel-rich cathode materials. South Korean companies have made significant strides in improving battery energy density and charging capabilities, making their products increasingly attractive to electric bus manufacturers. The country's strong intellectual property portfolio in battery technology and continuous investment in research and development activities have helped maintain its competitive edge. South Korean manufacturers are also leading the way in developing smart battery management systems that optimize performance and extend battery life. The country's emphasis on quality control and safety standards has helped build trust among global customers, while its strategic partnerships with international automotive manufacturers have expanded its market reach.
Asia-Pacific Electric Bus Battery Pack Market in Other Countries
Other countries in the Asia-Pacific region are also making significant strides in the electric bus battery pack market, each with their unique approach and focus areas. Countries like Indonesia, Vietnam, and Singapore are developing their electric bus infrastructure and creating opportunities for battery pack manufacturers. These markets are characterized by increasing environmental awareness and government initiatives to reduce carbon emissions from public transportation. The Philippines and Malaysia are focusing on developing their domestic capabilities in battery pack assembly and integration. Australia and New Zealand are emerging as important markets for advanced battery technologies, particularly focusing on sustainable and efficient public transportation solutions. These countries are benefiting from technology transfer and partnerships with established players, while also developing their own expertise in specific areas of battery technology. The diverse nature of these markets, each with their unique requirements and operating conditions, is driving innovation in battery pack design and manufacturing processes.
Competitive Landscape
Top Companies in Asia-Pacific Electric Bus Battery Pack Market
The market is characterized by intense innovation in battery technology, with companies focusing on developing advanced lithium-ion batteries with improved energy density, extended range, and enhanced safety features. Major players are investing heavily in research and development to create next-generation electric bus battery pack solutions, including solid-state batteries and cobalt-free alternatives. Operational agility is demonstrated through vertical integration of production processes, from cell manufacturing to complete battery pack assembly. Strategic partnerships with automotive manufacturers and local companies have become increasingly common to establish strong regional footprints. Companies are rapidly expanding their production capacities through new manufacturing facilities across key markets like China, Japan, and South Korea, while also investing in battery recycling infrastructure to ensure sustainability and resource efficiency.
Market Dominated by Asian Battery Specialists
The Asia-Pacific electric bus battery pack market is predominantly led by specialized battery manufacturers based in China, South Korea, and Japan, with Chinese companies holding significant market share. These specialists have established themselves through extensive technological expertise and strong relationships with local electric bus manufacturers. The market shows high consolidation among top players who have built formidable barriers to entry through their advanced manufacturing capabilities, established supply chains, and proprietary technologies. Local players maintain competitive advantages through their deep understanding of regional markets and strong government relationships, while global conglomerates leverage their financial strength and diverse product portfolios.
The industry has witnessed strategic mergers and acquisitions aimed at vertical integration and technology acquisition. Companies are forming joint ventures to combine complementary strengths and expand market presence, particularly in emerging markets like India and Southeast Asia. Major battery manufacturers are acquiring smaller technology companies to enhance their innovation capabilities and expand their intellectual property portfolios. These consolidation activities are reshaping the competitive landscape, creating stronger entities capable of meeting the growing demand for electric bus batteries while maintaining technological leadership.
Innovation and Localization Drive Future Success
Success in this market increasingly depends on companies' ability to innovate while maintaining cost competitiveness. Incumbent players must focus on developing next-generation battery technologies while optimizing their production processes to reduce costs. Building strong relationships with electric bus manufacturers through customized solutions and reliable after-sales support is crucial. Companies need to invest in local manufacturing facilities to benefit from government incentives and reduce logistics costs. Establishing robust recycling programs and sustainable production practices will become increasingly important as environmental regulations tighten.
For contenders looking to gain market share, focusing on specific market segments or geographic regions offers a viable entry strategy. Developing specialized commercial vehicle battery solutions for specific applications or climate conditions can help create competitive advantages. Building strategic partnerships with emerging bus electrification manufacturers and local governments can provide access to new markets and customers. Companies must also prepare for potential regulatory changes regarding battery safety standards and environmental requirements. The ability to adapt to evolving customer preferences and technological standards while maintaining quality and reliability will be crucial for long-term success in this market.
Asia-Pacific Electric Bus Battery Pack Industry Leaders
BYD Company Ltd.
Contemporary Amperex Technology Co. Ltd. (CATL)
EVE Energy Co. Ltd.
LG Energy Solution Ltd.
Panasonic Holdings Corporation
- *Disclaimer: Major Players sorted in no particular order

Recent Industry Developments
- February 2023: Samsung SDI is expanding investment in its Hungary plant, which has the largest production capacity to respond to the fast-increasing demand for mid- to large-size batteries.
- January 2023: Korean battery maker Samsung SDI posted record-high profit in 2022, driven by solid demand for electric vehicle batteries and energy storage systems.
- November 2022: Samsung SDI has signed an agreement with Sungkyunkwan University to establish a course for battery technologies to raise battery experts.
Asia-Pacific Electric Bus Battery Pack Market Report Scope
BEV, PHEV are covered as segments by Propulsion Type. LFP, NCA, NCM, NMC, Others are covered as segments by Battery Chemistry. 15 kWh to 40 kWh, 40 kWh to 80 kWh, Above 80 kWh, Less than 15 kWh are covered as segments by Capacity. Cylindrical, Pouch, Prismatic are covered as segments by Battery Form. Laser, Wire are covered as segments by Method. Anode, Cathode, Electrolyte, Separator are covered as segments by Component. Cobalt, Lithium, Manganese, Natural Graphite, Nickel are covered as segments by Material Type. China, India, Japan, South Korea, Thailand, Rest-of-Asia-Pacific are covered as segments by Country.| BEV |
| PHEV |
| LFP |
| NCA |
| NCM |
| NMC |
| Others |
| 15 kWh to 40 kWh |
| 40 kWh to 80 kWh |
| Above 80 kWh |
| Less than 15 kWh |
| Cylindrical |
| Pouch |
| Prismatic |
| Laser |
| Wire |
| Anode |
| Cathode |
| Electrolyte |
| Separator |
| Cobalt |
| Lithium |
| Manganese |
| Natural Graphite |
| Nickel |
| Other Materials |
| China |
| India |
| Japan |
| South Korea |
| Thailand |
| Rest-of-Asia-Pacific |
| Propulsion Type | BEV |
| PHEV | |
| Battery Chemistry | LFP |
| NCA | |
| NCM | |
| NMC | |
| Others | |
| Capacity | 15 kWh to 40 kWh |
| 40 kWh to 80 kWh | |
| Above 80 kWh | |
| Less than 15 kWh | |
| Battery Form | Cylindrical |
| Pouch | |
| Prismatic | |
| Method | Laser |
| Wire | |
| Component | Anode |
| Cathode | |
| Electrolyte | |
| Separator | |
| Material Type | Cobalt |
| Lithium | |
| Manganese | |
| Natural Graphite | |
| Nickel | |
| Other Materials | |
| Country | China |
| India | |
| Japan | |
| South Korea | |
| Thailand | |
| Rest-of-Asia-Pacific |
Market Definition
- Battery Chemistry - Various types of battery chemistry considred under this segment include LFP, NCA, NCM, NMC, Others.
- Battery Form - The types of battery forms offered under this segment include Cylindrical, Pouch and Prismatic.
- Body Type - Body types considered under this segment include is variety of buses.
- Capacity - Various types of battery capacities inldude under theis segment are 15 kWH to 40 kWH, 40 kWh to 80 kWh, Above 80 kWh and Less than 15 kWh.
- Component - Various components covered under this segment include anode, cathode, electrolyte, separator.
- Material Type - Various material covered under this segment include cobalt, lithium, manganese, natural graphite, nickel, other material.
- Method - The types of method covered under this segment include laser and wire.
- Propulsion Type - Propulsion types considered under this segment include BEV (Battery electric vehicles), PHEV (plug-in hybrid electric vehicle).
- ToC Type - ToC 3
- Vehicle Type - Vehicle type considered under this segment include commercial vehicles with various EV powertrains.
| Keyword | Definition |
|---|---|
| Electric vehicle (EV) | A vehicle which uses one or more electric motors for propulsion. Includes cars, buses, and trucks. This term includes all-electric vehicles or battery electric vehicles and plug-in hybrid electric vehicles. |
| PEV | A plug-in electric vehicle is an electric vehicle that can be externally charged and generally includes all electric vehicles as well as plug-electric vehicles as well as plug-in hybrids. |
| Battery-as-a-Service | A business model in which the battery of an EV can be rented from a service provider or swapped with another battery when it runs out of charge |
| Battery Cell | The basic unit of an electric vehicle's battery pack, typically a lithium-ion cell, that stores electrical energy. |
| Module | A subsection of an EV battery pack, consisting of several cells grouped together, often used to facilitate manufacturing and maintenance. |
| Battery Management System (BMS) | An electronic system that manages a rechargeable battery by protecting the battery from operating outside its safe operating area, monitoring its state, calculating secondary data, reporting data, controlling its environment, and balancing it. |
| Energy Density | A measure of how much energy a battery cell can store in a given volume, usually expressed in watt-hours per liter (Wh/L). |
| Power Density | The rate at which energy can be delivered by the battery, often measured in watts per kilogram (W/kg). |
| Cycle Life | The number of complete charge-discharge cycles a battery can perform before its capacity falls under a specified percentage of its original capacity. |
| State of Charge (SOC) | A measurement, expressed as a percentage, that represents the current level of charge in a battery compared to its capacity. |
| State of Health (SOH) | An indicator of the overall condition of a battery, reflecting its current performance compared to when it was new. |
| Thermal Management System | A system designed to maintain optimal operating temperatures for an EV's battery pack, often using cooling or heating methods. |
| Fast Charging | A method of charging an EV battery at a much faster rate than standard charging, typically requiring specialized charging equipment. |
| Regenerative Braking | A system in electric and hybrid vehicles that recovers energy normally lost during braking and stores it in the battery. |
Research Methodology
Mordor Intelligence follows a four-step methodology in all its reports.
- Step-1: Identify Key Variables: To build a robust forecasting methodology, the variables and factors identified in Step-1 are tested against available historical market numbers. Through an iterative process, the variables required for market forecast are set and the model is built based on these variables.
- Step-2: Build a Market Model: Market-size estimations for the historical and forecast years have been provided in revenue and volume terms. Market revenue is calculated by multiplying the volume demand with volume-weighted average battery pack price (per kWh). Battery pack price estimation and forecast takes into account various factors affecting ASP, such as inflation rates, market demand shifts, production costs, technological developments, and consumer preferences, providing estimations for both historical data and future trends.
- Step-3: Validate and Finalize: In this important step, all market numbers, variables, and analyst calls are validated through an extensive network of primary research experts from the market studied. The respondents are selected across levels and functions to generate a holistic picture of the market studied.
- Step-4: Research Outputs: Syndicated Reports, Custom Consulting Assignments, Databases & Subscription Platforms


