
Market Overview
| Study Period | 2020 - 2031 |
|---|---|
| Forecast Data Period | 2026 - 2031 |
| Historical Data Period | 2020 - 2024 |
| Growth Rate | 7.12 % |
| Market Concentration | Medium |
Major Players *Disclaimer: Major Players sorted in no particular order Image © Mordor Intelligence. Reuse requires attribution under CC BY 4.0. | |
Asia-Pacific Diagnostic Imaging Market Analysis by Mordor Intelligence
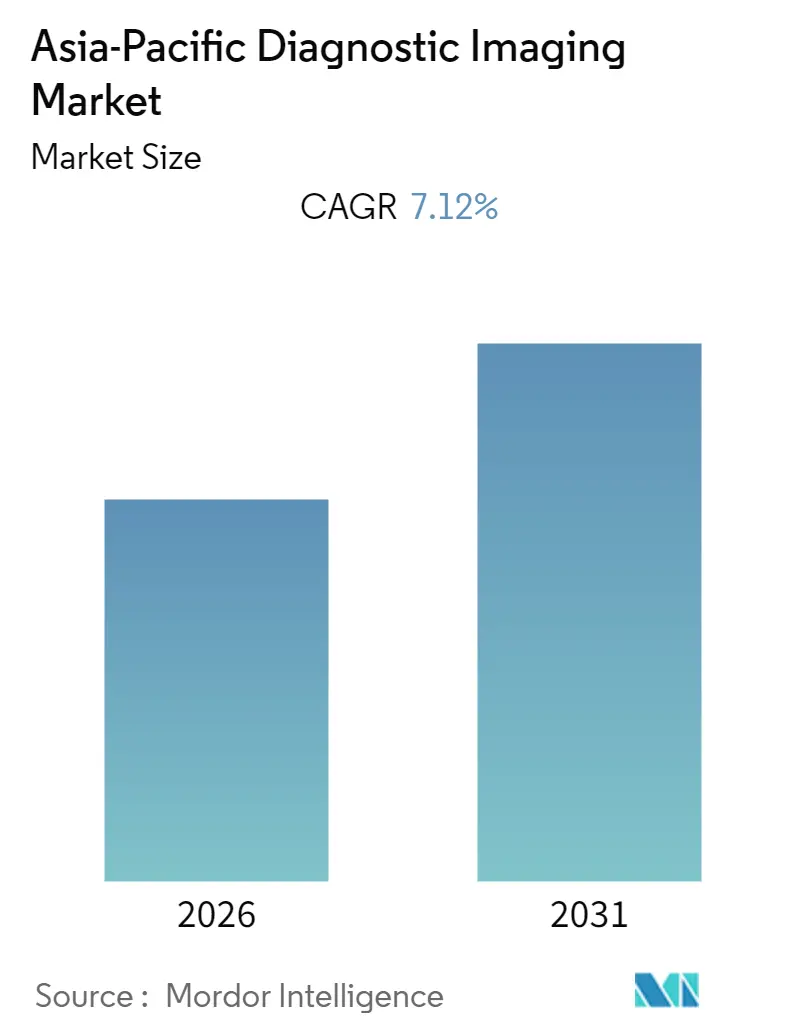
The Asia-Pacific Diagnostic Imaging Market size is expected to register a CAGR of 7.12% during the forecast period (2026-2031).
The COVID-19 epidemic caused several significant problems for the healthcare sector. Since the majority of chronic therapies were considered non-urgent during the COVID-19 pandemic, all outpatient treatments were delayed or restricted to lower the danger of viral transmission. Lung imaging, however, became a significant component of COVID-19 diagnoses with the emergence of the infection, as it assisted in determining the severity of the illness in the afflicted population. According to a study published in the Indian Journal of Radiology and Imaging in January 2021, portable chest radiography had become a popular technique for rapidly assessing the degree of lung involvement in COVID-19 pneumonia in hospitalized symptomatic patients and calculating its progression. As a result, the use of diagnostic imaging grew during COVID-19 and had a favorable influence on the market. However, currently, the market has reached its pre-pandemic nature in terms of diagnostic imaging procedures and is expected to witness strong growth in the coming years.
Factors such as an increase in the prevalence of chronic diseases, technological advancements in imaging modalities, and the growing need for early diagnostics are driving the market.
There is a growing burden of life-threatening chronic diseases in Asian countries, which is one of the leading factors responsible for the market growth in the region. For instance, a research article by the National Institute of Health published in August 2021 highlighted in their research paper that both the prevalence and incidence of heart failure (HF) increase with increasing age and that HF places a considerable burden on health systems in China. Thus, the burden of cardiovascular diseases among the target populations in the countries of the Asia-Pacific region is expected to demand the availability of diagnostic imaging products for disease diagnosis and treatment. As a result, it is expected to contribute to market growth.
Furthermore, with the technological innovation in the area, many products are expected to be launched over the forecast period, which may also positively impact market growth. For instance, in April 2022, Wipro GE Healthcare announced the release of an innovative imaging solution that was entirely developed and produced in India. In accordance with the Atma Nirbhar Bharat mission, the imaging solution, the Revolution Aspire CT (computerized tomography) scanner, was produced at the recently opened Wipro GE Medical Devices Manufacturing unit. With the release of these new imaging devices in Asian countries, the market that was looked at is expected to grow quickly over the next few years.
However, the high cost of instruments and lack of skilled radiologists have been restraining the growth of this market.
Note: Market size and forecast figures in this report are generated using Mordor Intelligence’s proprietary estimation framework, updated with the latest available data and insights as of 2026.
Asia-Pacific Diagnostic Imaging Market Trends and Insights
Oncology Segment is Expected to Witness a Healthy Growth in Coming Years
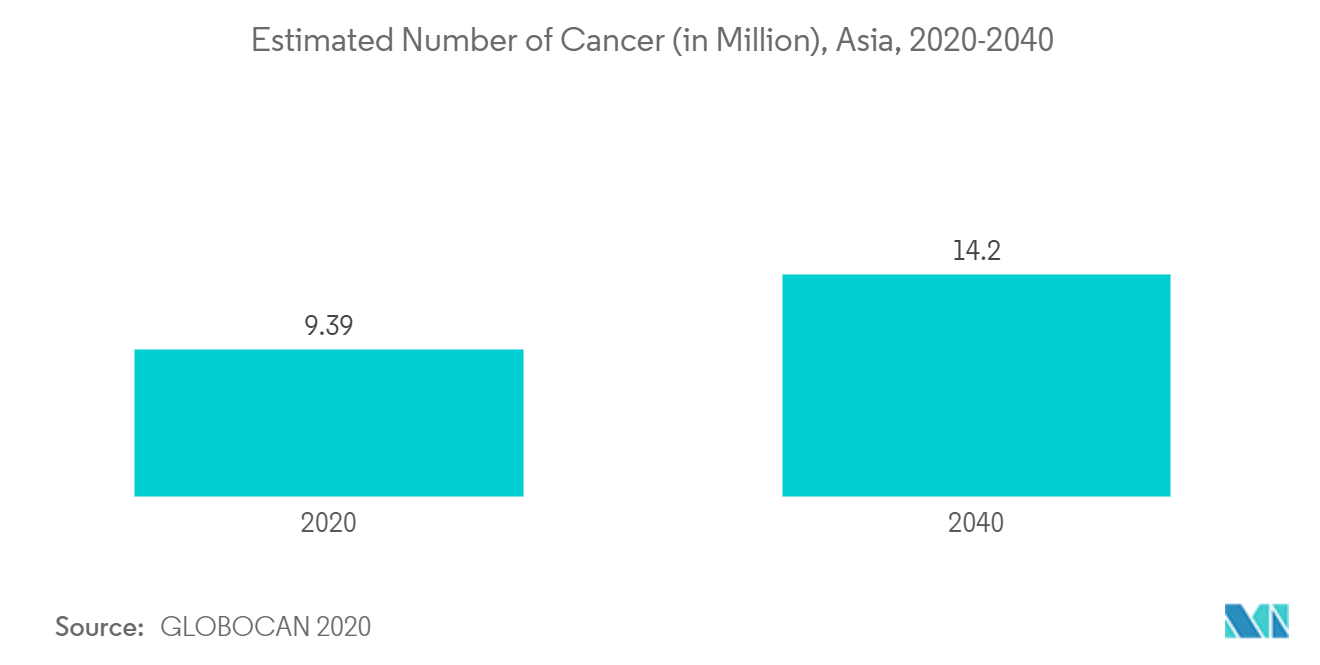
Oncology is predicted to have considerable development in the country due to an increase in cancer incidence and technical advancements in the field of image diagnostics. According to statistics published by the Global Cancer Observatory (Globocan) in 2021, there were an estimated 206.60 million prevalent cases of cancer in five years for all types of cancer in both sexes in Asia during the year 2020. It was also reported that there are 9.73 million five-year prevalent cases of all types of cancer in males and about 10.86 million cases in females for the same year. Such a high prevalence of cancer in the region is generating the need for early diagnosis of cancer and thus driving the growth of the market.
Several key market players focusing on research and development of diagnostic imaging in Asia-Pacific are also aiding the growth of the market. For instance, in August 2021, Concord Medical Services Holdings Limited, which operates an extensive network of radiotherapy and diagnostic imaging centers in China, reported an investment of RMB 400.0 million (USD 62.2 million) in Concord Medical's subsidiary, Meizhong Jiahe Medical Science & Technology Development Group Co., Ltd. Additionally, in April 2022, Fujitsu and the Southern Tohoku General Hospital reported the launch of a joint research project with Fujitsu Japan Limited and FCOM Corporation on an AI technology for the early detection of pancreatic cancer from computed tomography (CT) scans without contrast agents (non-contrast CT scans).
Hence, an increased prevalence of cancer and the implementation of new technologies, along with research and development activities, are expected to help this segment register notable growth.
China is Expected to Hold a Significant Share in the Market and Expected to do Same in the Forecast Period
China is expected to grow quickly because chronic diseases are becoming more common, the number of older people is growing, and more advanced medical imaging equipment is being used.
More and more new products are being released and more money is being raised by Chinese diagnostic imaging companies.For instance, in August 2022, United Imaging Healthcare of Shanghai raised USD 1.6 billion on the very first day of its initial public offering as a public company. With the huge amount raised by United Imaging Healthcare of Shanghai, it is believed that the company will be investing a significant amount in innovative technologies, market expansion, or new product launches, which will ultimately contribute to the market's growth in the coming years.
Furthermore, there have been new facilities planned to become operational in the coming years in China, which will boost market growth. For example, Peking University announced in November 2022 that the National Biomedical Imaging Center, based in Beijing, will open in early 2023, with a construction area of 66,667 square feet.Peking University also stated that USD 237.33 million has been invested in this project. Hence, with such huge investments in medical imaging facilities, the market for diagnostic imaging equipment will be growing significantly over the forecast period in China.
Furthermore, Mindray, a global leader in the development and delivery of medical devices and solutions, announced the launch of its new general imaging, women's healthcare, and cardiology ultrasound solutions in May 2021.The Chinese company Mindray, with the launch of General Imaging Solutions, is contributing to the growth of the diagnostic imaging market in the country.
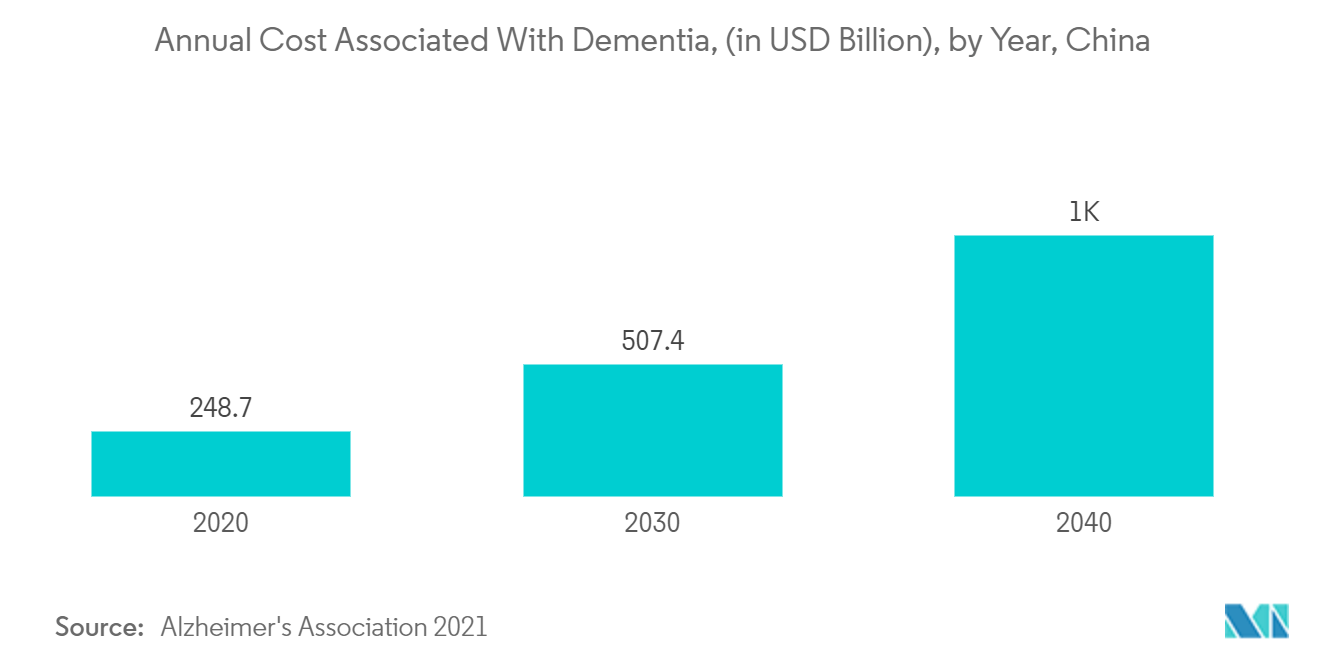
Furthermore, the increasing burden of neurological conditions in China is associated with the high demand for diagnostic imaging. For instance, Alzheimer's Association data published in November 2021 stated that the cost associated with dementia is on the rise in China and that the disease is posing a significant burden on the country's health system.
Thus, owing to the growing number of geriatrics in China, increasing investment in diagnostic imaging and new product launches are some of the crucial factors responsible for the market's growth.
Competitive Landscape
The major players in the Asia-Pacific diagnostic imaging market include Carestream Health, Fujifilm Holdings Corporation, GE Healthcare, Hitachi Medical Corporation, Hologic, Inc., Koninklijke Philips N.V., Shimadzu Corporation, Siemens AG, Canon Medical Systems Corporation, and Shanghai United Imaging Healthcare Co., Ltd., among others. The leading vendors in the market are launching advanced diagnostic imaging equipment. These companies have also been involved in the acquisition of related healthcare companies in order to improve their product portfolio, geographical presence, and growth.
Asia-Pacific Diagnostic Imaging Industry Leaders
-
Carestream Health
-
Fujifilm Holdings Corporation
-
Hologic, Inc
-
Koninklijke Philips N.V.
-
GE Healthcare
- *Disclaimer: Major Players sorted in no particular order

Market Opportunities and Future Outlook
Technology refresh cycles and localization programs are creating whitespace for new installs and upgrades across modalities. In 2026, Canon Medical Systems launched Ultimion, described as Japan's first domestically produced photon-counting CT system, and Siemens Healthineers received NMPA approval for NAEOTOM Alpha.Pro as the first China-made dual-source photon-counting CT. Together, these developments point to faster regional commercialization of spectral, high-resolution CT platforms, with related service and software attach opportunities.
Demand-side conditions in India and Australia shape near-term go-to-market choices. Siemens Healthineers announced local production of the Artis One Edition X angiography system at its Bengaluru facility under India's Production Linked Incentive (PLI) scheme, supporting a lower-friction supply path for high-end interventional imaging in cost-sensitive tiers. In Australia, the Government implemented updates to the Diagnostic Imaging Services Table (DIST) from 1 July 2026, changing reimbursement and supervision requirements across areas such as breast imaging, nuclear medicine, and echocardiography. This encourages vendors and providers to align equipment mix, protocols, and workforce models with reimbursable pathways. Philips also highlighted a commercialization route through education and workflow enablement, signing an MoU with the Asian Society of Cardiovascular Imaging (ASCI) in May 2026 to advance cardiovascular imaging education and AI-enabled platforms across Asia-Pacific.
Recent Industry Developments
- July 2026: Philips Korea and Yeungnam University Medical Center partnered to expand the clinical utilization of AI-based low-dose CT systems. The collaboration supports broader validation and routine use of dose-optimized CT workflows in a university hospital setting, which strengthens the pull-through for AI-enabled imaging upgrades.
- June 2026: FUJIFILM India reported the first installation in India of its AMULET SOPHINITY AI-powered digital mammography system at NM Medical. The deployment adds a high-visibility reference site for AI-assisted breast imaging and can accelerate adoption discussions with large diagnostic chains and hospitals.
- October 2025: Fujifilm announced plans to expand its NURA health screening center network into Vietnam, Thailand, the Philippines, and Malaysia. The expansion extends a preventive screening model that supports higher imaging utilization and creates downstream demand for integrated diagnostic imaging equipment and workflow software across multiple ASEAN markets.
Research Methodology Framework and Report Scope
Market Definition and Coverage
This market covers revenues from diagnostic imaging equipment sold and installed across Asia-Pacific for medical diagnosis, including major modalities used in hospitals and imaging centers.
Scope exclusions: We exclude imaging service revenues, procedure fees, and general hospital IT that is not directly tied to imaging equipment.
Segmentation Overview
- By Modality
- MRI
- Low and mid field MRI systems (<1.5 T)
- High field MRI systems (1.5-3 T)
- Very High, and Ultra High Field MRI Systems (3T and more)
- Computed Tomography
- Low End Scanners (~16-Slice)
- Mid Range Scanners (~64-Slice)
- High End Scanners (128-Slice and More)
- Ultrasound
- 2D Ultrasound
- 3D Ultrasound
- Other Types of Ultrasound
- X-Ray
- Analog Systems
- Digital Systems
- Nuclear Imaging
- Positron Emission Tomography (PET)
- Single Photon Emission Computed Tomography (SPECT)
- Fluoroscopy
- Mammography
- MRI
- By Application
- Cardiology
- Oncology
- Neurology
- Orthopedics
- Gastroenterology
- Gynecology
- Other Applications
- By End-User
- Hospital
- Diagnostic Centers
- Other End-Users
- Geography
- China
- Japan
- India
- Australia
- South Korea
- Rest of Asia-Pacific
Data Sources, Market Sizing, and Validation
Desk Research
Desk research was used to set the demand and supply context for diagnostic imaging equipment in Asia-Pacific and to keep assumptions anchored to what is observable. We referenced public health and trade signals, such as national health ministry statistics, OECD health indicators (where available for relevant countries), World Bank macro and health spending datasets, UN Comtrade trade flows for relevant equipment categories, and IAEA publications for nuclear medicine related installations and safety context.
To convert those signals into usable model inputs, we also reviewed company annual reports and investor presentations, national tender portals, and publications from medical imaging societies and radiology associations that discuss utilization and modality adoption. In a few cases, paid subscriptions supporting company financials, shipment intelligence, patent search, and shipment-level import and export checks were used to validate directional trends and cross-check derived pricing ranges. The sources above are illustrative, and other public references were also used for collection, validation, and clarification.
Primary Interviews and Surveys
We use interviews and surveys with equipment suppliers, distributors, hospital procurement teams, radiologists, and managers across Asia-Pacific markets. Respondents help clarify replacement timing, modality pricing, purchasing cycles, and gaps in country-level secondary data. Their views are checked against shipment, installation, and purchasing signals before the final analysis.
Distribution of primary research fieldwork respondents
| Company type | Respondent position |
|---|---|
| Top tier: 27% | CXOs: 15% |
| Mid tier: 48% | Functional/Unit leaders: 31% |
| Smaller Players: 25% | Managers: 54% |
Market-Sizing & Forecasting
Sizing was built using both top-down and bottom-up logic. We started with a top-down demand pool reconstruction that links imaging equipment spend to healthcare investment, installation activity, and modality mix by country. Once country totals were derived, they were broken into modalities and end-user channels using observed procurement patterns, utilization direction, and replacement cycles.
To keep the totals realistic, we corroborated the results using selective bottom-up checks, such as sampled ASP times estimated unit volumes for key modalities, distributor channel confirmations, and a limited roll-up of reported imaging equipment revenues where disclosure was clear. Where country-level information was thin, we used proxy indicators like hospital bed additions, diagnostic center expansion, imaging exam growth signals, and import intensity, then applied expert adjustment so outliers did not distort the regional outcome.
Key inputs in the model included modality-wise replacement cycles, average selling price ranges by system configuration, public procurement intensity, import and export trends for imaging equipment categories, and installed base growth signals where available. Forecasts were produced using scenario analysis anchored to healthcare spending outlook and capacity expansion plans, then refined based on primary feedback on pricing pressure, upgrade timing, and adoption pace for higher-end systems.
Data Validation & Update Cycle
Outputs were validated through multiple checks so that no single data series could overly influence results. We compared country and modality totals against independent indicators such as trade flows, public procurement announcements, and installation activity signals, then reviewed any large variances before internal sign-off.
Each report is refreshed on an annual cycle, with interim updates triggered by material events such as major policy changes, sharp currency moves, or sudden shifts in capital equipment procurement. Before delivery, a final analyst pass is completed so the numbers and assumptions reflect the most recent market direction.
Mordor Intelligence's Asia Pacific Diagnostic Imaging Market Size Versus Other Published Estimates
Published market sizes for APAC diagnostic imaging often differ because teams do not align on the same revenue boundary, timing, and pricing logic, even when the titles sound similar. In practice, gaps usually come from whether services are mixed with equipment, how multi-year procurement is recognized, and whether currency conversion uses a consistent point in time.
A refresh-led difference is also common, since updated FX rates and newer ASP assumptions can materially change the USD value in a region where pricing is negotiated and import-linked. By re-checking ASP ranges and conversion timing during each refresh window, then confirming the outcome with recent procurement and installation signals, the estimate is kept current in a way applied by Mordor Intelligence.
Benchmark comparison
| Source | Market Size | Gaps in Research Methodology |
|---|---|---|
| Mordor Intelligence | USD 0.00 B (2024) | |
| Regional Consultancy A | USD 8.37 B (2024) | This figure is presented as diagnostic imaging devices, and it may apply a broader device basket or different allocation of modality revenues, with limited visibility on how ASP changes and FX timing were handled for APAC. |
| Industry Publisher B | USD 7.34 B (2024) | This estimate is framed as medical imaging and can differ on what is counted as product revenue versus adjacent software or accessories, and the published summary does not clarify the refresh cadence or the checks used to validate price and volume assumptions. |
Across the three figures, the spread is mainly explainable through scope boundaries and the timing of price and currency inputs, which can shift USD totals without any equivalent change in unit demand. Using traceable demand indicators, consistent conversion timing, and repeated pricing checks helps keep the final number reproducible and easier to defend in planning discussions.
Key Questions Answered in the Report
What is the current Asia-Pacific Diagnostic Imaging Market size?
The Asia-Pacific Diagnostic Imaging Market is projected to register a CAGR of 7.12% during the forecast period (2026-2031)
Who are the key players in Asia-Pacific Diagnostic Imaging Market?
Carestream Health, Fujifilm Holdings Corporation, Hologic, Inc, Koninklijke Philips N.V. and GE Healthcare are the major companies operating in the Asia-Pacific Diagnostic Imaging Market.
What years does this Asia-Pacific Diagnostic Imaging Market cover?
The report covers the Asia-Pacific Diagnostic Imaging Market historical market size for years: 2019, 2020, 2021, 2022, 2023 and 2024. The report also forecasts the Asia-Pacific Diagnostic Imaging Market size for years: 2025, 2026, 2027, 2028, 2029 and 2030.