
Market Overview
| Study Period | 2020 - 2031 |
|---|---|
| Forecast Data Period | 2026 - 2031 |
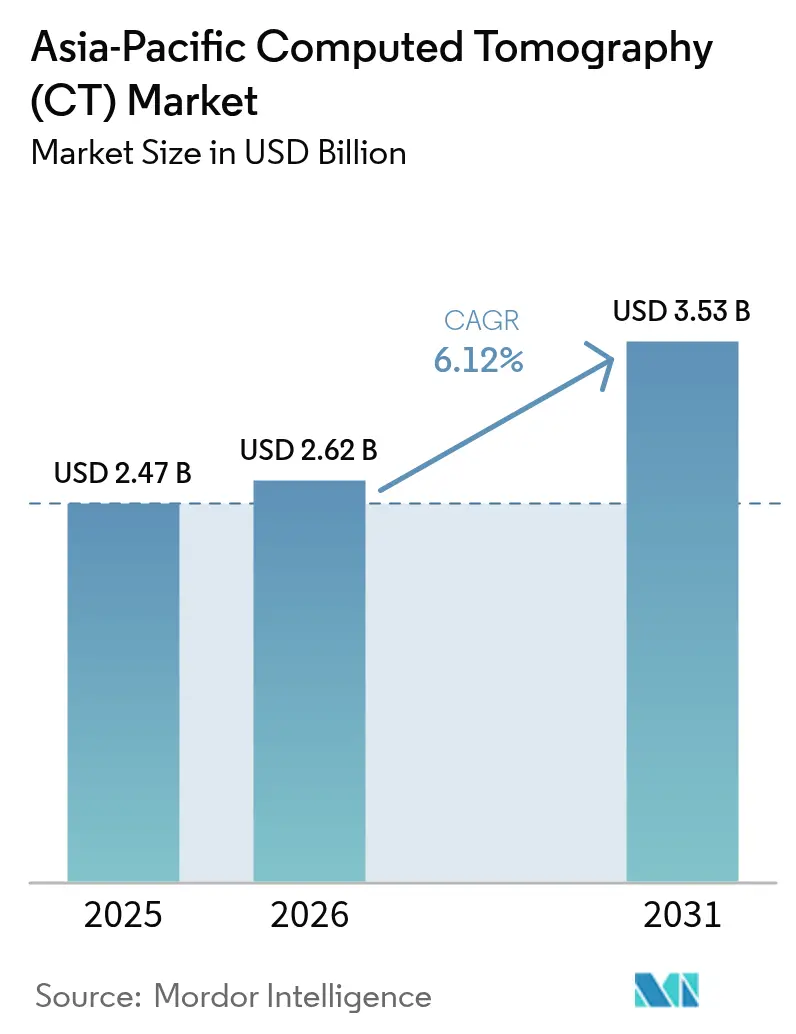
| Base Year Market Size (2025) | USD 2.47 Billion |
| Market Size (2026) | USD 2.62 Billion |
| Market Size (2031) | USD 3.53 Billion |
| Growth Rate (2026 - 2031) | 6.12 % |
| Market Concentration | Medium |
Major Players *Disclaimer: Major Players sorted in no particular order Image © Mordor Intelligence. Reuse requires attribution under CC BY 4.0. | |
Asia-Pacific Computed Tomography (CT) Market Analysis by Mordor Intelligence
Asia-Pacific Computed Tomography (CT) market size in 2026 is estimated at USD 2.62 billion, growing from 2025 value of USD 2.47 billion with 2031 projections showing USD 3.53 billion, growing at 6.12% CAGR over 2026-2031. Widening health-insurance coverage, a rising chronic-disease caseload, and procurement incentives in China and India are sustaining annual system installations even as reimbursement pressures persist. Large private hospital chains are moving beyond routine 16-/32-slice scanners toward ≥64-slice platforms, while provincial governments in China continue to mandate domestic sourcing to bolster self-reliance. Simultaneously, Japan and South Korea are validating photon-counting configurations in tertiary centers, setting a technology benchmark for neighboring markets. Vendor financing—from OEM-backed leasing in China to non-bank medical-equipment loans in India—remains the decisive enabler for customers that lack upfront capital yet require rapid capacity expansion.
Key Report Takeaways
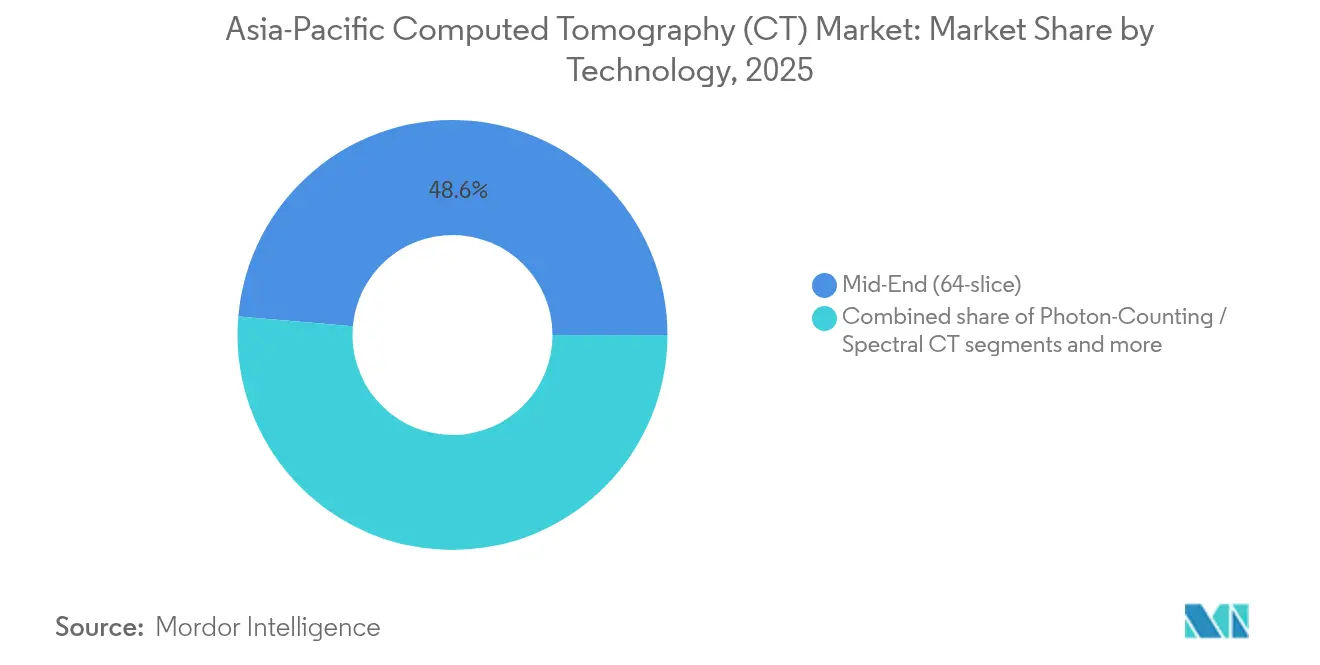
- By technology, 64-slice scanners led with 48.62% of the Asia-Pacific Computed Tomography (CT) market share in 2025, whereas photon-counting and other spectral systems are forecast to post the highest CAGR at 7.02% through 2031.
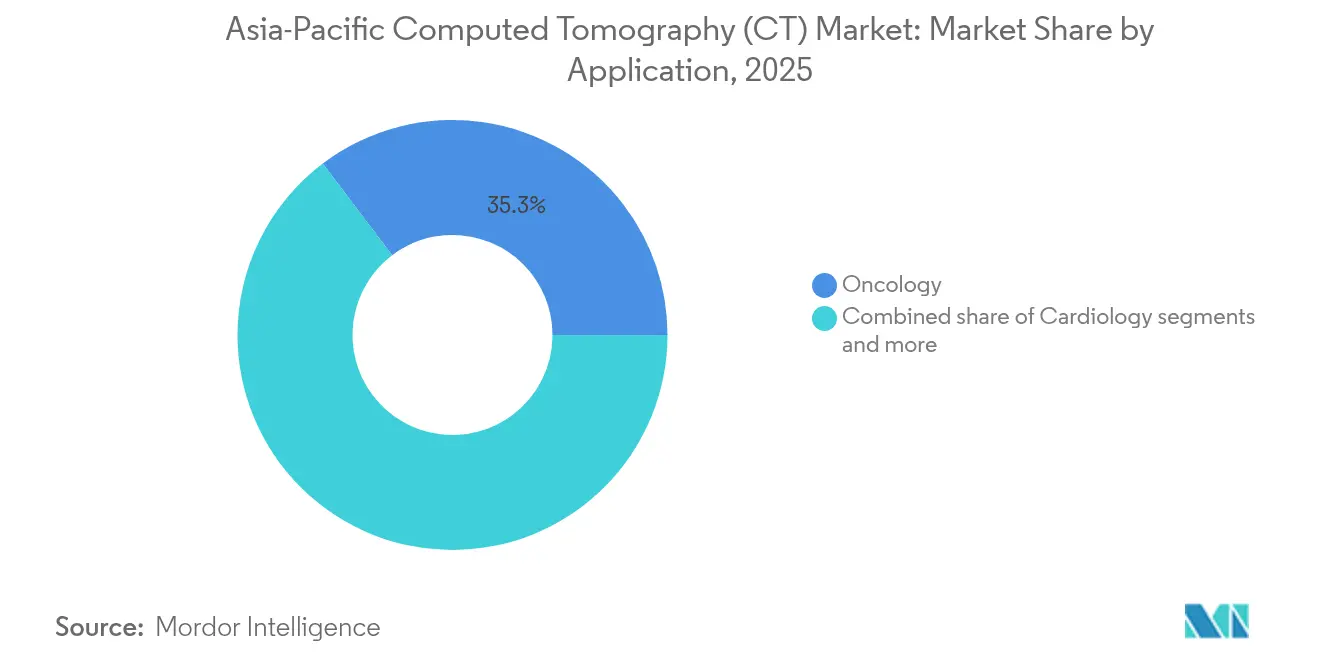
- By application, oncology accounted for a 35.31% share of the Asia-Pacific Computed Tomography (CT) market size in 2025; cardiology is set to expand at a 7.28% CAGR to 2031.
- By end-user, hospitals held 54.05% of the Asia-Pacific Computed Tomography (CT) market in 2025, while private hospitals are projected to register a 7.26% CAGR over the same horizon.
- By product type, stationary systems controlled 76.20% revenue in 2025; portable scanners are advancing at a 6.84% CAGR on wider point-of-care uptake.
- By country, China remained the single largest revenue contributor in 2025; India is expected to log the fastest six-year growth owing to 20% capital subsidies and lower import duties on key components.
Note: Market size and forecast figures in this report are generated using Mordor Intelligence’s proprietary estimation framework, updated with the latest available data and insights as of 2026.
Asia-Pacific Computed Tomography (CT) Market Trends and Insights
Drivers Impact Analysis*
| Driver | (~) % Impact on CAGR Forecast | Geographic Relevance | Impact Timeline |
|---|---|---|---|
| Aging population & chronic-disease burden surge | +1.8% | Global APAC, strongest in Japan, South Korea, China | Long term (≥ 4 years) |
| Government imaging-equipment subsidy programs (China, India) | +1.2% | China, India with spillover to Southeast Asia | Medium term (2-4 years) |
| Hospital upgrade cycle from 16/32-slice to ≥64-slice systems | +1.0% | China, India, Southeast Asia core markets | Medium term (2-4 years) |
| Surge in cardiac CT angiography post-2024 guideline changes | +0.8% | Global APAC, early adoption in Singapore, Japan | Short term (≤ 2 years) |
| OEM trade-in schemes accelerating spectral/photon-counting installs | +0.6% | Developed APAC markets, urban centers | Short term (≤ 2 years) |
| Domestic OEM financing for lower-tier city roll-outs | +0.5% | China, India tier-2/3 cities, rural expansion | Medium term (2-4 years) |
| Source: Mordor Intelligence | |||
Aging Population & Chronic-Disease Burden Surge
Rising life expectancy in Japan, South Korea, and urban China is shifting the disease profile toward oncology, cardiovascular, and neurodegenerative disorders that depend on cross-sectional imaging for diagnosis and treatment monitoring. National cancer-screening campaigns have broadened CT access in secondary cities, while diabetes-related vascular complications are increasing abdominal and peripheral CT angiography studies in India. Radiology departments therefore budget for higher-performance scanners that permit multi-phase protocols within a single breath-hold and deliver thin-slice reconstructions suitable for AI decision-support tools. Dose-optimization guidance from Australia’s ARPANSA is also influencing protocol standardization across the region, reinforcing the need for detector advancements and iterative reconstruction engines that can maintain image quality while lowering patient exposure.
Government Imaging-Equipment Subsidy Programs (China, India)
China’s “Made in China” procurement directive links public-tender eligibility to local manufacturing, favoring domestic vendors that package scanners with multi-year service contracts and staff training. India’s Production-Linked Incentive scheme offers a 20% capital subsidy on CT-scanner components and retains a 5% concessional customs duty on X-ray tubes through March 2025, reducing total landed cost for assemblers. These initiatives compress payback periods for hospitals and drive cluster-based manufacturing investments that shorten lead times for export customers in Southeast Asia.
Hospital Upgrade Cycle from 16/32-Slice to ≥64-Slice Systems
Ealry installations are reaching end-of-life, pushing administrators to evaluate trade-in offers that bundle new scanners with predictable service plans. Replacement demand is strongest in metropolitan China and tier-1 Indian cities where daily scan volumes exceed 50 patients per system. OEMs now position 64-slice models as the “minimum viable platform,” stressing their readiness for spectral upgrades and AI applications. This mid-tier refresh results in higher average selling prices yet leaves a well-maintained secondary-market inventory that can be redeployed into rural outreach programs.
Surge in Cardiac CT Angiography Post-2024 Guideline Changes
The Society of Cardiovascular Computed Tomography’s 2024 consensus transformed coronary CT angiography from a qualitative to a quantitative modality, prompting insurance payors in Singapore and Japan to reimburse software-based plaque analysis. Scanner demand thus pivots to systems capable of sub-0.3-second rotation times and dual-energy acquisition. Vendors additionally promote tube-current-modulation features and wide-detector arrays that capture the entire heart in a single beat, critical for arrhythmia cases
Restraints Impact Analysis*
| Restraint | (~) % Impact on CAGR Forecast | Geographic Relevance | Impact Timeline |
|---|---|---|---|
| High service-contract & X-ray-tube replacement costs | -0.9% | Global APAC, acute in cost-sensitive markets | Long term (≥ 4 years) |
| Uneven reimbursement outside Tier-1 APAC cities | -0.7% | China, India, Southeast Asia rural/suburban | Medium term (2-4 years) |
| CT-radiation dose cap proposals in Australia & Japan | -0.4% | Australia, Japan with regional influence | Medium term (2-4 years) |
| Refurbished-scanner imports eroding new-system demand | -0.6% | Price-sensitive APAC markets, emerging economies | Short term (≤ 2 years) |
| Source: Mordor Intelligence | |||
High Service-Contract & X-Ray-Tube Replacement Costs
Annual service fees range from USD 42,000 for entry-level systems to more than USD 100,000 for ≥64-slice models, an outlay that many mid-size hospitals struggle to recoup under fixed patient tariffs. Tube failure remains the single largest unplanned cost; a replacement assembly for a 64-slice platform typically lists above USD 100,000. Some hospitals negotiate risk-sharing service plans that cap downtime penalties, yet others postpone upgrades altogether, stimulating a refurbished-scanner channel that offers 30–50% up-front savings.
Uneven Reimbursement Outside Tier-1 APAC Cities
National health-insurance programs in China and India reimburse CT procedures at rates calibrated for public hospitals in capital regions, leaving suburban and rural facilities with margins too thin to justify premium equipment. Consequently, newer scanners cluster in megacities, while patients in peripheral zones depend on mobile units or transport to urban centers, delaying diagnosis and limiting revenue growth for OEMs.
*Our forecasts treat driver/restraint impacts as directional, not additive. The impact forecasts reflect baseline growth, mix effects, and variable interactions.
Segment Analysis
By Technology: Mid-End Dominance, Spectral Momentum Picks Up
Mid-range 64-slice scanners held 48.62% of the Asia-Pacific Computed Tomography (CT) market in 2025, reflecting broad compatibility with oncology, trauma, and pulmonary indications. Hospitals regard this class as the baseline for forward compatibility with cardiac workflows, balancing capex against insurance coverage thresholds. Photon-counting and other spectral platforms are forecast at a 7.02% CAGR to 2031 as Japan and Singapore validate superior calcium-scoring reproducibility and dose reductions of up to 40%. Early adopters leverage OEM trade-in credits to temper the premium, repurposing outgoing scanners into satellite clinics. At the opposite end, sub-64-slice systems lose share each year because government tenders in China and Malaysia now stipulate ≥64-slice capability as a minimum eligibility criterion. High-slice (≥128) configurations fill a premium niche in pediatric and cardiovascular centers where wide detector arrays shorten breath-hold times and mitigate motion artifacts; their installed base is expanding 5–6 percentage points per annum in tertiary facilities.
Trading dynamics revolve around bundled AI software that automates bone subtraction, lung-nodule quantification, and metal-artifact reduction. These features prolong the useful life of mid-end scanners and ease the transition toward spectral imaging by offering incremental clinical value without immediate detector upgrades. OEMs also position subscription-based algorithm libraries that transform conventional 64-slice hardware into provisional dual-energy systems, preserving account loyalty ahead of full photon-counting conversion.

By Application: Oncology Holds Lead While Cardiology Accelerates
Oncology maintained the largest share at 35.31% in 2025, buoyed by lung-cancer screening mandates in China and rising PET-CT hybrid referrals that necessitate complementary contrast CT. Routine staging protocols, encompassing chest, abdomen, and pelvis, keep utilization rates high even in resource-limited settings. Still, cardiology is the fastest-growing vertical at a 7.28% CAGR, propelled by guideline-endorsed CT angiography and widening reimbursement for calcium scoring packages. Hospitals now seek scanners capable of single-beat whole-heart coverage, integrated ECG gating, and AI-driven stenosis quantification. These technical requirements narrow vendor options and elevate the average deal size, increasing overall revenue contribution from cardiac imaging despite its smaller case volume. Neurology benefits from portable CT installations in mobile stroke units, aligning with regional pre-hospital care initiatives that prioritize rapid door-to-needle times. Musculoskeletal imaging maintains steady demand in sports-medicine clinics across Australia and South Korea, leveraging low-dose protocols that safeguard pediatric and athlete cohorts.
Growing subspecialization drives hospitals to negotiate multi-scanner packages that allocate oncology workloads to 64-slice rooms while reserving spectral or photon-counting suites for coronary and perfusion studies. This case-mix optimization maximizes scanner throughput and accelerates return on investment. Software ecosystems further segment applications; for example, AI-based lung-nodule follow-up modules secure oncology revenue streams, whereas plaque-quantification suites capture cardiology workflows, fostering brand lock-in.
By End-User: Hospitals Retain Majority, Private Chains Outpace Public Installations
Hospitals commanded 54.05% of the Asia-Pacific Computed Tomography (CT) market in 2025, and their purchasing committees increasingly favor long-term managed-equipment services over outright capital purchases to stabilize maintenance costs. Private hospital groups are projected to expand at a 7.26% CAGR as investors target cash-pay medical tourism in Thailand, Malaysia, and India. These for-profit operators differentiate through premium imaging suites encompassing photon-counting CT, 3 Tesla MRI, and hybrid operating rooms, thereby elevating average revenue per occupied bed. Diagnostic imaging centers compete on patient convenience and turnaround time, deploying mid-end scanners in malls and transport hubs to capture outpatient traffic. Ambulatory surgery centers selectively add 32-slice scanners for intra-operative guidance during orthopedic and spinal procedures, though volumes remain modest relative to hospital demand.
Shifting payer mixes stimulate divergent procurement models: public facilities rely on multilateral loans or donor financing—such as the Islamic Development Bank’s EUR 803 million SIHREN project—to acquire bulk stationary units, whereas private chains use operating-lease structures to refresh scanners every five to seven years. This heterogeneity enables OEM segmentation strategies that bundle service tiers, training, and AI licenses according to site type, extracting higher lifetime value from private customers while retaining volume commitments from the public sector.
By Product Type: Stationary Platforms Dominate, Portable Growth Remains Niche but Persistent
Stationary systems retained 76.20% revenue in 2025 owing to superior gantry aperture, high-power generators, and multi-energy options essential for comprehensive oncology and cardiac studies. Hospitals allocate dedicated rooms with lead shielding and HVAC infrastructure, reinforcing the installed-base advantage of fixed scanners. Portable CT units, though starting from a smaller base, are growing at a 6.84% CAGR as stroke ambulances, intensive-care wards, and battlefield trauma centers require imaging at the point of care. These scanners feature 16–32 slices, lightweight carbon-fiber gantries, and battery or generator power sources that allow deployment without reinforcing floors. Accuracy and image quality have improved sufficiently for triage and follow-up exams, but portable units remain supplementary rather than substitutive.
Manufacturers now market modular service contracts that rotate portable gantries across locations, smoothing utilization and minimizing idle time. In China, county-level hospitals employ mobile CT buses equipped with 64-slice scanners to deliver lung-cancer screening to remote villages, funded by provincial public-health budgets. Meanwhile, Australia’s Royal Flying Doctor Service is piloting collapsible CT pods capable of air-transport, widening the geographical reach of trauma imaging. Although portable systems are unlikely to displace stationary rooms in high-volume centers, their strategic value in tele-radiology networks and disaster-response frameworks underpins steady demand
Geography Analysis
China preserved its leadership position in the Asia-Pacific Computed Tomography (CT) market during 2024 through domestic procurement policies that favor locally manufactured systems. United Imaging and other home-grown vendors secured multi-year supply contracts with provincial hospital alliances, benefiting from shortened delivery schedules and integrated financing packages. Urban tertiary hospitals in Beijing, Shanghai, and Guangzhou accelerated replacements toward ≥128-slice and photon-counting configurations, whereas county hospitals favored cost-optimized 64-slice models bundled with five-year service. Concurrently, OEM-backed leasing worth RMB 31 million aided private orthopedic centers in northern provinces, underscoring financing as a key adoption lever.
India is emerging as the fastest-expanding market following its 20% capital subsidy on CT-scanner components and concessional import duties on X-ray tubes. Domestic assemblers leverage these incentives to supply 64-slice systems at prices 15–20% below imported equivalents, making advanced imaging more accessible to tier-2 cities. Rising lifestyle diseases fuel scan volumes, while increasing private-insurance penetration elevates patient willingness to pay for lower-dose and cardiac-optimized protocols. Public-private-partnership models in several states outsource radiology services to private operators, guaranteeing minimum scan volumes and ensuring predictable cash flows that make equipment financing viable.
Japan and South Korea remain premium-technology early adopters given their stringent quality standards and mature reimbursement schemes. Photon-counting CT has completed more than 1,800 clinical cases at a single Singaporean hospital, catalyzing interest across other developed APAC markets. Australia’s dose-cap proposals from ARPANSA are shaping specification criteria, pushing hospitals toward scanners with real-time organ-dose tracking. Smaller Southeast Asian economies are importing refurbished 64-slice systems for provincial hospitals while reserving new purchases for national referral centers, illustrating a two-tier technology diffusion pattern that continues to widen overall regional unit growth.
Regulatory Landscape
Asia-Pacific CT commercialization operates through country-specific medical device regulators, including China’s National Medical Products Administration (NMPA), Japan’s Pharmaceuticals and Medical Devices Agency (PMDA), South Korea’s Ministry of Food and Drug Safety (MFDS), and ASEAN national authorities such as Malaysia’s Medical Device Authority (MDA) and Thailand’s Thai FDA. Malaysia MDA and the Thai FDA jointly moved to implement a full Medical Device Regulatory Reliance Programme for Class B, C, and D devices on 1 May 2026, which is designed to support faster access to established-device dossiers and reduce duplicative review burdens for multi-market launches.
Quality-system and manufacturing compliance requirements are also tightening for exporters and local assemblers. MFDS published an English compilation of Korea’s Medical Device GMP regulations in February 2026, improving interpretability for multinational manufacturers and contract partners. China’s NMPA has communicated an updated medical device GMP framework with a scheduled effective date in November 2026, broadening compliance expectations across manufacturing and marketing authorization structures. Together, these updates raise the importance of ISO-aligned QMS, audit readiness, and post-market documentation for CT OEMs and their local manufacturing and service ecosystems.
Value Chain Analysis
The CT value chain in Asia-Pacific begins with tightly controlled upstream inputs (X-ray tubes, detectors, high-voltage generators, gantry motion systems, and reconstruction software), where critical components and specialty materials remain concentrated among a limited pool of global suppliers. OEMs increasingly localize selected manufacturing steps to meet domestic procurement rules and shorten lead times: GE HealthCare brought a highly automated, lights-out CT detector production line online at its Beijing base in April 2024, and in June 2025 PT Kalbe Farma Tbk and GE HealthCare inaugurated Indonesia’s first CT scanner production facility at PT Forsta Kalmedic Global in Bogor, creating an in-region assembly node aligned with national localization priorities.
Midstream activities include system integration, regulatory registration, and channel execution through direct sales to large hospital groups and tenders, alongside distributors and managed-equipment service models that bundle installation, applications training, and multi-year service. Downstream, lifetime economics are shaped largely by service-contract coverage and X-ray tube replacement cycles, making parts logistics, field service capability, and uptime guarantees key differentiators. Supply continuity remains sensitive to logistics and energy-cost shocks, with reported carrier diversions and longer transit times for high-value components adding friction, which supports OEM moves toward multisourcing, selective localization, and tighter distributor governance across Southeast Asia.
Competitive Landscape
Market competitiveness centers on detector innovation, integrated AI, and flexible ownership models rather than headline list prices. Siemens Healthineers leads the photon-counting race after securing FDA clearance for the NAEOTOM Alpha.Pro and Alpha.Prime, widening its spectral portfolio. Canon Medical and GE HealthCare are accelerating their own photon-counting roadmaps, while Philips commercializes deep-learning reconstruction across existing detector architectures to hedge against technology transitions. Local champions such as United Imaging capitalize on government sourcing rules to gain share and have started exporting 128-slice scanners to Southeast Asia, challenging incumbents with feature-comparable yet lower-priced offerings.
Financing is now a primary battleground. OEM leasing arms structure seven-year operating leases with step-up payments tailored to projected patient volumes, reducing front-loaded cash requirements. In India, non-bank finance firms lend up to INR 8 million for CT purchases with 48-hour disbursal, shortening acquisition cycles. Service differentiation further sharpens competition: Philips promotes circular-economy refurbishments that guarantee part availability, while GE HealthCare bundles predictive-maintenance analytics to cut unplanned downtime by up to 25%. These service propositions create switching costs that rival upfront discounts.
Regulatory compliance and local assembly have become entry tickets rather than strategic advantages. All major vendors now operate ISO-certified facilities in either China or India, integrate cybersecurity features to meet Japan’s personal-data standards, and maintain regional training centers. Consequently, sustained leadership will hinge on successful photon-counting commercialization, AI-driven workflow orchestration, and ecosystem partnerships that harmonize imaging with longitudinal patient data in emerging digital-health platforms.
Asia-Pacific Computed Tomography (CT) Industry Leaders
-
Canon Medical Systems Corporation
-
GE Healthcare
-
Koninklijke Philips NV
-
Siemens Healthineers
-
Hitachi Healthcare Systems
- *Disclaimer: Major Players sorted in no particular order
_Market.webp)
Market Opportunities and Future Outlook
Photon-counting and spectral CT adoption is moving from early validation into country-specific commercialization pathways, which opens room for premium installations in tertiary centers and private chains that want stronger differentiation on oncology and cardiac workflows. In Japan, Canon Medical Systems launched Ultimion in April 2026 as the country’s first domestically produced photon-counting CT, with clinical research underway at National Cancer Center Hospital East (Chiba), providing a local supply-and-evidence base for scaling PCCT in advanced-care networks. In China, Siemens Healthineers received NMPA approval in June 2026 for a China-made dual-source photon-counting CT (NAEOTOM Alpha.Pro) manufactured at its Shanghai R&D and production base, aligning high-end technology with domestic sourcing expectations that influence public tenders.
Cancer-care pathways and protocol standardization also support opportunities for higher-throughput, software-rich CT configurations beyond basic slice-count upgrades. Philips partnered with ACTREC and Tata Memorial Centre in India (March 2026) to introduce Spectral CT 7500 for cancer diagnostics, showing how OEM-hospital collaborations can support premium platform pull-through through clinical programs, training, and advanced applications. At the same time, reliance programs and digitized submissions reduce administrative friction for multi-market rollouts across the region. Upcoming manufacturing compliance requirements, including China’s updated medical device GMP effective in November 2026, further raise the value of locally compliant production footprints and structured service ecosystems that support long-term uptime and audit-ready documentation.
Recent Industry Developments
- June 2026: Siemens Healthineers received NMPA approval in China for a China-made dual-source photon-counting CT system (NAEOTOM Alpha.Pro) manufactured at its Shanghai research and production base. The milestone supports domestic-sourcing tender requirements while bringing a flagship PCCT platform closer to China’s high-volume procurement channels.
- December 2025: Siemens Healthineers reported that Bach Mai Hospital deployed two NAEOTOM Alpha systems, marking the first public-hospital adoption of photon-counting CT in Vietnam. This installation expands PCCT beyond private flagship sites and strengthens referenceability for wider public-sector upgrades in Southeast Asia.
- February 2024: Philips introduced the CT 5300 with Precise Image deep-learning reconstruction at ECR 2024, positioned to lower dose while supporting diagnostic confidence on routine workflows. The launch broadened access to AI-enabled reconstruction on a mainstream CT platform, reinforcing software-driven differentiation alongside hardware slice upgrades.
Research Methodology Framework and Report Scope
Market Definition and Coverage
For this methodology, the Asia-Pacific CT market is defined as revenues generated from computed tomography systems used for diagnostic imaging across the region, counted at the point of sale to end users such as hospitals and diagnostic centers.
Scope exclusions: We exclude imaging services revenue (scan fees), radiology staffing, contrast media, and general hospital IT that is not specific to CT equipment.
Segmentation Overview
- By Technology (Slice Count) – Value
- Low (<64)
- Medium (64)
- High (≥128)
- Cone-Beam CT
- By Application – Value
- Oncology
- Cardiology
- Neurology
- Musculoskeletal
- Others
- By End-User – Value
- Hospitals
- Diagnostic Imaging Centers
- Ambulatory Surgery Centers
- Others
- By Product Type – Value
- Stationary CT
- Portable CT
- By Country – Value
- China
- India
- Japan
- South Korea
- Australia
- Rest of Asia-Pacific
Data Sources, Market Sizing, and Validation
Desk Research
Desk research was used to build the initial market structure and to set realistic bounds for volumes and pricing across major Asia-Pacific countries. We relied on public and official sources such as the World Health Organization, World Bank, OECD health statistics, national health ministries and statistical offices, and radiation safety and medical device regulator publications where available. These sources helped align assumptions around imaging demand drivers, including population aging, chronic disease load, and healthcare access.
To shape the pricing logic and replacement cycle assumptions, we reviewed company filings, investor presentations, annual reports, and import and export trade summaries, along with reputable healthcare press coverage. Where available, we used a paid subscription for company financials and a patent database to cross-check product cycle timing and technology mix shifts that can affect average selling prices. The sources listed here are illustrative only, and other public references were also used during the work for data collection, validation, and clarification.
Primary Interviews and Surveys
Expert interviews and surveys with equipment suppliers, distributors, hospital procurement teams, imaging-center leaders, and radiology managers across Asia-Pacific help test scanner demand, replacement timing, slice preferences, tender pricing, and channel gaps. We use these views to validate secondary data, adjust country assumptions, and triangulate the final regional model.
Distribution of primary research fieldwork respondents
| Company type | Respondent position |
|---|---|
| Top tier: 28% | CXOs: 16% |
| Mid tier: 47% | Functional/Unit leaders: 32% |
| Smaller Players: 25% | Managers: 52% |
Market-Sizing & Forecasting
Sizing started with a top-down approach where country-level imaging demand and installed base signals were reconstructed into likely CT procurement volumes, then converted into value using country-appropriate ASP bands. We used practical indicators such as public health spending trends, hospital and diagnostic center expansion, known replacement cycle ranges, the shift toward 64-slice and above systems in higher acuity sites, and the timing of procurement tenders in large public networks.
We corroborated results with selective bottom-up approximations, such as sampling typical ASP by slice class and multiplying by estimated annual unit placements, then using distributor channel checks to confirm mix changes. When gaps appeared, for example limited visibility on smaller private clinics, we adjusted using conservative adoption ratios derived from primary feedback and anchored them to known facility counts.
For forecasting, scenario analysis was used because policy funding, reimbursement, and tender timing can move year-to-year demand in this market. The scenarios were tied to variables like capital equipment budgets, the pace of healthcare infrastructure buildout, and the expected technology refresh. We then refined the scenarios using the direction and ranges shared by interviewees.
Data Validation & Update Cycle
Model outputs were checked against independent signals such as installed base movement, country procurement news, and reported capital spending patterns, and then outliers were reviewed before final sign-off. If a country showed a sudden jump or dip, we revisited the assumed ASP progression, tender timing, and mix shift toward higher slice systems. Where variance could not be explained from these drivers, we re-contacted select respondents.
Reports are refreshed annually, and interim updates are done when material events occur, such as major policy changes, sharp currency moves, or product cycle shifts that can affect pricing. Before delivery, a final analyst pass is completed so the published numbers reflect the most current assumptions and checks available at that time.
Mordor Intelligence's Asia Pacific Ct Market Size Measured Against Other Published Estimates
Published market sizes for Asia-Pacific CT often do not match because each study uses a different year anchor, applies currency conversion at different points, and assumes a distinct price path for how CT system ASPs change as slice mix shifts. Differences also arise from how strictly the scope limits equipment revenue versus including adjacent items that buyers may bundle with a CT purchase.
In this study, refresh cadence and FX timing were treated as first-order controls so tender-driven volatility is not mistaken for real demand changes. These checks are a key reason the 2025 value lands where it does in Mordor Intelligence.
Benchmark comparison
| Source | Market Size | Gaps in Research Methodology |
|---|---|---|
| Mordor Intelligence | USD 2.47 B (2025) | |
| Industry Data Provider A | USD 2.66 B (2024) | Uses a different base year and may apply a broader price and volume curve across countries, which can pull forward growth when technology upgrades are assumed to happen faster than tenders allow. |
| Regional Publisher B | USD 1.15 B (2025) | Often reflects a narrower equipment boundary or a more conservative ASP assumption, and it can undercount higher slice placements in large hospitals if mix shifts are not validated by channel checks. |
The spread in the table mainly comes from year selection, how ASP progression is handled as mid and high slice systems take share, and whether tender timing and country FX are actively normalized. By keeping assumptions traceable to observable procurement signals and confirming them through interviews, the resulting estimate is practical to reproduce and easier to explain when clients want to pressure-test the numbers.
Key Questions Answered in the Report
How large is the Asia-Pacific Computed Tomography (CT) market in 2026?
It reached USD 2.62 billion in 2026 and is forecast to hit USD 3.53 billion by 2031.
Which technology segment leads unit shipments?
64-slice scanners command nearly half of current shipments, balancing cost with multipurpose capability.
What drives the fastest growth within applications?
Cardiac CT angiography is expanding quickest after 2024 guideline revisions that standardized quantitative plaque assessment.
Why are private hospitals outpacing public facilities in new purchases?
Private chains leverage higher self-pay volumes and flexible leasing to refresh fleets every five to seven years, capturing premium imaging demand.
How are governments influencing procurement?
China mandates local manufacturing in public tenders, while India offers a 20% capital subsidy and lower customs duties on key components, both reducing acquisition costs.
What is the outlook for portable CT systems?
Portable scanners remain a small share today but are advancing at 6.84% annually as stroke ambulances and ICU deployment models prove clinical utility.