
Market Overview
| Study Period | 2020 - 2031 |
|---|---|
| Forecast Data Period | 2026 - 2031 |
| Base Year Market Size (2025) | USD 4.23 Billion |
| Market Size (2026) | USD 4.51 Billion |
| Market Size (2031) | USD 6.18 Billion |
| Growth Rate (2026 - 2031) | 6.50% CAGR |
| Market Concentration | Medium |
Major Players *Disclaimer: Major Players sorted in no particular order Image © Mordor Intelligence. Reuse requires attribution under CC BY 4.0. | |
Asia-Pacific Conveyors Market Analysis by Mordor Intelligence
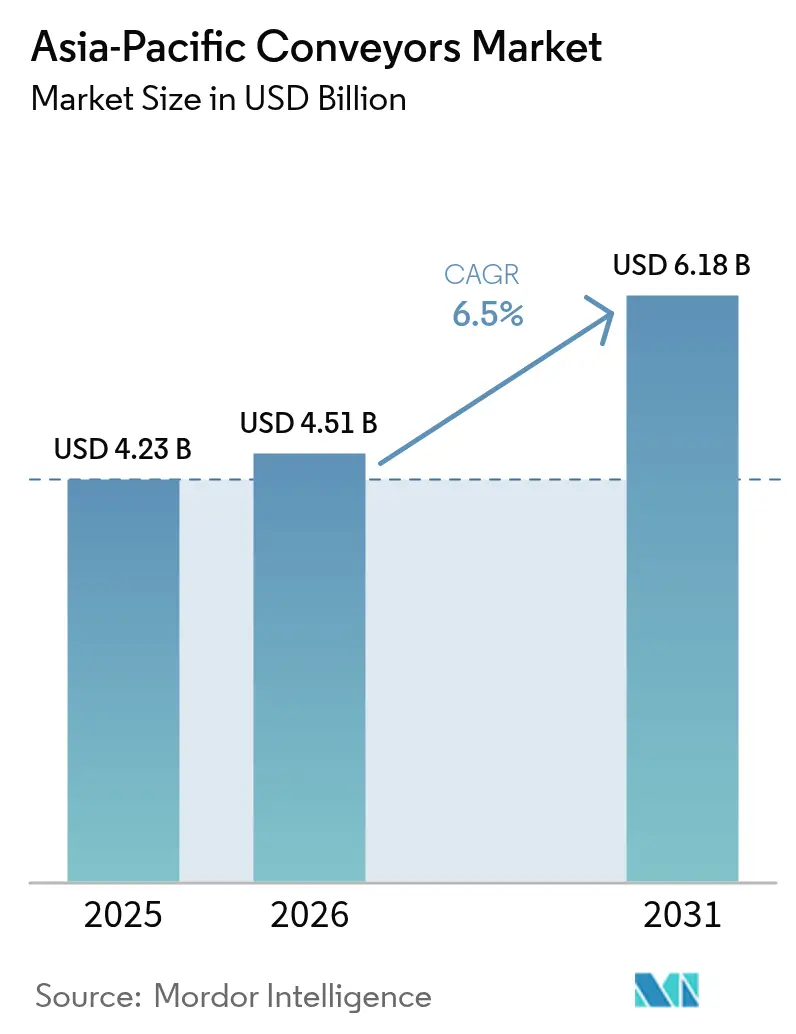
The Asia-Pacific conveyors market size is expected to grow from USD 4.23 billion in 2025 to USD 4.51 billion in 2026 and is forecast to reach USD 6.18 billion by 2031 at 6.50% CAGR over 2026-2031. This expansion mirrors the accelerating migration from manual to automated material-flow systems, especially in e-commerce facilities that now guarantee sub-24-hour delivery in tier-2 and tier-3 cities. National programs such as China’s Digital Highway and India’s PM Gati Shakti are redirecting logistics capital toward intermodal hubs where conveyor throughput dictates network velocity, while pharmaceutical cold-chain retrofits in Singapore and Australia, mining belt upgrades in Indonesia, and micro-fulfillment build-outs across Malaysia add incremental demand. Competitive pressures from lower-cost Chinese OEMs are spurring European integrators to differentiate through software and lifecycle services, and a 22% jump in patent filings for energy-recuperative drives and predictive belt-wear algorithms underscores the pivot toward digital twins and condition monitoring. Tariff volatility on specialty rubber and steel cord, coupled with technician shortages in Indonesia and the Philippines, remains a drag, yet leasing models and modular platforms are softening capital barriers for small and medium enterprises.
Key Report Takeaways
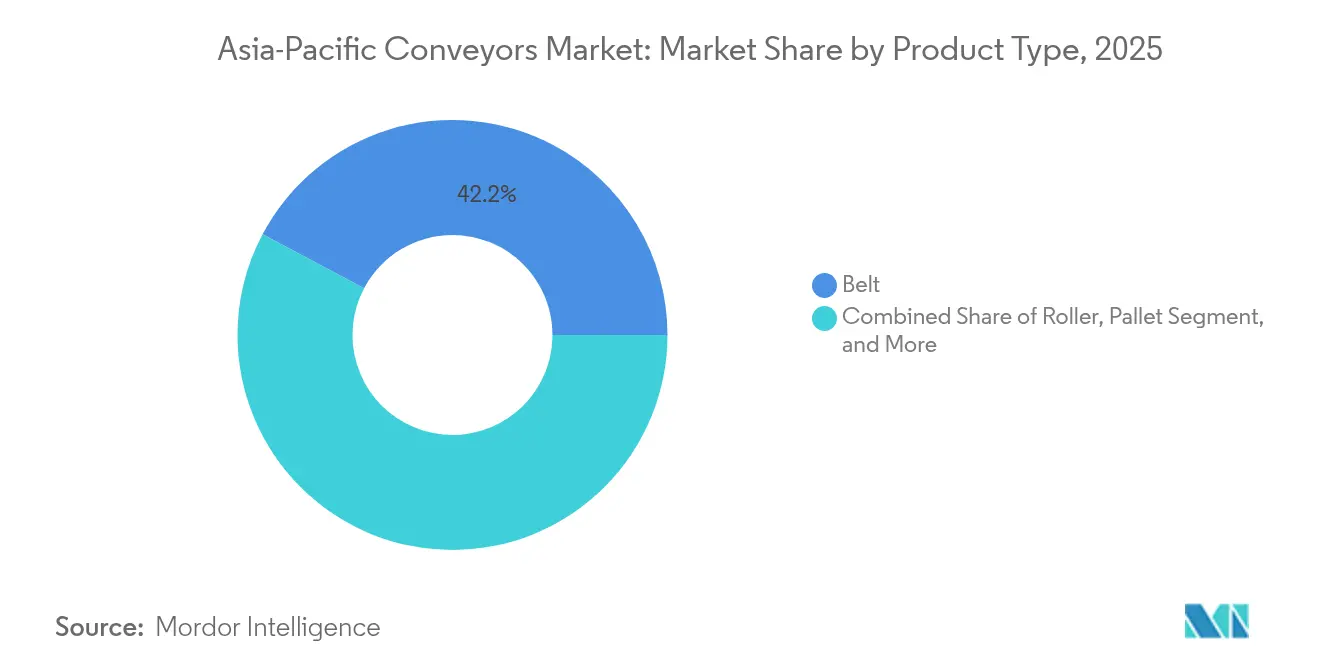
- By product type, belt conveyors led with 42.24% of the Asia-Pacific conveyors market share in 2025, while overhead systems are forecast to expand at a 7.12% CAGR through 2031.
- By installation type, floor systems accounted for 60.12% of the Asia-Pacific conveyors market in 2025; overhead installations are projected to register a 7.45% CAGR to 2031.
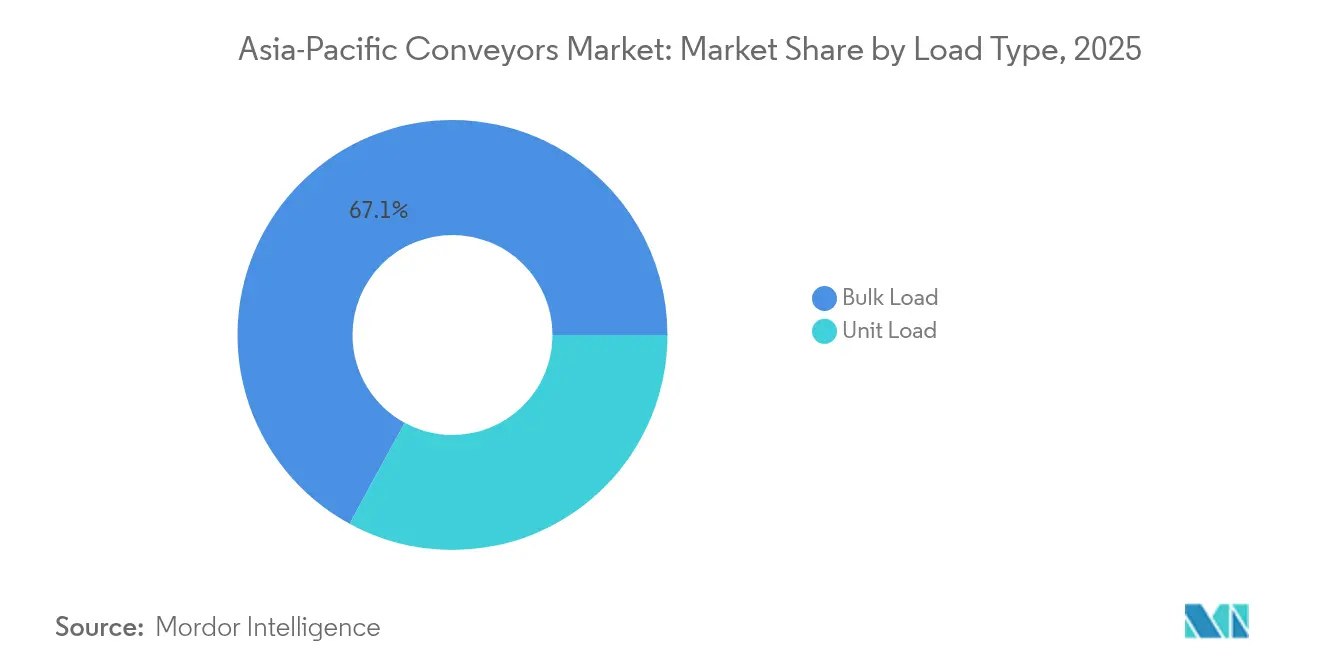
- By load type, bulk-load handling dominated with 67.05% of 2025 throughput of the Asia-Pacific conveyors market; unit-load conveyors are on track for a 7.60% CAGR between 2026 and 2031.
- By end user, retail and e-commerce accounted for 31.40% of the revenue in 2025 of the Asia-Pacific conveyors market, whereas pharmaceuticals represented the fastest trajectory, growing at a 6.95% CAGR to 2031.
- By Country, China accounted for 34.40% of the revenue in 2025 of the Asia-Pacific conveyors market, and is expected to have the fastest trajectory, growing at a 7.15% CAGR to 2031.
Note: Market size and forecast figures in this report are generated using Mordor Intelligence’s proprietary estimation framework, updated with the latest available data and insights as of 2026.
Asia-Pacific Conveyors Market Trends and Insights
Drivers Impact Analysis*
| Driver | (~) % Impact on CAGR Forecast | Geographic Relevance | Impact Timeline |
|---|---|---|---|
| Rapid e-commerce warehouse expansion across Asia-Pacific | +1.8% | China, India, Southeast Asia (Indonesia, Thailand, Vietnam), Australia | Short term (≤ 2 years) |
| Manufacturing sector automation and Industry 4.0 investments | +1.5% | China, Japan, South Korea, India, Thailand | Medium term (2-4 years) |
| Government logistics-infrastructure modernization programs | +1.2% | India, China, Vietnam, Indonesia, Singapore | Medium term (2-4 years) |
| Rising labor costs prompting adoption of automated handling | +1.0% | China, Singapore, Malaysia, Thailand | Short term (≤ 2 years) |
| Micro-fulfillment retrofits in tier-2/3 Asian cities | +0.7% | India, China, Indonesia, Philippines | Medium term (2-4 years) |
| Carbon-reduction mandates favoring energy-efficient conveyors | +0.5% | Japan, South Korea, Singapore, Australia | Long term (≥ 4 years) |
| Source: Mordor Intelligence | |||
Rapid E-commerce Warehouse Expansion Across Asia-Pacific
Same-day and next-day shipping commitments are prompting parcel operators to install high-speed cross-belt sorters and multi-kilometer conveyor spines even in secondary markets where wage arbitrage once offset manual handling. Coupang added three Korean fulfillment centers in 2024, each capable of processing 12,000 parcels per hour, utilizing overhead conveyors that integrate with autonomous mobile robots.[1]Coupang, “Corporate Overview,” ir.coupang.com JD Logistics has opened eight automated regional hubs in China that utilize a combination of overhead belts and mobile robots to achieve 2-hour delivery windows. Daiso’s 1 million ft² Nilai facility in Malaysia runs 4.2 km of belts to move 1.2 million cartons weekly, lowering manual lifts by 68%. In Australia, Woolworths and Coles invested AUD 800 million in automated centers that cut order-to-dispatch cycles from 48 hours to 18 hours. Together, these projects amplify baseline demand in the Asia-Pacific conveyors market and solidify conveyors as mission-critical infrastructure for last-mile logistics.
Manufacturing Sector Automation and Industry 4.0 Investments
Asia installed 415,400 industrial robots in 2024, 73% of global volume, embedding conveyors as the connective tissue for robotic pick-and-place, inspection, and packaging tasks.[2]International Federation of Robotics, “World Robotics 2024,” ifr.org Toyota Industries’ Kariya plant integrated modular chain conveyors with RFID readers to trace 18,000 components per shift at 99.8% accuracy. Vietnam’s digital-economy roadmap targets USD 30 billion in manufacturing exports by 2025, drawing foreign automation capex where conveyor uptime is tied directly to yield. Thailand’s Board of Investment fast-tracked 42 smart-factory projects worth THB 86 billion in 2024, earmarking up to 22% for material-handling systems BOI.GO.TH. Such moves keep the Asia-Pacific conveyor market on a technology-refresh cycle aligned with Industry 4.0 mandates.
Government Logistics-Infrastructure Modernization Programs
India’s PM Gati Shakti plan is orchestrating 16 ministries to reduce logistics costs to 8% of GDP by 2030, specifying automated cargo handling at new multimodal parks.[3]Government of India, “PM Gati Shakti National Master Plan,” pmindia.gov.in China’s 14th Five-Year Plan allocates CNY 2.5 trillion to smart logistics hubs that require high-efficiency conveyor assets. Singapore’s Smart Nation push has invested SGD 1.2 billion in port and airport automation; Changi Terminal 5 will feature tilt-tray sorters that can handle 10,800 bags per hour. Vietnam’s SuperPort Cần Thơ, due 2026, will operate 8.5 km of conveyors to move 3 million TEUs a year, shrinking truck dwell time by 40%. These projects enlarge the public-sector slice of the Asia-Pacific conveyors market, assuring multi-year order visibility.
Rising Labor Costs Prompting Automated Handling
Average Chinese factory wages increased by 7.8% in 2024 to CNY 8,200 per month, and Singapore warehouse pay reached SGD 2,800, eroding the economics of manual sortation. Malaysia’s minimum wage rose to MYR 1,500 in 2024, nudging logistics firms toward belts and goods-to-person modules that hold per-parcel costs below USD 2. Thailand’s workforce participation slipped to 66.4% as aging thins the labor pool, intensifying the adoption of lights-out sortation hubs. AutoStore responded by opening a 150,000 ft² factory in Thailand to localize grid and conveyor production, trimming total cost of ownership by 25%. Labor dynamics, therefore, reinforce the automation case across the Asia-Pacific conveyor market.
Restraints Impact Analysis*
| Restraint | (~) % Impact on CAGR Forecast | Geographic Relevance | Impact Timeline |
|---|---|---|---|
| High initial capital expenditure for advanced systems | -0.9% | India, Indonesia, Philippines, Vietnam, Thailand | Short term (≤ 2 years) |
| Skilled maintenance workforce shortage | -0.6% | Indonesia, Philippines, Vietnam, India | Medium term (2-4 years) |
| Space constraints in dense urban warehouses | -0.4% | Singapore, Hong Kong, Tokyo, Seoul | Short term (≤ 2 years) |
| Import-tariff volatility on specialty rubber and steel cord | -0.3% | China, India, ASEAN countries | Medium term (2-4 years) |
| Source: Mordor Intelligence | |||
High Initial Capital Expenditure for Advanced Systems
Turnkey automated centers spanning 200,000 ft² can cost USD 8 million–25 million once sorters and software are included, a hurdle for small firms in India or Indonesia. Interroll’s RollerDrive lets users install 25% of planned capacity upfront and expand later, easing cash pressure. Dematic piloted a pay-per-pick model in India that shifts investment to opex at USD 0.12–0.18 per unit handled. Nevertheless, import duties that reach 15% in Indonesia inflate component prices, and opaque ownership-cost calculations leave new adopters facing utilization rates below 65% in the first 18 months.
Skilled Maintenance Workforce Shortage
Conveyors now integrate PLCs, VFDs, and IoT sensors, yet vocational programs in Indonesia and the Philippines lag demand for mechatronics talent. Attrition rates above 18% fuel wage inflation and employee poaching. Siemens’ MindSphere remote-diagnostic suite, live in 18 Southeast-Asian warehouses, cuts mean-time-to-repair 42% by guiding on-site staff via augmented reality.[4]Siemens, “MindSphere Industrial IoT,” siemens.com Still, ISO 5048 and IEC 60204-1 compliance demands certified technicians, and the talent gap constrains the Asia-Pacific conveyors market rollout pace.
*Our forecasts treat driver/restraint impacts as directional, not additive. The impact forecasts reflect baseline growth, mix effects, and variable interactions.
Segment Analysis
By Product Type: Overhead Systems Gain Altitude
Overhead conveyors are forecast to grow at 7.12% CAGR to 2031, the quickest among product categories, as automotive and electronics lines value floor clearance for robots and inspection stations. Yuanda’s monorails, which can carry 50–150 kg at 30 m/min, have been installed at 14 Chinese auto plants to align paint-shop flow with assembly. SSI Schäfer’s RackBot platforms in Japanese electronics sites achieve densities of 30,000 totes per 1,000 m². Belt systems still commanded 42.24% of 2025 revenue by serving long-haul mining and food-processing applications, and they anchor much of the Asia-Pacific conveyors market size in the heavy bulk segment.
Belt installations persist in Australia’s Pilbara, where Big Roller’s overland designs aim for 60% lower energy loss. Fenner’s iBelt gauge uses ultrasonics to predict belt wear and has cut unscheduled stoppages 28% in iron-ore operations. Roller conveyors remain the workhorse of parcel handling, while pallet and chain designs address the needs of cold storage and harsh processing environments.


By Installation Type: Vertical Real Estate Drives Overhead Adoption
Overhead systems are set for a 7.45% CAGR as urban rents escalate; floor solutions still held 60.12% share in 2025 due to simplicity and heavy-load capability. Singapore’s dense land market has catalyzed overhead retrofits, freeing up ground-level space for kitting. Swisslog’s Vectura cranes in Australian cold stores operate at –28 °C and reach a height of 45 m. In-floor chains stay indispensable on automotive lines where flush transfers remove height transitions.
The Asia-Pacific conveyors market size for overhead systems is poised to widen as micro-fulfillment centers prioritize cubic efficiency. Kardex lifts in New Zealand improved storage 30% with minimal footprint. However, mining still favors broad floor belts up to 2,400 mm wide, and in-floor chains power vehicle bodies through the paint and final assembly stages.
By Load Type: Unit-Load Handling Accelerates
Unit-load conveyors will rise at 7.60% CAGR on e-commerce parcel sortation and pharma tote picking. Bulk-load belts, which account for 67.05% of 2025 revenue, remain irreplaceable for coal and ore, handling thousands of tonnes per hour. HAI Robotics’ LIQUN Pharmaceutical system handles 593 cases per hour with 99.9% accuracy, utilizing conveyors to feed robotic shuttles. Zikoo Robotics’ pharma packaging line improved its capacity 5.5-fold via overhead belts.
Bulk corridors remain critical, BHP’s South Flank operates 41 autonomous trucks that dump into belts feeding port stockpiles. MinRes commissioned a 150-km autonomous haul route integrated with overland belts, resulting in an 18% reduction in haulage costs. Cold-chain and parcel operators push unit-load belts that align with serialization and same-day delivery targets.
By End-User Industry: Pharmaceuticals Lead Growth Trajectory
Pharmaceutical applications will expand at a 6.95% CAGR, driven by serialization mandates and temperature control requirements. Swisslog’s Livzon project couples conveyor networks with pallet cranes to reach 99.8% inventory accuracy. Geo-Young in South Korea operates an AutoStore grid comprising 40,000 bins and 80 robots, resulting in a 92% reduction in picking errors. Singapore’s hospital automation cut patient wait times by 50% with conveyor-based dispensing.
Retail and e-commerce continue to lead in spending, with JD Logistics, Coupang, and Lazada opening 28 automated hubs in 2024. Automotive lines integrate chain belts for just-in-time component feeds, while food-and-beverage cold stores invest in pallet shuttles to manage frozen SKUs. Mining belts remain heavy-duty anchors, and airport baggage systems are rebounding after Daifuku’s Airport Technologies purchase.
Geography Analysis
China anchors the Asia-Pacific conveyors market through its CNY 2.5 trillion logistics budget, which mandates energy-efficient belts at 30 national and 70 regional cold-chain bases. The nation installed 276,400 robots in 2024, each paired with synchronized conveyor flow. Anti-dumping duties on foreign belts have spurred domestic rubber production, while multi-kilometer sorters in JD and Alibaba hubs set new performance benchmarks.
India follows with PM Gati Shakti-driven multimodal parks that stipulate automated handling. Quick-commerce platforms opened 340 dark stores equipped with compact belts to uphold 10-minute delivery. Domestic integrators Godrej Consoveyo and Mahindra Tsubaki win retrofit work by leveraging service proximity.
Australia’s mining sector consumes the longest belts, and retailers such as Woolworths deploy high-throughput systems to shrink dispatch cycles. Indonesia upgrades coal corridors, Tokopedia automates 28 warehouses, and Malaysia’s wage hike accelerates Nilai’s mega center. Singapore’s vacancy pinch drives overhead adoption, South Korea’s Coupang scales 12,000-parcel-per-hour sites, while Taiwan’s Momo boosts Taoyuan to 150,000 daily orders. Vietnam’s SuperPort will soon add 8.5 km of belts to move 3 million TEUs a year.
Regulatory Landscape
Safety and machine-control compliance for conveyors in Asia-Pacific is increasingly tied to updated national and international standards, including ISO 5048 and IEC 60204-1 requirements that show up in procurement and technician certification across Southeast Asia. In April 2025, Standards New Zealand published AS/NZS 4024.3612:2025 for unit handling conveyor systems (aligned to EN 619:2022), while China implemented GB/T 46156-2025 for safety specifications for continuous mechanical handling equipment (via SAMR/SAC), tightening safety documentation expectations for OEMs and integrators.
Trade and conformity pathways are also shifting. In March 2026, Singapore's Ministry of Manpower clarified that vertical lifters in conveyor systems are treated as integral components and are not registered lifting machines under the WSH Act, which affects how facilities classify and manage inspections. India scheduled implementation of the Machinery and Electrical Equipment (Omnibus Technical Regulation) Order, 2024 (OTR 2024) for September 2026, which mandates BIS certification and raises the compliance bar for imported conveyor subsystems. Separately, revised ASEAN machinery HS classifications introduced in June 2026, including treatment of AI-capable control hardware under HS 8537.10.90, increase the importance of value-added accounting to preserve preferential tariff access under ATIGA.
Value Chain Analysis
The value chain starts with upstream inputs such as steel structures, specialty rubber and steel-cord belts, rollers, bearings, motors, VFDs, and PLC/IoT sensors. OEM fabrication and system integration then determine throughput and uptime through layout design, controls engineering, and software commissioning. Price competition from lower-cost Chinese OEMs also increases sourcing pressure on specialty components, while import-tariff volatility on rubber and steel cord remains a recurring constraint in cross-border procurement for ASEAN and India.
Downstream, integrators and end users increasingly favor modular platforms and service-led delivery models, including installation, preventive maintenance, spares, and remote diagnostics. This shift shows up in modular conveyor deployments such as Dematic's January 2026 implementation of a purpose-built modular conveyor system at Bio-Rad Laboratories' distribution hub in Singapore, and in localized product supply such as Dematic's China-manufactured Silky Crossbelt sorter introduced for Asia-Pacific requirements. Logistics and manufacturing adopters are also pairing conveyors with AMRs and MES/AI orchestration, reflected in projects such as SK C&C's AI Conveyance Logistics System (March 2025) and fully automated sites like Eiyu Electronics' unmanned warehouse center in Hong Kong (May 2025), which changes the service mix toward controls tuning, cybersecurity, and lifecycle analytics.
Competitive Landscape
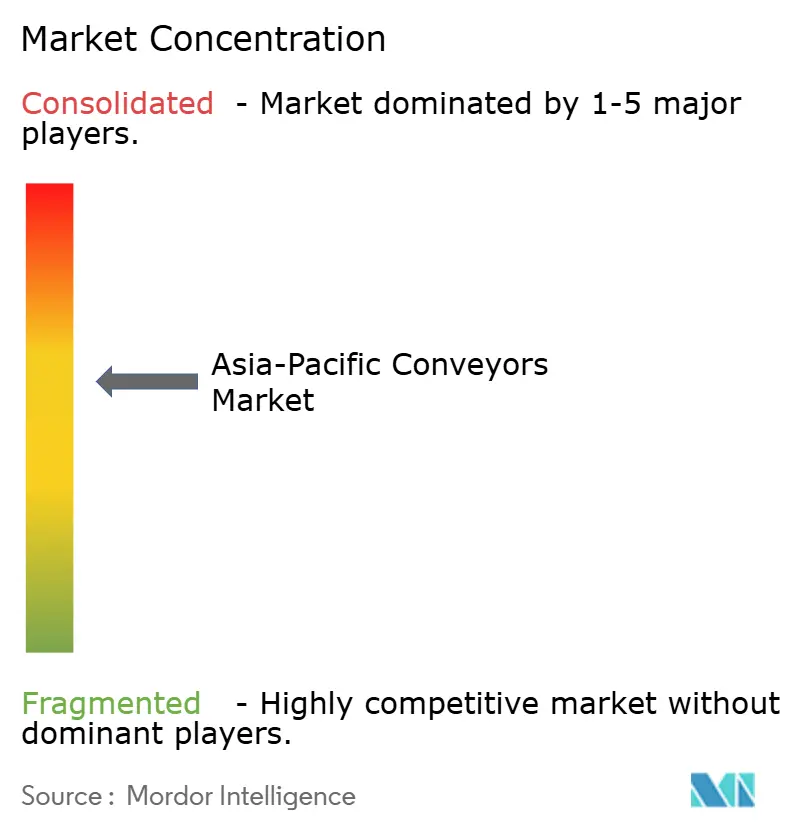
The Asia-Pacific conveyors market shows moderate fragmentation; the top five integrators, Daifuku, Dematic, Vanderlande, SSI Schäfer, and BEUMER, collectively hold roughly 42% share. European incumbents respond to price pressure from Chinese OEMs by bundling software, digital twins, and lifecycle services to lift recurring revenue. Chinese providers undercut capex 30%–40% by offering proven yet mid-tech packages, gaining ground in price-sensitive e-commerce and food-processing segments.
Daifuku acquired Airport Technologies in November 2024, broadening its baggage-handling capabilities, and had previously purchased Contec to deepen its cleanroom conveyor capability for semiconductors and pharmaceuticals. Interroll’s modular RollerDrive attracts SMEs by enabling phased build-outs. Patent filings on IoT belt wear and energy recuperation increased by 22% in 2024, indicating a shift toward specialized controls and analytics.
Regional players, such as Godrej Consoveyo and Mahindra Tsubaki, exploit service proximity to win brownfield upgrades in India, while Japanese and Korean regulations on energy efficiency drive demand for high-spec belts from companies like Forbo, Habasit, and Semperit. ISO 5048 compliance and augmented-reality troubleshooting now influence bid awards, given maintenance-talent shortages in Southeast Asia.
Asia-Pacific Conveyors Industry Leaders
Daifuku Co. Ltd
Murata Machinery, Ltd.
SSI Schaefer AG
Swisslog Holding AG
BEUMER Group GmbH and Co. KG
- *Disclaimer: Major Players sorted in no particular order

Market Opportunities and Future Outlook
White space is emerging for conveyor systems that integrate natively with smart-factory automation, including AI-driven routing, predictive maintenance, and handoffs to AMRs and robotics, particularly as facilities move toward Industry 4.0-style orchestration. Investment signals reinforce this direction, including HD Hyundai Electric opening an automated Cheongju power distribution campus in June 2026 with integrated AMRs and case-handling robots, and FANUC's Phase II smart factory build-out in Suzhou (announced March 2026) incorporating predictive maintenance and AI parameter optimization. These projects keep conveyors in the role of the connecting layer between automated production, warehousing, and outbound distribution.
Opportunities also cluster around compliance-ready and energy-efficient retrofits for dense urban logistics and regulated cold-chain handling, where throughput, safety documentation, and traceability requirements are rising alongside labor constraints. Programs and infrastructure commitments already cited in-market, including India's PM Gati Shakti (automated handling at multimodal parks) and China's 14th Five-Year Plan focus on smart logistics hubs, point to addressable projects favoring modular conveyors, software bundles, and long-term service contracts. Separately, large approved projects such as Nestle (Thai) Co., Ltd.'s July 2026 investment approval for a smart factory and distribution center in Samut Prakan indicate multi-year build cycles, where conveyor suppliers that can localize manufacturing, meet national certification regimes, and support phased commissioning can win broader scopes beyond mechanical supply.
Recent Industry Developments
- May 2026: Daifuku Co., Ltd. announced its Driving Innovative Impact 2030 long-term investment plan, earmarking 52 billion yen for 2026-2029 to support production capacity expansion and M&A. The program signals sustained capital allocation toward high-spec material handling and factory automation systems, supporting broader solution delivery across logistics, automotive, and semiconductor-related conveyance.
- November 2025: Fenner Conveyors opened a Brisbane R&D center focused on low-hysteresis belt compounds and condition-monitoring sensors for overland mining installations. The move strengthens regional engineering support for long-distance belt conveyor performance, aligning with end-user priorities around energy efficiency and unplanned downtime reduction in bulk materials handling.
- November 2024: Daifuku acquired Airport Technologies, expanding its baggage-handling and airport automation portfolio. The acquisition broadens the company's addressable scope in Asia-Pacific airport conveyance projects and strengthens its ability to offer integrated systems across screening, sortation, and baggage transport.


Research Methodology Framework and Report Scope
Market Definition and Coverage
For this study, the Asia-Pacific conveyors market is defined as the revenues generated from conveyor systems and related conveyor equipment sold for material movement across industrial and logistics settings in Asia-Pacific, measured in current USD.
Scope exclusions: The sizing does not treat forklifts, cranes, hoists, AGVs/AMRs, or warehouse racking as part of the conveyors market, even when they support similar material handling workflows.
Segmentation Overview
- By Product Type
- Belt
- Roller
- Pallet
- Overhead
- Chain
- By Installation Type
- Floor
- Overhead
- In-floor
- By Load Type
- Bulk Load
- Unit Load
- By End-User Industry
- Airport
- Retail and E-commerce
- Automotive
- Manufacturing
- Food and Beverage
- Pharmaceuticals
- Mining
- Logistics and 3PL
- Other End-User Industries
- By Country
- Australia
- China
- India
- Japan
- Indonesia
- Malaysia
- Singapore
- South Korea
- Taiwan
- Rest of Asia-Pacific
Data Sources, Market Sizing, and Validation
Desk Research
Desk work starts with mapping demand drivers and building a practical supply picture for conveyors across Asia-Pacific. We referenced public sources such as national statistics offices for industrial production and manufacturing output, customs and trade statistics for machinery imports and exports, and macro indicators from World Bank and IMF.
We also used ILO labor and wage series to understand cost and labor substitution dynamics, and standards or safety guidance from bodies such as ISO or national regulators where available. To ground the market in how equipment is actually sold, we reviewed company annual reports, investor presentations, and press coverage to track capacity additions, automation investment cycles, and typical conveyor replacement timing. A paid subscription for company financials and news was used selectively to cross-check reported regional revenue exposure and major contract signals, and patent databases were used to sanity-check activity around conveyor components and automation features. These sources are illustrative, and many other public materials were also consulted for data collection, validation, and clarification.
Primary Interviews and Surveys
Primary work converts the desk indicators into inputs for sizing and pressure-tests the assumptions that drive the final number. We spoke with conveyor manufacturers, system integrators, distributors, and end users across key Asia-Pacific countries to validate adoption levels, average selling price ranges, installation mix, and the split between replacement and new-build demand across manufacturing and logistics use cases.
Distribution of primary research fieldwork respondents
| Company type | Respondent position | Region |
|---|---|---|
| Top tier: 35% | CXOs: 13% | |
| Mid tier: 48% | Functional/Unit leaders: 42% | |
| Smaller Players: 17% | Managers: 45% |
Market-Sizing & Forecasting
Market sizing was built using a top-down approach where industrial output, logistics activity, and project-based capex signals are used to reconstruct the addressable demand pool for conveyor installations and replacements across Asia-Pacific, and then translated into value using price and mix assumptions. The resulting estimate was checked using selective bottom-up approximations, such as sampled supplier and integrator revenue splits by country and end-use, along with channel checks on typical project sizes, to correct any obvious over or under counts.
Key inputs that shaped the model included manufacturing output trends, warehouse and 3PL expansion intensity, e-commerce fulfillment build-outs, and mining and bulk-handling activity. We applied an installation type split (floor, overhead, in-floor) and a bulk-load versus unit-load mix, because each one changes volumes, project sizing, and pricing. Where direct volume visibility was weak, gaps were handled using proxy indicators like machinery import trends and stated expansion plans, followed by expert validation.
Forecasting leaned on scenario analysis supported by multivariate regression, where independent variables such as industrial production growth, logistics throughput growth, and capex sentiment were used to generate a base path. That path was then adjusted using primary feedback on pricing progression and lead time normalization.
Data Validation & Update Cycle
Outputs were validated through multiple checks, including comparing implied conveyor spending intensity against independent signals such as machinery trade flows, industrial production growth, and major facility expansion cycles. Outliers at the country or end-user level were reworked by revisiting mix, price points, and timing assumptions, and then reviewed internally before sign-off.
The study is refreshed annually, and interim updates are triggered when material events occur, such as sharp changes in industrial activity, major policy shifts, or supply chain disruptions that affect equipment pricing. Before delivery, a fresh analyst pass is completed so the numbers reflect the most recent public data releases and interview learnings.
Mordor Intelligence's Asia Pacific Conveyors Market Estimate Compared With Other Published Estimates
Published market sizes for Asia-Pacific conveyors can vary because the coverage is not always aligned, and the same word, conveyors, can be used for different baskets of equipment. Differences also come from how firms treat installation and integration value, how they handle cross-border sales inside Asia-Pacific, and whether price escalation is applied consistently across the forecast window.
The main gap comes from scope breadth, where some estimates bundle wider conveying and material handling equipment, while Mordor Intelligence counts only conveyor products and systems within the stated product types and end-user uses, and then ties the total to country-level demand drivers plus validated price and mix assumptions.
Benchmark comparison
| Source | Market Size | Gaps in Research Methodology |
|---|---|---|
| Mordor Intelligence | USD 4.23 B (2025) | |
| Global Consultancy A | USD 4.30 B (2025) | Uses a broader "conveyor systems" framing with limited visible detail on included product and installation scope, which can slightly lift totals when integration-heavy projects are counted more fully. |
| Industry Publisher B | USD 2.21 B (2025) | Appears to use a narrower revenue capture and a more conservative demand pool, which can undercount system-level projects and the higher-value end-user industries where conveyors are purchased as part of larger automation programs. |
The spread is best explained by what gets counted and how demand is translated into USD value. By keeping the market basket explicit, anchoring assumptions to country activity indicators, and cross-checking pricing and mix through interviews, the final number stays traceable and easier to reproduce when new inputs are updated.


Key Questions Answered in the Report
What is the projected revenue for conveyors in Asia Pacific by 2031?
The Asia Pacific conveyors market is forecast to reach USD 6.18 billion by 2031.
How fast is demand expected to grow?
Market revenue is anticipated to rise at a 6.50% CAGR between 2026 and 2031, supported by automation and e-commerce fulfillment.
Which product category is expanding the quickest?
Overhead conveyor systems are projected to post a 7.12% CAGR as factories and warehouses reclaim floor space for robotics.
Why are pharmaceutical operators investing heavily in conveyors?
Serialization mandates, cold-chain expansion, and automated dispensing targets are driving a 6.95% CAGR in pharmaceutical deployments.
How are rising labor costs influencing adoption?
Wage inflation across China, Singapore, and Malaysia is accelerating conveyor installations to keep per-parcel handling costs low.
Page last updated on:






