Market Overview
| Study Period | 2020 - 2031 |
|---|---|
| Base Year For Estimation | 2025 |
| Forecast Data Period | 2026 - 2031 |
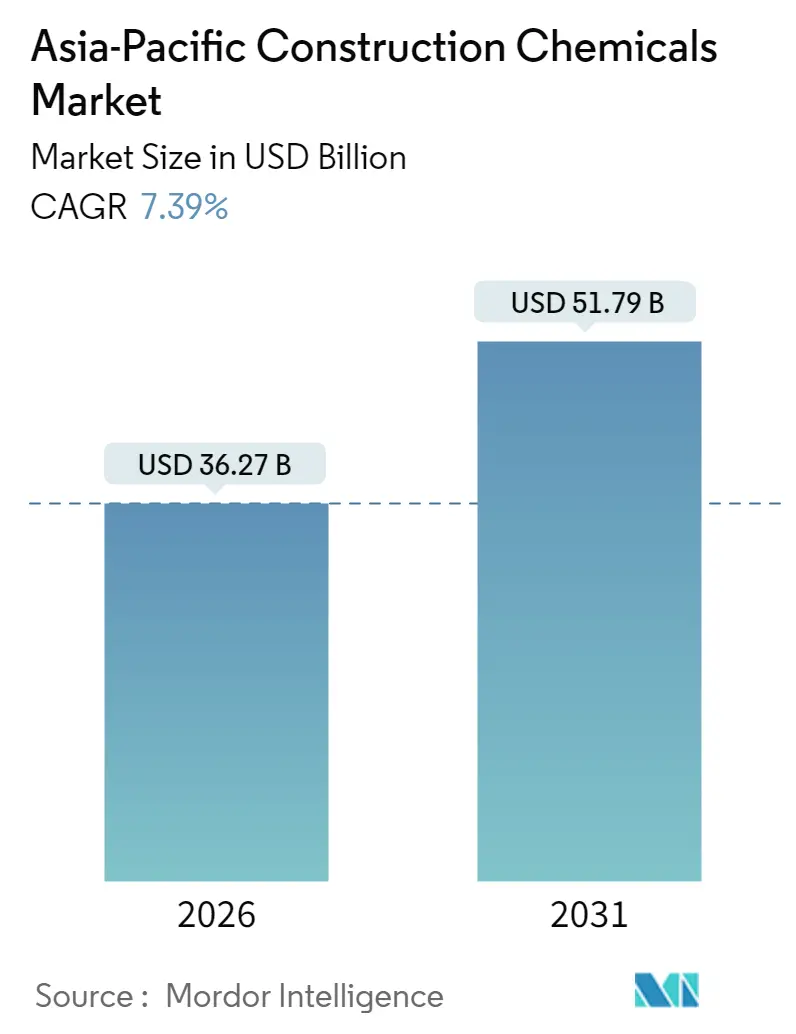
| Market Size (2026) | USD 36.27 Billion |
| Market Size (2031) | USD 51.79 Billion |
| Growth Rate (2026 - 2031) | 7.39% CAGR |
| Market Concentration | Low |
Major Players *Disclaimer: Major Players sorted in no particular order Image © Mordor Intelligence. Reuse requires attribution under CC BY 4.0. | |
Asia-Pacific Construction Chemicals Market Analysis by Mordor Intelligence
Asia-Pacific Construction Chemicals Market size in 2026 is estimated at $36.27 billion, growing from 2025 value of $33.77 billion with 2031 projections showing USD 51.79 billion, growing at 7.39% CAGR over 2026-2031. The expansion is underpinned by an infrastructure spending wave that addresses a USD 43 trillion regional investment gap, surging urban migration, and stricter green-building mandates that upgrade performance requirements for every major product class. Material demand is further boosted by the rapid adoption of ready-mix and precast concrete, a widening affordable housing push across India and ASEAN, and an accelerating pipeline of data center, airport, and rail projects that require premium waterproofing, admixture, and protective coating systems. Competitive intensity remains moderate: global leaders leverage large patent portfolios, regional specialists exploit dense distribution networks, and project owners capitalize on ensuing price pressure. Short-term headwinds include petrochemical feedstock volatility and tighter VOC or PFAS regulations; however, these same regulations are catalyzing a pivot toward water-based formulations, advanced polymers, and durability-focused solutions that sustain long-term value creation.
Key Report Takeaways
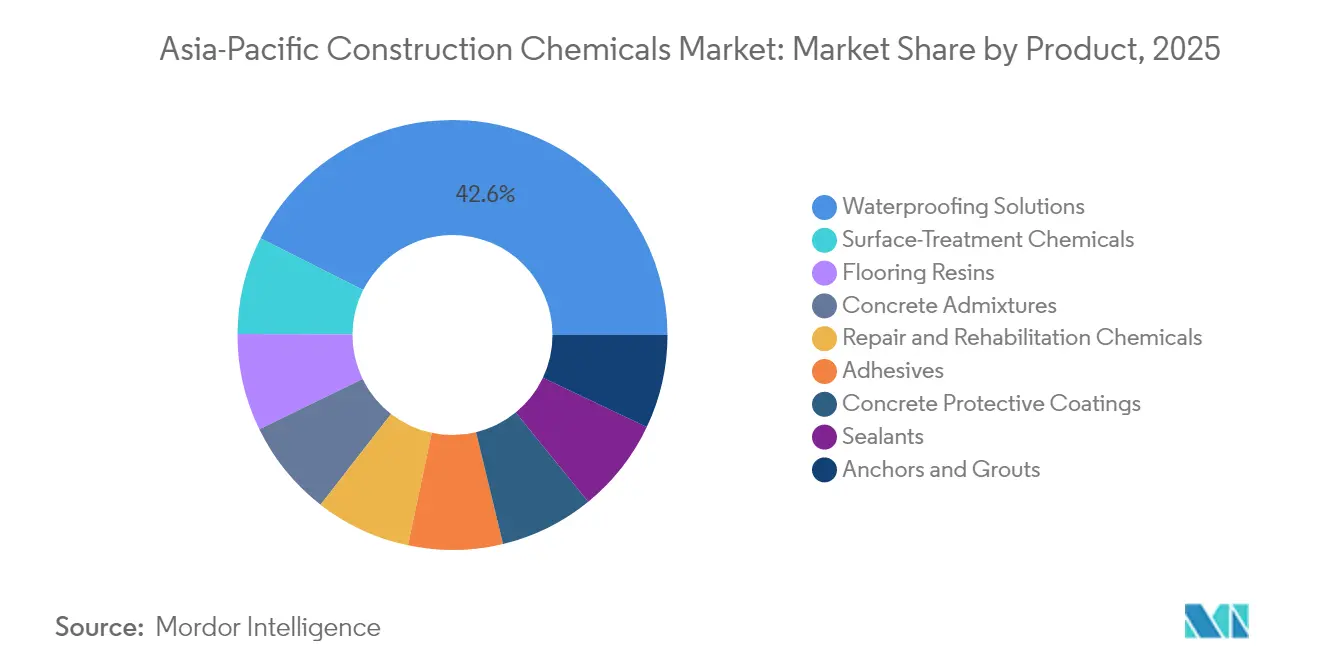
- By product category, waterproofing solutions led with a 42.58% share of the Asia-Pacific construction chemicals market in 2025; surface-treatment chemicals are projected to advance at an 8.66% CAGR through 2031.
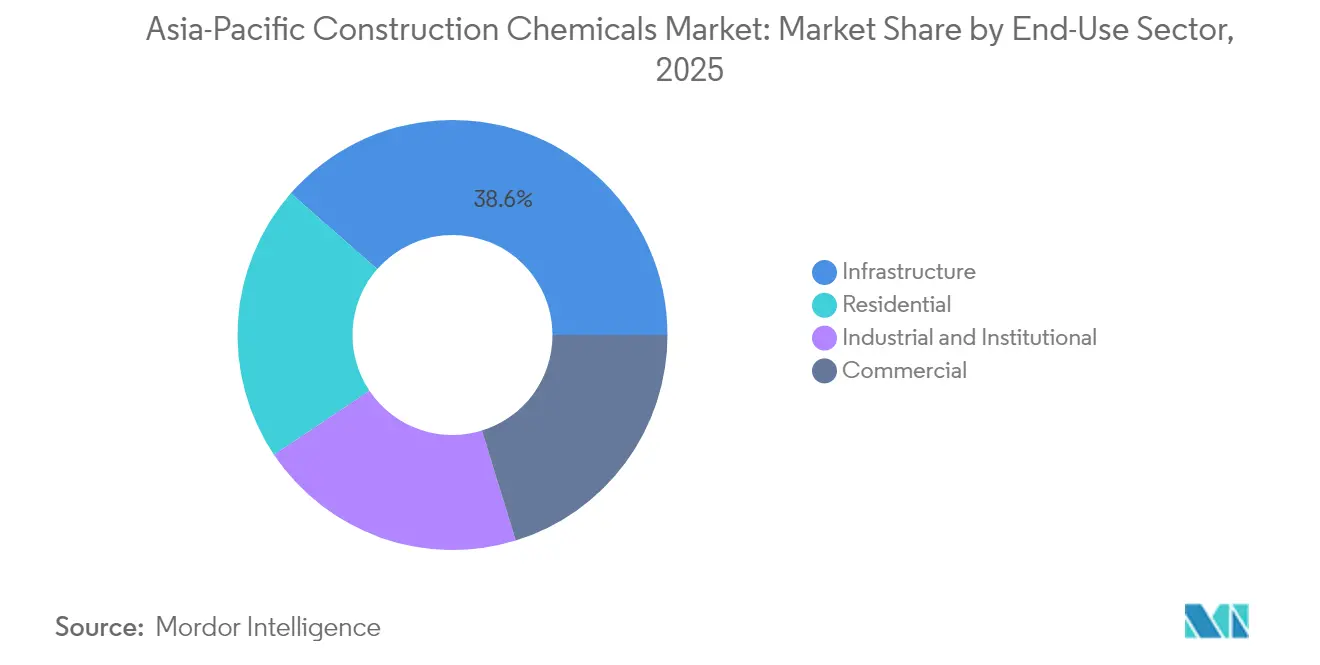
- By end-use sector, infrastructure accounted for a 38.55% share of the Asia-Pacific construction chemicals market size in 2025, while residential construction is projected to record the highest CAGR at 7.93% through 2031.
- By geography, China held a 65.00% share of the Asia-Pacific construction chemicals market size in 2025; Vietnam is projected to expand at an 8.26% CAGR between 2026 and 2031.
Note: Market size and forecast figures in this report are generated using Mordor Intelligence’s proprietary estimation framework, updated with the latest available data and insights as of January 2026.
Asia-Pacific Construction Chemicals Market Trends and Insights
Drivers Impact Analysis
| Drivers | (~) % Impact on CAGR Forecast | Geographic Relevance | Impact Timeline |
|---|---|---|---|
| Infrastructure mega-projects | +2.1% | Global APAC, concentrated in China, India, ASEAN | Long term (≥ 4 years) |
| Government green-building and low-carbon mandates | +1.8% | China, Singapore, Japan, with spillover to ASEAN | Medium term (2-4 years) |
| Rapid adoption of ready-mix and precast concrete | +1.2% | India, Indonesia, Vietnam, Thailand | Medium term (2-4 years) |
| Affordable-housing push across India and ASEAN | +0.9% | India, Indonesia, Philippines, Vietnam | Long term (≥ 4 years) |
| Rising investment in commercial construction | +0.8% | Singapore, Hong Kong, major APAC cities | Short term (≤ 2 years) |
| Source: Mordor Intelligence | |||
Understand The Key Trends Shaping This Market
Download PDF
Infrastructure Mega-Projects
A projected USD 43 trillion infrastructure bill through 2030 drives structural demand for construction chemicals across transport, energy, and digital connectivity schemes. Flagship projects, such as Singapore’s Changi Airport Terminal 5 and Hong Kong’s Three Runway System, require large volumes of high-performance admixtures, fire-resistant coatings, and long-life waterproofing membranes that can withstand heavy loads and exposure to saline environments. The Comprehensive Asia Development Plan 3.0 identifies 779 priority schemes—67% of which are located in Southeast Asia—underscoring the need for humidity-resistant and seismic-compliant systems. Regional data-center construction has also surged; Singapore alone cleared 15 new facilities in 2024, each specifying specialized shielding compounds and low-VOC intumescent coatings. Vietnam’s 2024 infrastructure spending reached USD 15.8 billion, boosting domestic cement consumption by 8.2% and driving up admixture and surface treatment volumes in tandem[1]Vietnam Cement Association, “Vietnam Cement Industry Statistics 2024,” vcca.org.vn .
Government Green-Building and Low-Carbon Mandates
China mandates that new public buildings exceeding 20,000 m² attain certified green status, establishing a regulatory floor that encourages manufacturers to adopt low-emission, high-durability chemistries. Singapore’s 2024 Chemical Control Order outlawed PFAS and medium-chain chlorinated paraffins, compelling reformulation of legacy waterproofing and fire-resistant systems[2]Ministry of Trade and Industry Singapore, “Chemical Control Order 2024,” mti.gov.sg . Shanghai’s VOC cap of 420 g/L further tilts the product mix toward water-based emulsions that now rival solvent-based equivalents in humid environments. Japan’s 2030 energy-efficiency rule aims for a 30% reduction in operational carbon, incentivizing the use of reflective coatings and thermal-insulation additives. Vietnam’s new workplace exposure limits for formaldehyde and benzene align domestic standards with export markets, accelerating local investment in low-emission production lines.
Rapid Adoption of Ready-Mix and Precast Concrete
Ready-mix penetration in urban India has reached 65%, while Indonesia’s tier-one cities register 78%, compared to a 45% regional average in 2020. Factory-controlled mixing ensures slump consistency, reduces labor, and decreases site waste, all of which call for superior water-reducing and retardation admixtures. Precast uptake accelerates in Singapore and Malaysia, where land scarcity and compressed timelines favor off-site fabrication that demands high-early-strength chemistries. India now consumes 75 million t of fly ash in concrete per year, heightening demand for polycarboxylate superplasticizers that deliver 25–35% water reduction and long workability windows under tropical heat. Thailand forecasts growth in precast applications through 2025, with government road and rail contracts prescribing precast elements for seismic resilience and rapid installation.
Affordable-Housing Push Across India and ASEAN
India’s Pradhan Mantri Awas Yojana aims to finance 20 million homes, valued at USD 31 billion, thereby locking in a predictable volume for cost-effective admixtures, sealants, and base-grade waterproofing. Indonesia’s One Million Homes and the Philippines’ socialized housing programs carry similar volume-driven specifications, shifting supplier competition toward logistics efficiency and pricing discipline rather than technical differentiation. The collective ASEAN housing deficit of 25 million units positions construction chemicals at only 3–5% of total build costs, yet durability remains a must; standardization thus favors suppliers able to certify basic quality at scale. Vietnam completed 180,000 social units in 2024, further cementing the segment’s volume trajectory.
Restraints Impact Analysis
| Restraints | (~) % Impact on CAGR Forecast | Geographic Relevance | Impact Timeline |
|---|---|---|---|
| Petrochemical raw-material price volatility | -0.6% | Global APAC, acute in import-dependent markets | Short term (≤ 2 years) |
| Tightening VOC/PFAS regulations | -0.4% | Singapore, China, Japan, gradual ASEAN adoption | Medium term (2-4 years) |
| Skilled-labour shortages | -0.8% | Japan, Singapore, Australia, spreading to ASEAN | Long term (≥ 4 years) |
| Source: Mordor Intelligence | |||
Petrochemical Raw-Material Price Volatility
Regional PVC prices fluctuated greatly in 2024 as ethylene feedstock costs varied and China rebalanced its capacity. Such gyrations compress margins because raw materials typically account for 45–60% of the delivered cost. Import-reliant markets like Singapore and Hong Kong face currency-linked exposure that amplifies volatility for additives sourced from Europe and North America. Integrated producers with flexible procurement and the ability to swap feedstock grades cushion the impact, but smaller formulators often defer capital upgrades, risking product shortages during tight cycles.
Tightening VOC/PFAS Regulations
Singapore’s PFAS ban and Shanghai’s strict VOC threshold raise direct compliance costs by an estimated 8–12% for formulators converting solvent-borne lines to water-borne counterparts. While larger multinationals allocate dedicated research and development budgets to reformulate and re-certify their products, smaller regional suppliers struggle with testing fees, lengthy lead times for approvals, and inconsistent standards across ASEAN. The regulatory ratchet, however, ultimately rewards innovators that deliver superior performance under green-label criteria, a trend that reshuffles market share toward technology-forward players.
Segment Analysis
By Product: Waterproofing Dominance Amid Surface Innovation
Waterproofing solutions retained a 42.58% share of the Asia-Pacific construction chemicals market in 2025, reflecting the monsoon season's rainfall intensity, rising coastal construction, and the need for long-duration membrane systems across mega-rail and airport projects. Surface-treatment chemicals are projected to expand at an 8.66% CAGR to 2031, driven by smart-building interfaces and multifunctional coatings that combine aesthetic finishes with thermal, self-cleaning, or antimicrobial properties. Polycarboxylate-based admixtures now dominate concrete-plasticizing applications, displacing naphthalene-sulfonate types due to their superior water reduction and slump retention. Repair and rehabilitation chemicals grow steadily as Japan and Australia initiate asset-life extension programs for aging bridges, ports, and metro systems. Adhesives, sealants, and anchors benefit from incremental growth in modular construction, while resinous flooring captures office and data center upgrades that specify anti-static and wear-resistant surfaces. The progressive shift toward low-VOC or solvent-free chemistries challenges legacy producers yet presents margin upside to innovators with robust intellectual property.
Note: Segment shares of all individual segments available upon report purchase
Get Detailed Market Forecasts at the Most Granular Levels
Download PDF
By End-Use Sector: Infrastructure Leadership with Residential Acceleration
Infrastructure projects accounted for 38.55% of the Asia-Pacific construction chemicals market size in 2025, driven by high-ticket rail, airport, and power network builds that require high-performance admixtures, specialty grouts, and geopolymer-based repair mortars. Residential construction, however, is the fastest-growing sector at an 7.93% CAGR through 2031, driven by government-funded housing initiatives in India, Indonesia, and Vietnam. Commercial space—particularly offices and retail—advances at a mid-single-digit pace as corporations consolidate regional headquarters in Singapore and Hong Kong. Industrial and institutional demand is more nuanced: factory relocations in Vietnam and Indonesia boost demand, while aging healthcare facilities in Japan and Australia fuel hospital retrofits that require low-emission coatings and antimicrobial sealants. Data-center development across ASEAN epitomizes high-specification sub-segments, calling for fire-proofing, electromagnetic shielding, and advanced floor systems that expand supplier revenue per square meter.
Note: Segment shares of all individual segments available upon report purchase
Get Detailed Market Forecasts at the Most Granular Levels
Download PDF
Geography Analysis
China held a 65.00% share of the Asia-Pacific construction chemicals market in 2025, supported by mandatory green-building codes and Belt and Road projects that rely on enhanced admixtures for extreme climates. Shanghai’s 2024 VOC cap forced a product overhaul but also advantaged local champions such as Beijing Oriental Yuhong, whose water-borne membranes quickly met certification thresholds. Vietnam is the growth pacesetter, with an 8.26% CAGR, driven by USD 15.8 billion in infrastructure outlays and rapid FDI inflows that underscore its durability in a tropical setting. Regulatory harmonization through new exposure-limit standards encourages domestic producers to adopt cleaner processes, thereby supporting their future export ambitions.
India follows with a robust volume stemming from its 20 million-home affordable housing goal and 65% urban ready-mix penetration. Fly-ash-heavy cement compositions spur demand for performance admixtures that offset variability in ash fineness, while domestic groups like Asian Paints and Pidilite exploit extensive dealer networks to secure last-mile reach. Indonesia, Thailand, and Malaysia benefit from manufacturing diversification, each backing expressways, ports, and metros that reward suppliers able to deliver logistical coverage across archipelagic geographies.
Japan’s mature market emphasizes seismic retrofitting and reducing carbon footprints, resulting in the use of specialized epoxy anchor resins and reflective roof coatings. Singapore’s mix shifts toward boutique demand for data-center and high-rise retrofits, with stringent PFAS and VOC regulations directing the portfolio to advanced water-based chemistries. Australia’s mining-infrastructure upgrades and urban densification sustain steady consumption, while South Korea’s smart-city pilots open new niches for self-healing concrete carriers and integrated sensor-ready coatings.
Competitive Landscape
The Asia-Pacific Construction Chemicals Market is fragmented. Global participants partner or acquire to sustain region-wide scale, as illustrated by Saint-Gobain’s USD 1.025 billion purchase of FOSROC International in 2024, a move that broadened waterproofing and admixture portfolios and deepened penetration in India. Regional names counter with locality advantages: dense distributor footprints, currency-aligned pricing, and climate-tuned formulations. Mid-tier challengers enter white-space domains such as data-center fireproofing and seismic grouting, segments underserved by generic suppliers yet too small for large multinationals to prioritize. Technology leadership is gaining weight. Mechanochemical synthesis pathways now yield solid-form polycarboxylate superplasticizers at concentrations exceeding 99%, thereby reducing freight costs and enhancing shelf life. The regulatory complexity and escalating research and development requisites may accelerate consolidation as smaller firms struggle to fund compliance and product renewal. Multinationals with dedicated Asia-Pacific application laboratories and robust supply-chain analytics are well-positioned to widen their moat over formulations businesses that rely on single-market volumes.
Asia-Pacific Construction Chemicals Industry Leaders
Sika AG
Beijing Oriental Yuhong Waterproof Technology Co., Ltd.
Saint-Gobain
RPM International
Jiangsu Subote New Materials Co., Ltd.
- *Disclaimer: Major Players sorted in no particular order
Need More Details on Market Players and Competitors?
Download PDF
Recent Industry Developments
- March 2025: Minova announced the acquisition of Platipus Anchors, a leader in the design and manufacture of earth anchoring systems. Platipus Anchors has a significant presence in the Asia Pacific region, primarily through a network of distributors and strategic project partnerships.
- February 2025: Saint-Gobain completed its acquisition of Fosroc, elevating its anchors and grouts portfolio and reinforcing manufacturing presence in India and the Middle East.
Asia-Pacific Construction Chemicals Market Report Scope
Commercial, Industrial and Institutional, Infrastructure, Residential are covered as segments by End Use Sector. Adhesives, Anchors and Grouts, Concrete Admixtures, Concrete Protective Coatings, Flooring Resins, Repair and Rehabilitation Chemicals, Sealants, Surface Treatment Chemicals, Waterproofing Solutions are covered as segments by Product. Australia, China, India, Indonesia, Japan, Malaysia, South Korea, Thailand, Vietnam are covered as segments by Country.By Product
| Adhesives | Hot-Melt |
| Reactive | |
| Solvent-borne | |
| Water-borne | |
| Anchors and Grouts | Cementitious Fixing |
| Resin Fixing | |
| Concrete Admixtures | Accelerator |
| Air-Entraining | |
| Super-plasticizer | |
| Retarder | |
| Shrinkage-Reducer | |
| Viscosity-Modifier | |
| Plasticizer | |
| Other Types | |
| Concrete Protective Coatings | Acrylic |
| Alkyd | |
| Epoxy | |
| Polyurethane | |
| Other Resins | |
| Flooring Resins | Acrylic |
| Epoxy | |
| Polyaspartic | |
| Polyurethane | |
| Other Resins | |
| Repair and Rehabilitation Chemicals | Fiber-Wrapping Systems |
| Injection Grouting | |
| Micro-concrete Mortars | |
| Modified Mortars | |
| Rebar Protectors | |
| Sealants | Acrylic |
| Epoxy | |
| Polyurethane | |
| Silicone | |
| Other Resins | |
| Surface-Treatment Chemicals | Curing Compounds |
| Mold-Release Agents | |
| Other Types | |
| Waterproofing Solutions | Chemicals |
| Membranes |
By End-Use Sector
| Commercial |
| Industrial and Institutional |
| Infrastructure |
| Residential |
By Geography
| Australia |
| China |
| India |
| Indonesia |
| Japan |
| Malaysia |
| South Korea |
| Thailand |
| Vietnam |
| Rest of Asia-Pacific |
| By Product | Adhesives | Hot-Melt |
| Reactive | ||
| Solvent-borne | ||
| Water-borne | ||
| Anchors and Grouts | Cementitious Fixing | |
| Resin Fixing | ||
| Concrete Admixtures | Accelerator | |
| Air-Entraining | ||
| Super-plasticizer | ||
| Retarder | ||
| Shrinkage-Reducer | ||
| Viscosity-Modifier | ||
| Plasticizer | ||
| Other Types | ||
| Concrete Protective Coatings | Acrylic | |
| Alkyd | ||
| Epoxy | ||
| Polyurethane | ||
| Other Resins | ||
| Flooring Resins | Acrylic | |
| Epoxy | ||
| Polyaspartic | ||
| Polyurethane | ||
| Other Resins | ||
| Repair and Rehabilitation Chemicals | Fiber-Wrapping Systems | |
| Injection Grouting | ||
| Micro-concrete Mortars | ||
| Modified Mortars | ||
| Rebar Protectors | ||
| Sealants | Acrylic | |
| Epoxy | ||
| Polyurethane | ||
| Silicone | ||
| Other Resins | ||
| Surface-Treatment Chemicals | Curing Compounds | |
| Mold-Release Agents | ||
| Other Types | ||
| Waterproofing Solutions | Chemicals | |
| Membranes | ||
| By End-Use Sector | Commercial | |
| Industrial and Institutional | ||
| Infrastructure | ||
| Residential | ||
| By Geography | Australia | |
| China | ||
| India | ||
| Indonesia | ||
| Japan | ||
| Malaysia | ||
| South Korea | ||
| Thailand | ||
| Vietnam | ||
| Rest of Asia-Pacific | ||
Need A Different Region or Segment?
Customize Now
Market Definition
- END-USE SECTOR - Construction chemicals consumed in the construction sectors such as commercial, residential, industrial, institutional, and infrastructure are considered under the scope of the study.
- PRODUCT/APPLICATION - Under the scope of the study, the consumption of construction chemical products such as concrete admixtures, repair and rehabilitation chemicals, flooring resins, waterproofing solutions, anchors and grouts, adhesives and sealants, and surface treatment chemicals is considered.
| Keyword | Definition |
|---|---|
| Accelerator | Accelerators are admixtures used to fasten the setting time of concrete by increasing the initial rate and speeding up the chemical reaction between cement and the mixing water. These are used to harden and increase the strength of concrete quickly. |
| Acrylic | This synthetic resin is a derivative of acrylic acid. It forms a smooth surface and is mainly used for various indoor applications. The material can also be used for outdoor applications with a special formulation. |
| Adhesives | Adhesives are bonding agents used to join materials by gluing. Adhesives can be used in construction for many applications, such as carpet laying, ceramic tiles, countertop lamination, etc. |
| Air Entraining Admixture | Air-entraining admixtures are used to improve the performance and durability of concrete. Once added, they create uniformly distributed small air bubbles to impart enhanced properties to the fresh and hardened concrete. |
| Alkyd | Alkyds are used in solvent-based paints such as construction and automotive paints, traffic paints, flooring resins, protective coatings for concrete, etc. Alkyd resins are formed by the reaction of an oil (fatty acid), a polyunsaturated alcohol (Polyol), and a polyunsaturated acid or anhydride. |
| Anchors and Grouts | Anchors and grouts are construction chemicals that stabilize and improve the strength and durability of foundations and structures like buildings, bridges, dams, etc. |
| Cementitious Fixing | Cementitious fixing is a process in which a cement-based grout is pumped under pressure to fill forms, voids, and cracks. It can be used in several settings, including bridges, marine applications, dams, and rock anchors. |
| Commercial Construction | Commercial construction comprises new construction of warehouses, malls, shops, offices, hotels, restaurants, cinemas, theatres, etc. |
| Concrete Admixtures | Concrete admixtures comprise water reducers, air entrainers, retarders, accelerators, superplasticizers, etc., added to concrete before or during mixing to modify its properties. |
| Concrete Protective Coatings | To provide specific protection, such as anti-carbonation or chemical resistance, a film-forming protective coat can be applied on the surface. Depending on the applications, different resins like epoxy, polyurethane, and acrylic can be used for concrete protective coatings. |
| Curing Compounds | Curing compounds are used to cure the surface of concrete structures, including columns, beams, slabs, and others. These curing compounds keep the moisture inside the concrete to give maximum strength and durability. |
| Epoxy | Epoxy is known for its strong adhesive qualities, making it a versatile product in many industries. It resists heat and chemical applications, making it an ideal product for anyone needing a stronghold under pressure. It is widely used in adhesives, electrical and electronics, paints, etc. |
| Fiber Wrapping Systems | Fiber Wrapping Systems are a part of construction repair and rehabilitation chemicals. It involves the strengthening of existing structures by wrapping structural members like beams and columns with glass or carbon fiber sheets. |
| Flooring Resins | Flooring resins are synthetic materials applied to floors to enhance their appearance, increase their resistance to wear and tear or provide protection from chemicals, moisture, and stains. Depending on the desired properties and the specific application, flooring resins are available in distinct types, such as epoxy, polyurethane, and acrylic. |
| High-Range Water Reducer (Super Plasticizer) | High-range water reducers are a type of concrete admixture that provides enhanced and improved properties when added to concrete. These are also called superplasticizers and are used to decrease the water-to-cement ratio in concrete. |
| Hot Melt Adhesives | Hot-melt adhesives are thermoplastic bonding materials applied as melts that achieve a solid state and resultant strength on cooling. They are commonly used for packaging, coatings, sanitary products, and tapes. |
| Industrial and Institutional Construction | Industrial and institutional construction includes new construction of hospitals, schools, manufacturing units, energy and power plants, etc. |
| Infrastructure Construction | Infrastructure construction includes new construction of railways, roads, seaways, airports, bridges, highways, etc. |
| Injection Grouting | The process of injecting grout into open joints, cracks, voids, or honeycombs in concrete or masonry structural members is known as injection grouting. It offers several benefits, such as strengthening a structure and preventing water infiltration. |
| Liquid-Applied Waterproofing Membranes | Liquid-Applied membrane is a monolithic, fully bonded, liquid-based coating suitable for many waterproofing applications. The coating cures to form a rubber-like elastomeric waterproof membrane and may be applied over many substrates, including asphalt, bitumen, and concrete. |
| Micro-concrete Mortars | Micro-concrete mortar is made up of cement, water-based resin, additives, mineral pigments, and polymers and can be applied on both horizontal and vertical surfaces. It can be used to refurbish residential complexes, commercial spaces, etc. |
| Modified Mortars | Modified Mortars include Portland cement and sand along with latex/polymer additives. The additives increase adhesion, strength, and shock resistance while also reducing water absorption. |
| Mold Release Agents | Mold release agents are sprayed or coated on the surface of molds to prevent a substrate from bonding to a molding surface. Several types of mold release agents, including silicone, lubricant, wax, fluorocarbons, and others, are used based on the type of substrates, including metals, steel, wood, rubber, plastic, and others. |
| Polyaspartic | Polyaspartic is a subset of polyurea. Polyaspartic floor coatings are typically two-part systems that consist of a resin and a catalyst to ease the curing process. It offers high durability and can withstand harsh environments. |
| Polyurethane | Polyurethane is a plastic material that exists in various forms. It can be tailored to be either rigid or flexible and is the material of choice for a broad range of end-user applications, such as adhesives, coatings, building insulation, etc. |
| Reactive Adhesives | A reactive adhesive is made of monomers that react in the adhesive curing process and do not evaporate from the film during use. Instead, these volatile components become chemically incorporated into the adhesive. |
| Rebar Protectors | In concrete structures, rebar is one of the important components, and its deterioration due to corrosion is a major issue that affects the safety, durability, and life span of buildings and structures. For this reason, rebar protectors are used to protect against degrading effects, especially in infrastructure and industrial construction. |
| Repair and Rehabilitation Chemicals | Repair and Rehabilitation Chemicals include repair mortars, injection grouting materials, fiber wrapping systems, micro-concrete mortars, etc., used to repair and restore existing buildings and structures. |
| Residential Construction | Residential construction involves constructing new houses or spaces like condominiums, villas, and landed homes. |
| Resin Fixing | The process of using resins like epoxy and polyurethane for grouting applications is called resin fixing. Resin fixing offers several advantages, such as high compressive and tensile strength, negligible shrinkage, and greater chemical resistance compared to cementitious fixing. |
| Retarder | Retarders are admixtures used to slow down the setting time of concrete. These are usually added with a dosage rate of around 0.2% -0.6% by weight of cement. These admixtures slow down hydration or lower the rate at which water penetrates the cement particles by making concrete workable for a long time. |
| Sealants | A sealant is a viscous material that has little or no flow qualities, which causes it to remain on surfaces where they are applied. Sealants can also be thinner, enabling penetration to a certain substance through capillary action. |
| Sheet Waterproofing Membranes | Sheet membrane systems are reliable and durable thermoplastic waterproofing solutions that are used for waterproofing applications even in the most demanding below-ground structures, including those exposed to highly aggressive ground conditions and stress. |
| Shrinkage Reducing Admixture | Shrinkage-reducing admixtures are used to reduce concrete shrinkage, whether from drying or self-desiccation. |
| Silicone | Silicone is a polymer that contains silicon combined with carbon, hydrogen, oxygen, and, in some cases, other elements. It is an inert synthetic compound that comes in various forms, such as oil, rubber, and resin. Due to its heat-resistant properties, it finds applications in sealants, adhesives, lubricants, etc. |
| Solvent-borne Adhesives | Solvent-borne adhesives are mixtures of solvents and thermoplastic or slightly cross-linked polymers such as polychloroprene, polyurethane, acrylic, silicone, and natural and synthetic rubbers. |
| Surface Treatment Chemicals | Surface treatment chemicals are chemicals used to treat concrete surfaces, including roofs, vertical surfaces, and others. They act as curing compounds, demolding agents, rust removers, and others. They are cost-effective and can be used on roadways, pavements, parking lots, and others. |
| Viscosity Modifier | Viscosity Modifiers are concrete admixtures used to change various properties of admixtures, including viscosity, workability, cohesiveness, and others. These are usually added with a dosage of around 0.01% to 0.1% by weight of cement. |
| Water Reducer | Water reducers, also called plasticizers, are a type of admixture used to decrease the water-to-cement ratio in the concrete, thereby increasing the durability and strength of concrete. Various water reducers include refined lignosulfonates, gluconates, hydroxycarboxylic acids, sugar acids, and others. |
| Water-borne Adhesives | Water-borne adhesives use water as a carrier or diluting medium to disperse resin. They are set by allowing the water to evaporate or be absorbed by the substrate. These adhesives are compounded with water as a dilutant rather than a volatile organic solvent. |
| Waterproofing Chemicals | Waterproofing chemicals are designed to protect a surface from the perils of leakage. A waterproofing chemical is a protective coating or primer applied to a structure's roof, retaining walls, or basement. |
| Waterproofing Membranes | Waterproofing membranes are liquid-applied or self-adhering layers of water-tight materials that prevent water from penetrating or damaging a structure when applied to roofs, walls, foundations, basements, bathrooms, and other areas exposed to moisture or water. |
Need More Details on Market Definition?
Ask a Question
Research Methodology
Mordor Intelligence follows a four-step methodology in all our reports.
- Step-1: Identify Key Variables: The quantifiable key variables (industry and extraneous) pertaining to the specific product segment and country are selected from a group of relevant variables & factors based on desk research & literature review; along with primary expert inputs. These variables are further confirmed through regression modeling (wherever required).
- Step-2: Build a Market Model: In order to build a robust forecasting methodology, the variables and factors identified in Step-1 are tested against available historical market numbers. Through an iterative process, the variables required for market forecast are set and the model is built on the basis of these variables.
- Step-3: Validate and Finalize: In this important step, all market numbers, variables and analyst calls are validated through an extensive network of primary research experts from the market studied. The respondents are selected across levels and functions to generate a holistic picture of the market studied.
- Step-4: Research Outputs: Syndicated Reports, Custom Consulting Assignments, Databases & Subscription Platforms

Get More Details On Research Methodology
Download PDF


