
Asia-Pacific Communication Platform-as-a-Service Market Size and Share
Market Overview
| Study Period | 2020 - 2031 |
|---|---|
| Forecast Data Period | 2026 - 2031 |
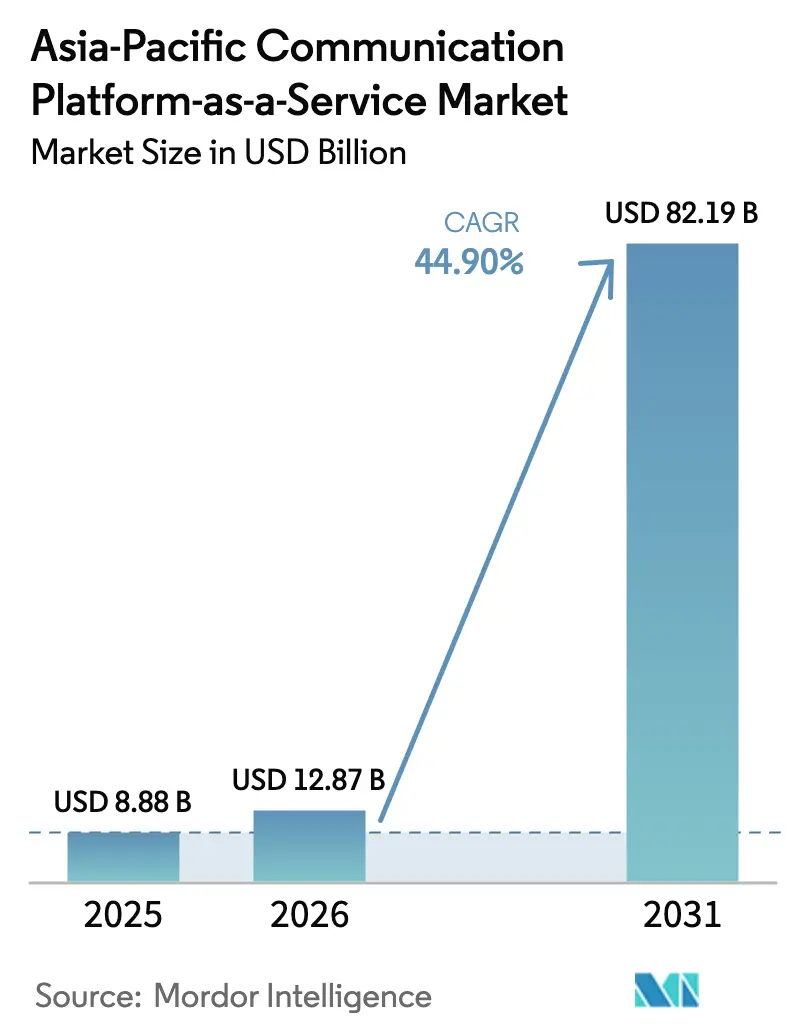
| Base Year Market Size (2025) | USD 8.88 Billion |
| Market Size (2026) | USD 12.87 Billion |
| Market Size (2031) | USD 82.19 Billion |
| Growth Rate (2026 - 2031) | 44.90 % |
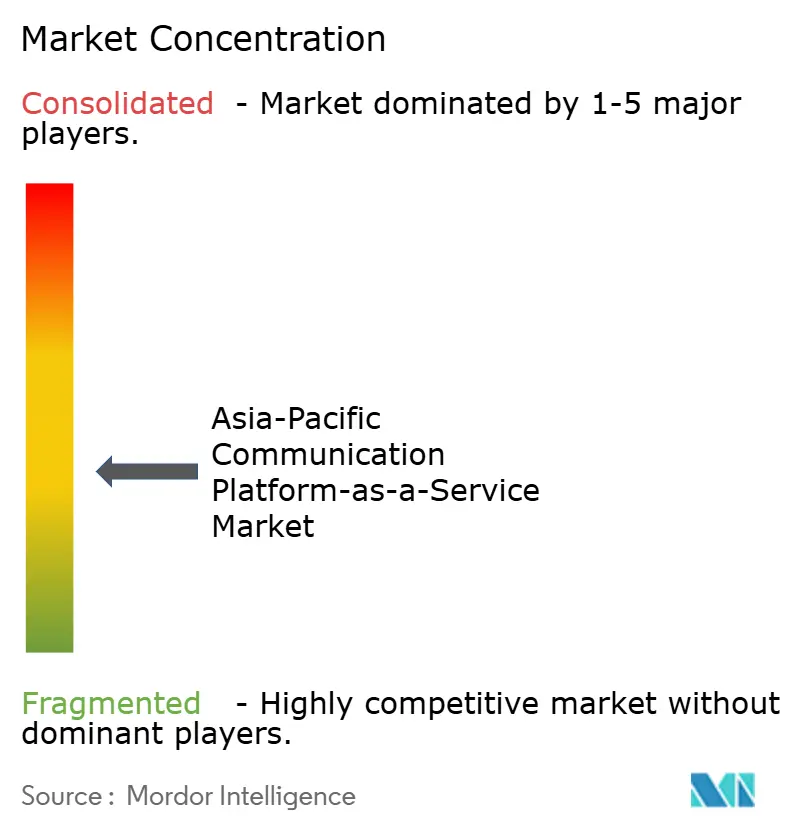
| Market Concentration | Medium |
Major Players *Disclaimer: Major Players sorted in no particular order Image © Mordor Intelligence. Reuse requires attribution under CC BY 4.0. | |
Asia-Pacific Communication Platform-as-a-Service Market Analysis by Mordor Intelligence
The Asia-Pacific CPaaS market size in 2026 is estimated at USD 12.87 billion, growing from 2025 value of USD 8.88 billion with 2031 projections showing USD 82.19 billion, growing at 44.90% CAGR over 2026-2031. These growth dynamics stem from accelerated digital transformation programs, the proliferation of cloud-native communication stacks, and a decisive enterprise shift toward API-driven messaging, voice, and video workflows. China’s 5G-enabled cloud infrastructure, India’s fintech-centric super-apps, and Southeast Asia’s mobile-first commerce collectively reinforce adoption momentum. Large enterprises keep spending high, yet simplified low-code interfaces now allow SMEs to embed real-time communications without specialist talent, widening the addressable base. Providers differentiate through multi-channel orchestration, AI-powered analytics, and partnerships that bundle telco network APIs with advanced security and compliance. As a result, the Asia-Pacific CPaaS market is evolving from point-solution messaging toward integrated customer-experience platforms that unify channels, data, and automation.
Key Report Takeaways
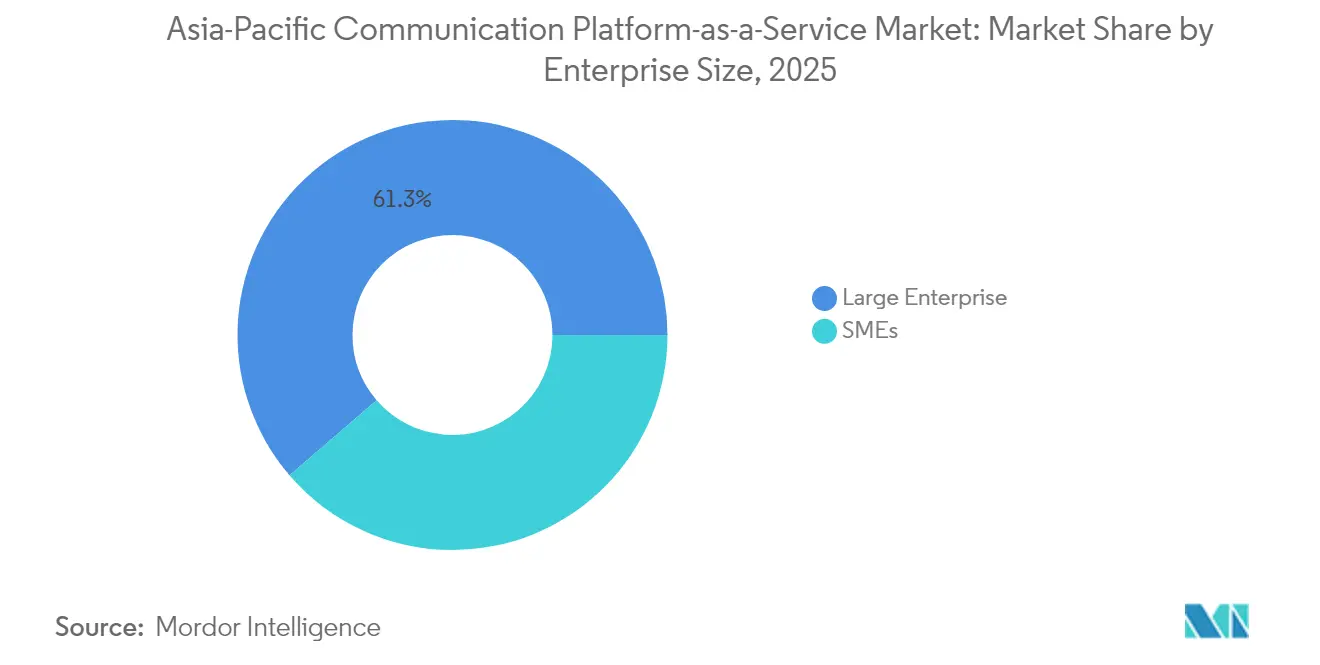
- By organization size, large enterprises contributed 61.30% revenue in 2025, whereas SMEs are poised to compound at 45.10% CAGR to 2031, the fastest among all segments.
- By end-user industry, BFSI accounted for a 25.10% share of the Asia-Pacific CPaaS market size in 2025 and e-commerce and logistics is advancing at a 44.80% CAGR during 2026-2031.
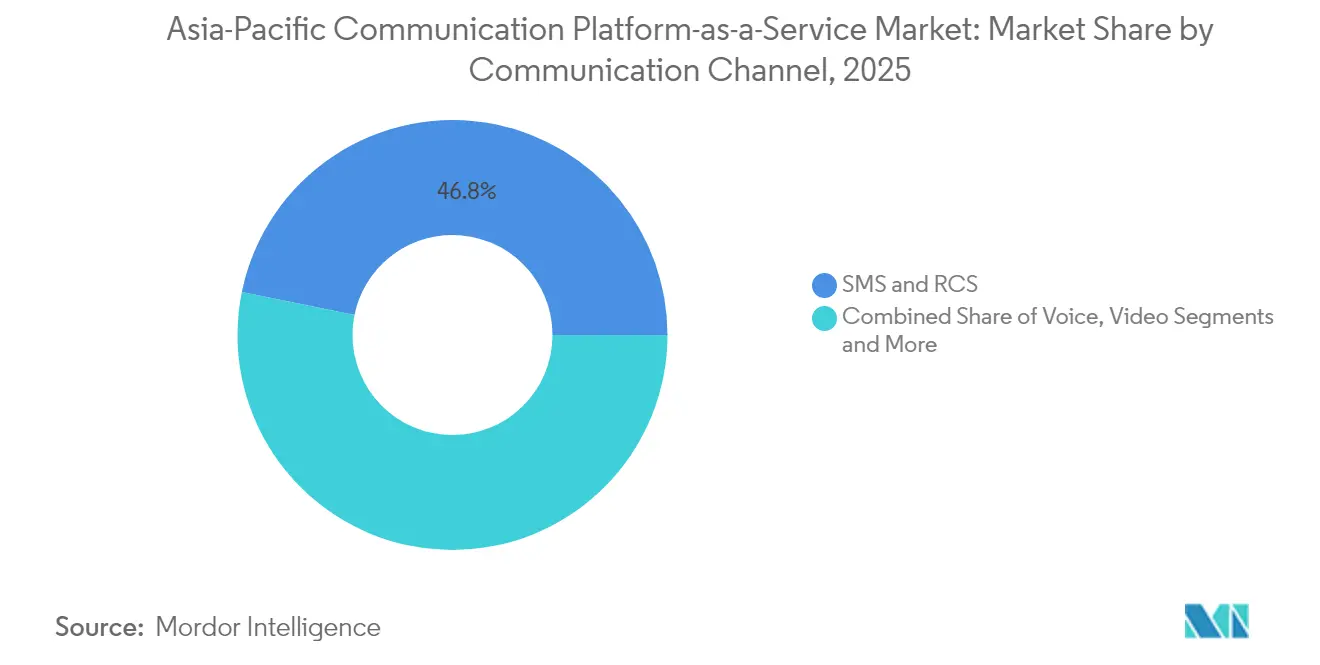
- By communication channel, SMS and RCS retained 46.80% share in 2025, whereas video APIs are forecast to grow at a 45.90% CAGR through 2031.
- By component, messaging APIs held 42.60% revenue in 2025; multi-channel workflow orchestration platforms deliver the highest projected CAGR at 46.40% to 2031.
- By geography, China led with 31.40% of Asia-Pacific CPaaS market share in 2025, while India is projected to expand at a 45.60% CAGR through 2031.
Note: Market size and forecast figures in this report are generated using Mordor Intelligence’s proprietary estimation framework, updated with the latest available data and insights as of 2026.
Market Trends and Insights
Drivers Impact Analysis of Asia-Pacific Communication Platform-as-a-Service Market*
| Driver | (~) % Impact on CAGR Forecast | Geographic Relevance | Impact Timeline |
|---|---|---|---|
| Rapid cloud-led digital transformation across SMEs and large enterprises | +8.2% | Global, with concentration in China, India, Southeast Asia | Medium term (2-4 years) |
| Mobile-first population and 5G rollout accelerating A2P traffic | +7.8% | APAC core, particularly South Korea, Japan, Australia | Short term (≤ 2 years) |
| Growing omnichannel CX and CPaaS-based CX modernization wave | +6.9% | Global, with early adoption in Singapore, Hong Kong, Japan | Medium term (2-4 years) |
| Telco-backed Open-Gateway APIs unlocking network programmability | +5.4% | Regional, with focus on developed APAC markets | Long term (≥ 4 years) |
| Embedded-finance integrations driving CPaaS uptake in fintech and super-apps | +4.7% | Southeast Asia, India, China | Medium term (2-4 years) |
| Generative-AI infused APIs expanding CPaaS service mix and ARPU | +6.1% | Global, with innovation centers in China, Singapore, Australia | Long term (≥ 4 years) |
| Source: Mordor Intelligence | |||
Rapid Cloud-Led Digital Transformation Across SMEs and Large Enterprises
Enterprises have migrated 85% of applications to cloud platforms by 2025, and this lift in cloud workloads directly fuels demand for flexible communication APIs that plug into SaaS back-ends.[1] China’s cloud spending is rising 15% in 2025, with Alibaba Cloud, Huawei Cloud, and Tencent Cloud jointly delivering 71% domestic share, each embedding CPaaS add-ons into their marketplace portfolios. SMEs now regard communications as code rather than infrastructure, using pay-as-you-go APIs to send alerts, authenticate users, and orchestrate contact-center tasks. These low-barrier entry points democratize enterprise-grade communications, erasing the CapEx hurdle that historically limited adoption. The structural shift positions API communications as a core pillar of digital-experience architecture, not an auxiliary bolt-on.
Mobile-First Population and 5G Rollout Accelerating A2P Traffic
Asia-Pacific’s smartphone penetration surpasses 78% in 2025, and 5G subscriptions in Southeast Asia and Oceania are on course to exceed 570 million by 2027, reinforcing mobile-first engagement habits.[2] Although international one-time-password traffic is set to decline as authentication alternatives emerge, operators counter by commercializing Rich Communication Services and advanced messaging formats. Sinch and Singtel’s 2024 launch of Singapore’s first RCS Business Messaging service showcases how richer media will offset plain-text erosion. As bandwidth improves, enterprises pivot from static SMS to video snippets, conversational commerce, and in-app chat, unlocking new monetization streams for CPaaS vendors.
Growing Omnichannel CX and CPaaS-Based CX Modernization Wave
Companies that deploy integrated messaging, voice, and social channels achieve 89% customer-retention rates, more than doubling single-channel strategies.[3] The healthcare super-app Apollo 24/7 raised average order revenue 72% after combining WhatsApp, RCS, and voice flows via Infobip, validating omnichannel ROI. Operators extend the concept: Thailand’s TrueBusiness launched “True CPaaS,” pairing AI-based personalization with multi-channel delivery to streamline commerce and support. These examples illustrate a region-wide pivot toward outcome-oriented communications in marketing automation, sales enablement, and post-purchase support—feeding continuous demand for orchestration and analytics modules.
Telco-Backed Open-Gateway APIs Unlocking Network Programmability
GSMA-aligned Open Gateway initiatives let developers access carrier functions—location, quality-on-demand, number verification—through standardized APIs. Ericsson and 12 operators formed the Aduna joint venture in 2025 to aggregate such capabilities, ensuring single-point exposure for the developer ecosystem. In Korea, mobile carriers jointly standardize network APIs to accelerate 5G monetization. TrueBusiness and EASY BUY introduced Thailand’s first commercial number-verification API, proving the commercial viability of this model. As these APIs blend with CPaaS platforms, enterprises gain programmable network attributes that elevate reliability and security, driving incremental spend per user.
Restraints Impact Analysis of Asia-Pacific Communication Platform-as-a-Service Market*
| Restraint | (~) % Impact on CAGR Forecast | Geographic Relevance | Impact Timeline |
|---|---|---|---|
| Legacy integration and migration complexity | -4.3% | Global, with higher impact in Japan, South Korea, Australia | Medium term (2-4 years) |
| Fragmented data-privacy and cross-border compliance landscape | -3.8% | Regional, particularly affecting cross-border operations | Long term (≥ 4 years) |
| Volatile regional SMS termination pricing and carrier consolidation | -2.9% | Asia-Pacific core, with concentration in Indonesia, Thailand, Philippines | Short term (≤ 2 years) |
| Rising AIT/SMS-fraud prompting aggressive traffic filtering | -2.7% | Global, with particular focus on India, China, Southeast Asia | Medium term (2-4 years) |
| Source: Mordor Intelligence | |||
Legacy Integration and Migration Complexity
Two-thirds of communication-service providers cite legacy system entanglement as a top barrier to rolling out modern APIs, and technology debt reached 56% of IT budgets in 2024. Japanese and Korean enterprises that accrued proprietary systems over decades face complex data-mapping and security-governance tasks before activating CPaaS modules. In Singapore, 81% of companies seek vendors capable of managing multi-cloud migration and legacy coexistence The resulting preference is for end-to-end platforms that bundle pre-built connectors, secure edge nodes, and consulting services.
Fragmented Data-Privacy and Cross-Border Compliance Landscape
Asia-Pacific lacks a uniform data-protection regime, forcing providers to navigate divergent rules such as Hong Kong’s PDPO, Singapore’s PDPA, and India’s Digital Personal Data Protection Act. Each mandates distinct consent, residency, and breach-notification processes, inflating compliance overhead. Smaller CPaaS firms often lack the legal resources to customize architectures per jurisdiction, leading to service limitations or market exits. MVNO and net-neutrality directives add another layer of complexity, particularly where cross-border routing of SMS or voice may breach domestic carriage rules. The burden skews competitive advantage toward larger providers with dedicated governance teams, accelerating market consolidation and potentially throttling innovation in underserved markets.
*Our forecasts treat driver/restraint impacts as directional, not additive. The impact forecasts reflect baseline growth, mix effects, and variable interactions.
Asia-Pacific Communication Platform-as-a-Service Market Segment Analysis
By Organization Size:
SMEs Drive DemocratizationLarge enterprises captured 61.30% of Asia-Pacific CPaaS market share in 2025, leveraging complex integrations, heavy security layers, and multi-country footprints. SMEs, however, are growing at a 45.10% CAGR to 2031, narrowing the historical adoption gap. Coca-Cola Europacific Partners Indonesia’s use of 8x8 SMS APIs within its Klik Toko app underscores how even blue-chip brands rely on CPaaS to streamline B2B distribution. The falling cost of programmable communications and the availability of low-code builders let smaller retailers embed chatbots, payment alerts, and click-to-video support in days rather than months. Providers now launch tiered packages that scale from starter kits to enterprise clusters, ensuring that entry-level customers do not churn as usage expands. This democratization both enlarges the total addressable base and intensifies competition for price-sensitive SME contracts.

By End-User Industry:
BFSI Leadership Faces E-Commerce ChallengeBFSI held 25.10% of the Asia-Pacific CPaaS market size in 2025, reflecting widespread use of OTP, transaction alerts, and regulatory notices. Yet e-commerce and logistics is forecast to accelerate at a 44.80% CAGR through 2031 as super-apps embed conversational checkout, order tracking, and returns automation. Financial institutions prioritize reliability and compliance, driving uptake of number-verification APIs and encrypted messaging. In contrast, online marketplaces demand personalization and rapid experimentation, favoring platforms that expose A/B testing hooks and AI-powered chat composition. This divergence compels CPaaS vendors to segment roadmaps: highly secure, audit-ready modules for regulated sectors and agile CX toolkits for digital commerce.
Logistics operators adopt video chat for driver support and warehouse troubleshooting, while insurers test voice-biometric authentication to speed claims processing. Healthcare extends CPaaS into tele-consultation and prescription reminders, leveraging video SDKs compliant with patient-data laws. These diversified use cases emphasize that verticalized templates, not generic APIs, now determine vendor differentiation. Providers able to package regulatory accelerators—PCI-DSS, HIPAA equivalence, local e-signature—capture stickier revenue as industries converge on omnichannel engagement norms
By Communication Channel:
Video APIs Surge Despite SMS DominanceSMS and RCS delivered 46.80% of revenue in 2025, benefiting from device ubiquity and carrier-grade reach. Yet video APIs exhibit the fastest 45.90% CAGR as 5G bandwidth and browser-native WebRTC enable frictionless calls within mobile apps. Enterprises blend asynchronous SMS with live video to create guided support flows—the customer receives a text containing a one-time video link that escalates to a product specialist. Rich media’s ascent also manifests in banking, where advisors host secure video KYC sessions initiated from a verified SMS thread. While voice remains indispensable for IVR and agent assist, its growth plateaus as messaging channels absorb simple queries.
In-app chat gains traction inside super-apps, where transport, food delivery, and financial services co-exist. Push notifications and email maintain roles for account statements and regulatory disclosures, but younger demographics gravitate to real-time chat. Consequently, CPaaS vendors pivot to channel-agnostic orchestration that selects the optimal path based on user preference, cost, and compliance. Feature roadmaps now prioritize advanced codecs, AI camera effects, and screen-share functions to keep video engagement sticky, cementing its status as the next revenue unlock within the Asia-Pacific CPaaS market.
By Component:
Multi-Channel Platforms Lead InnovationMessaging APIs still contribute 42.60% of 2025 revenue, serving as the entry point for bulk alerts and transactional traffic. However, multi-channel workflow orchestration is expanding at a 46.40% CAGR as enterprises demand single-pane-of-glass control over SMS, voice, chat, and email journeys. Builders such as 8x8 Automation Builder illustrate how drag-and-drop flows democratize complex logic, letting marketers launch campaigns without engineering tickets. Voice APIs hold steady, augmented by speech-to-text, sentiment, and voice-biometric extensions that elevate caller experience. Video SDKs and in-call widgets accelerate tele-health, e-learning, and remote-inspection scenarios, reinforcing the channel mix thesis.
Professional and managed services gain relevance as enterprises seek advisory support on compliance, architecture, and ROI tracking. Providers that bundle consultative blueprints with platform licenses secure multi-year contracts and higher net revenue retention rates. The Asia-Pacific CPaaS market therefore tilts toward platform-plus-services propositions, with orchestration engines as the anchoring layer around which ancillary modules—AI bots, campaign analytics, payment gateways—cluster.
Geography Analysis
China Communication Platform-as-a-Service Market
China commanded 31.40% of regional revenue in 2025, underpinned by expansive 5G roll-outs, cloud price wars, and government-backed “Eastern Data Western Computing” policies that balance data-center load and renewable energy sourcing. The Big Three telcos—China Mobile, China Unicom, China Telecom—each reported rising enterprise service lines, and Alibaba Cloud’s 59% international price cut signals aggressive scale economics to onboard more CPaaS workloads. Domestic providers embed messaging and video APIs directly into SaaS suites, streamlining procurement for state-owned banks, logistics conglomerates, and retail chains. As Chinese vendors expand into Southeast Asia, they carry bilateral cloud agreements that promote data-residency compliance, accelerating cross-border CPaaS expansion.
India Communication Platform-as-a-Service Market
India is the growth pacesetter, clocking a 45.60% CAGR to 2031 as fintech apps, digital public-infrastructure projects, and affordable 5G devices unlock mass messaging and verification traffic. Tanla Platforms holds 35% share of the local CPaaS ecosystem and posted 29% year-on-year profit growth by scaling WhatsApp Business and RCS campaigns for banking and commerce clients.
Regulatory Landscape
Asia-Pacific CPaaS regulation is tightening around anti-spam enforcement, sender identity, and auditability of application-to-person (A2P) traffic, raising the bar for platforms that sell messaging and voice APIs at scale. In India, TRAI issued a February 2026 direction requiring Terminating Access Providers to deploy AI/ML-based UCC_Detect systems and share suspected commercial communication signals with Originating Access Providers via the DLT ecosystem, reinforcing template, header, and traceability controls embedded into enterprise messaging operations.
Singapore is maintaining tighter sender-identity requirements through IMDA safeguards such as the SMS Sender ID Registration (SSIR) regime, along with licensing rules under the IP Telephony framework. This is pushing providers toward compliant routing and verified sender workflows. Australia is also strengthening market monitoring: in November 2026 the ACCC proposed A2P SMS Record Keeping Rules 2026, including defined reporting timelines (first reporting period ending 31 October 2026, with reports due 21 November 2026) for wholesale termination services, which increases compliance overhead for CPaaS operators and favors those with mature governance and carrier-grade reporting capabilities.
Competitive Landscape
The Asia-Pacific CPaaS market sits in a consolidation cycle, yet remains moderately fragmented. Global leaders Twilio, Sinch, and Vonage scale via hyperscale cloud nodes and AI feature roadmaps, while regional specialists Tanla Platforms and Route Mobile leverage in-country carrier contracts and compliance accelerators. Proximus Global fused BICS, Telesign, and Route Mobile in January 2025, forming a cross-continent powerhouse that bundles wholesale messaging with enterprise APIs. At the network layer, the USD 6.5 billion XL Axiata-Smartfren merger strengthens Indonesian termination routes, indirectly benefiting CPaaS providers reliant on domestic reach.
Strategic differentiation increasingly hinges on AI integration. Alibaba Cloud pledged USD 52.9 billion toward Model-as-a-Service platforms, positioning to expose generative-AI functions directly through CPaaS endpoints. Twilio’s multi-year alliance with Microsoft Azure layers voice analytics and large-language-model capabilities atop existing communications workflows. Regional champions follow suit: Infobip joined forces with NTT Com Online to provide omnichannel services in Japan, pairing local sales muscle with global platform depth.
Asia-Pacific Communication Platform-as-a-Service Industry Leaders
-
Twilio Inc.
-
Vonage Holdings Corp
-
Tanla Platforms Limited
-
Route Mobile
-
VCloudX PTE Limited
- *Disclaimer: Major Players sorted in no particular order
Asia-Pacific Communication Platform-as-a-Service Market Companies Covered in this Report
- Twilio Inc.
- Vonage Holdings Corp. (an Ericsson company)
- Tanla Platforms Ltd.
- Route Mobile Ltd.
- Sinch AB
- Infobip Ltd.
- Kaleyra S.p.A. (Tata Communications)
- VCloudX Pte Ltd. (EnableX)
- 8x8 Inc.
- MNF Group Ltd.
- MessageBird B.V.
- Plivo Inc.
- Telnyx LLC
- Bandwidth Inc.
- ACL Mobile (Sinch)
- Alibaba Cloud
- Tencent Cloud
- Huawei Cloud
- AsiaInfo Technologies Ltd.
Read Analysis of Asia-Pacific Communication Platform-as-a-Service Companies
Market Opportunities and Future Outlook
Compliance-led communications is creating whitespace for CPaaS vendors that package verified messaging and calling as a managed capability rather than a commodity API, particularly in high-volume regulated use cases such as BFSI alerts, OTP, and customer verification. TRAI's continued focus on curbing unsolicited commercial communications, including stakeholder engagement around the 2026 third amendment to TCCCPR and discussion of termination charges tied to unregistered A2P calling stacks, is pushing enterprises to consolidate on platforms that can operationalize registration, template governance, and end-to-end audit trails. Route Mobile and Sinch have publicly framed these measures as supportive for enterprise-grade CPaaS adoption.
A second opportunity is also emerging around decoupling software orchestration from in-country carriage to manage fragmentation across data, telecom, and spam-control rules. Hybrid architectures and Bring Your Own Carrier (BYOC) models let multinational enterprises standardize workflows, analytics, and channel orchestration in a single CPaaS layer while aligning with local carrier and regulatory requirements for delivery. Parallel initiatives like the ACCC's A2P SMS record-keeping proposal further increase demand for tooling that supports termination transparency, routing control, and reporting. This supports monetization of compliance automation, managed services, and multi-country governance features within CPaaS portfolios.
Recent Industry Developments in Asia-Pacific Communication Platform-as-a-Service Market
- July 2026: Route Mobile signed a Business Transfer Agreement to acquire the AI-driven omnichannel customer engagement business of Heltar Technologies Private Limited through its subsidiary Route Connect Private Limited. The deal adds AI-enabled engagement capabilities across channels such as WhatsApp, RCS, and voice, strengthening Route Mobile's ability to sell higher-value orchestration alongside core messaging APIs.
- February 2025: Twilio partnered with Singtel to deliver secure, branded RCS messaging for businesses in Singapore. The carrier-backed RCS integration supports richer messaging formats and enterprise trust controls, reinforcing a shift from plain SMS toward verified, high-engagement channels in the region.
- January 2024: Vonage and Telkomsel collaborated to make network APIs available to developers and enterprises in Indonesia. The partnership aligns CPaaS workflows with telecom network capabilities, expanding the addressable set of programmable functions beyond messaging into network-level features for enterprise applications.
Asia-Pacific Communication Platform-as-a-Service Market Report Scope and Research Methodology
Market Definition and Coverage
For this study, the market includes revenues earned from cloud communication platforms that let businesses embed messaging, voice, and similar communication functions into their apps through APIs across Asia Pacific.
Scope exclusions: It excludes consumer messaging app revenues, telecom core network spending, and pure contact center software that does not monetize communications usage.
Segments Covered in This Report
- By Organization Size
- Small and Medium-sized Enterprises (SMEs)
- Large Enterprises
- By End-User Industry
- IT and Telecom
- BFSI
- Retail and Consumer Goods
- Healthcare and Life Sciences
- E-commerce and Logistics
- Others
- By Communication Channel
- SMS and RCS
- Voice
- Video
- Email and Push
- In-app / OTT Chat
- By Component / Service Type
- Messaging APIs
- Voice APIs
- Video APIs and SDKs
- Multi-channel and Workflow Orchestration Platforms
- Professional and Managed Services
- By Geography
- China
- India
- Japan
- South Korea
- Southeast Asia
- Australia and New Zealand
- Rest of Asia-Pacific
Data Sources, Market Sizing, and Validation
Desk Research
Desk work started with building a country level view of digital adoption and communications demand, then mapping it to cloud communications usage. We referenced public sources such as the International Telecommunication Union (ITU) indicators, World Bank digital and macro series, national telecom regulators in Asia Pacific (for example, TRAI and ACMA), and OECD datasets where available for cross checks.
To align the model to real commercial activity, we also used company annual reports, investor presentations, earnings transcripts, and press releases around product launches and partnerships. Patent databases were used to understand where API driven communications and verification features are seeing stronger innovation signals. In a few places, we validated vendor scale and growth using a paid subscription for company financials and news intelligence, and we also used a paid shipment level import-export database as a directional check on related telecom hardware movement where it helped explain capacity rollouts. The desk sources listed here are not exhaustive, and many other public materials were also referred to for data collection, validation, and clarification.
Primary Interviews and Surveys
Primary calls and surveys were run with CPaaS platform teams, telecom partners, system integrators, and enterprise buyers that manage messaging and voice programs, so the practical pricing and usage drivers could be pinned down. Since Asia Pacific is not one uniform market, we covered demand and supply views across large economies and fast growing Southeast Asian markets, then checked assumptions on local routing, compliance, and channel mix before finalizing the model.
Distribution of primary research fieldwork respondents
| Company type | Respondent position |
|---|---|
| Top tier: 32% | CXOs: 14% |
| Mid tier: 54% | Functional/Unit leaders: 26% |
| Smaller Players: 14% | Managers: 60% |
Market-Sizing & Forecasting
The core model uses a top-down approach where enterprise communications demand is reconstructed from smartphone and internet penetration signals, digital commerce and banking activity, and the share of business messaging that is moving to API based delivery. Those demand pools are then converted into value using blended pricing logic, with country level adjustments for routing, regulatory requirements, and typical channel mix.
To keep totals realistic, we corroborated results with selective bottom-up checks. These included sampled vendor revenue disclosures, partner channel feedback, and simple volume x average price calculations for common CPaaS use cases. Inputs tracked closely include A2P messaging volumes, verification traffic, cloud adoption by enterprises, 5G and data coverage rollout pace, and observed price compression in high volume messaging corridors. Where direct data was thin for smaller countries, we used proxy indicators such as mobile subscriber base and digital transaction growth, then adjusted through expert feedback.
For forecasting, we relied on scenario analysis supported by trend lines on demand indicators and expected pricing movement. The final curve was moderated using what interviewees described as realistic adoption timing by industry and country.
Data Validation & Update Cycle
Validation was handled through several passes so that obvious overcounts and undercounts were caught early. We compared outputs against independent signals such as telecom messaging traffic discussions, cloud spend direction, and vendor commentary on regional mix. We then rechecked outliers at the country and use case level.
Before sign-off, the numbers are reviewed by another analyst who challenges the assumptions, unit logic, and currency conversions, and we re-contact sources when a key variance cannot be explained by known drivers. Reports are refreshed annually, and material events such as policy shifts, sharp price moves, or major routing changes can trigger interim adjustments. Right before delivery, a fresh review is completed so clients receive the most up to date view.
Mordor Intelligence's Asia Pacific Communication Platform As A Service Market Estimate Compared With Other Published Estimates
Published market values for CPaaS in Asia Pacific can look far apart, even when everyone is referencing the same general space. The gaps usually come from what is counted as CPaaS revenue, which countries are included, and how messaging and verification pricing is assumed to change over time.
In practice, the biggest differences come from whether estimates fold in adjacent UCaaS or CCaaS revenues, whether they treat WhatsApp style business messaging as part of CPaaS or as a separate bucket, and whether they use an aggressive or conservative view on A2P price compression. Another common driver is refresh cadence, since new local regulations on routing and consent can shift volumes quickly. Currency timing can also swing the USD total in a fast moving region.
Benchmark comparison
| Source | Market Size | Gaps in Research Methodology |
|---|---|---|
| Mordor Intelligence | USD 8.88 B (2025) | |
| Trade Journal A | USD 9.40 B (2023) | Uses an earlier base year and often blends CPaaS with broader cloud communications revenue, so the number can be higher even before pricing compression is fully applied. |
| Regional Consultancy B | USD 4.00 B (2024) | Leans on a narrower definition that emphasizes only API messaging revenue, and it can understate voice, authentication, and omnichannel usage that is bundled into enterprise programs. |
The table shows that most of the spread can be explained by timing and what sits inside the CPaaS scope, rather than by a single arithmetic issue. By separating usage based revenues from adjacent software categories and pressure testing pricing and volume assumptions through Asia Pacific specific checks, the estimate stays more traceable to real demand signals, which is the approach applied by Mordor Intelligence.
Key Questions Answered in the Report
What is the current size and growth outlook for the Asia-Pacific CPaaS market?
The market stands at USD 12.87 billion in 2026 and is projected to reach USD 82.19 billion by 2031, reflecting a 44.90% CAGR.
Which country generates the highest CPaaS revenue in Asia-Pacific?
China leads the region with 31.40% share in 2025, boosted by large-scale 5G roll-outs and extensive cloud infrastructure.
Which industry segment holds the largest share of CPaaS spending?
BFSI commands 25.10% of regional revenue, mainly through transaction notifications, number verification, and secure customer communications.
Which communication channel is expanding the fastest?
Video APIs record the strongest momentum, advancing at a 45.90% CAGR through 2031 as enterprises embed real-time video into mobile and web apps.