
Market Overview
| Study Period | 2021 - 2031 |
|---|---|
| Forecast Data Period | 2026 - 2031 |
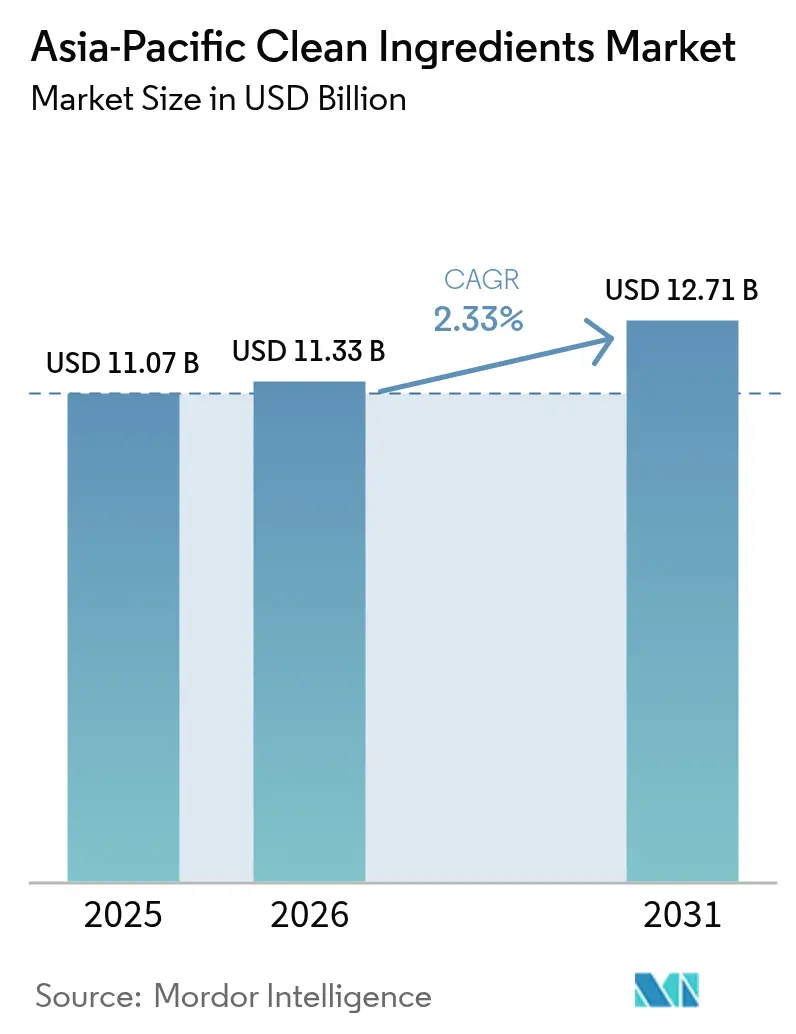
| Base Year Market Size (2025) | USD 11.07 Billion |
| Market Size (2026) | USD 11.33 Billion |
| Market Size (2031) | USD 12.71 Billion |
| Growth Rate (2026 - 2031) | 2.33 % |
| Market Concentration | Medium |
Major Players *Disclaimer: Major Players sorted in no particular order Image © Mordor Intelligence. Reuse requires attribution under CC BY 4.0. | |
Asia-Pacific Clean Ingredients Market Analysis by Mordor Intelligence
The Asia-Pacific clean ingredients market size is expected to grow from USD 11.07 billion in 2025 to USD 11.33 billion in 2026 and is forecast to reach USD 12.71 billion by 2031 at 2.33% CAGR over 2026-2031. As consumers increasingly demand transparency in labeling, the market for natural flavors, colors, preservatives, and sweeteners is expanding. However, growth is tempered by a fragmented regulatory landscape in the region, which complicates multi-country product launches and elevates compliance costs. In Asia, strong purchasing power in China, Japan, and South Korea drives demand for premium functional products. Meanwhile, rising middle-class consumption and expansive food-manufacturing corridors in Indonesia and India contribute significantly to the region's supply. Breakthroughs in precision fermentation are reducing costs for dairy-identical proteins and natural flavor molecules. This advancement is prompting beverage, dairy, and meat processors to opt for these natural alternatives over synthetic additives, without compromising on performance. However, the industry faces challenges: fluctuating prices of botanical feedstocks and mandates for reduced sugar content are squeezing profit margins. As a result, there's a noticeable shift in formulation strategies, leaning towards fiber bulking and blends of multiple sweeteners. Established multinationals are bolstering their positions through reformulation services and securing long-term contracts. In contrast, venture-backed start-ups are carving out profitable niches, focusing on areas like postbiotics and adaptogens, leading to a dynamic and varied competitive landscape.
Key Report Takeaways
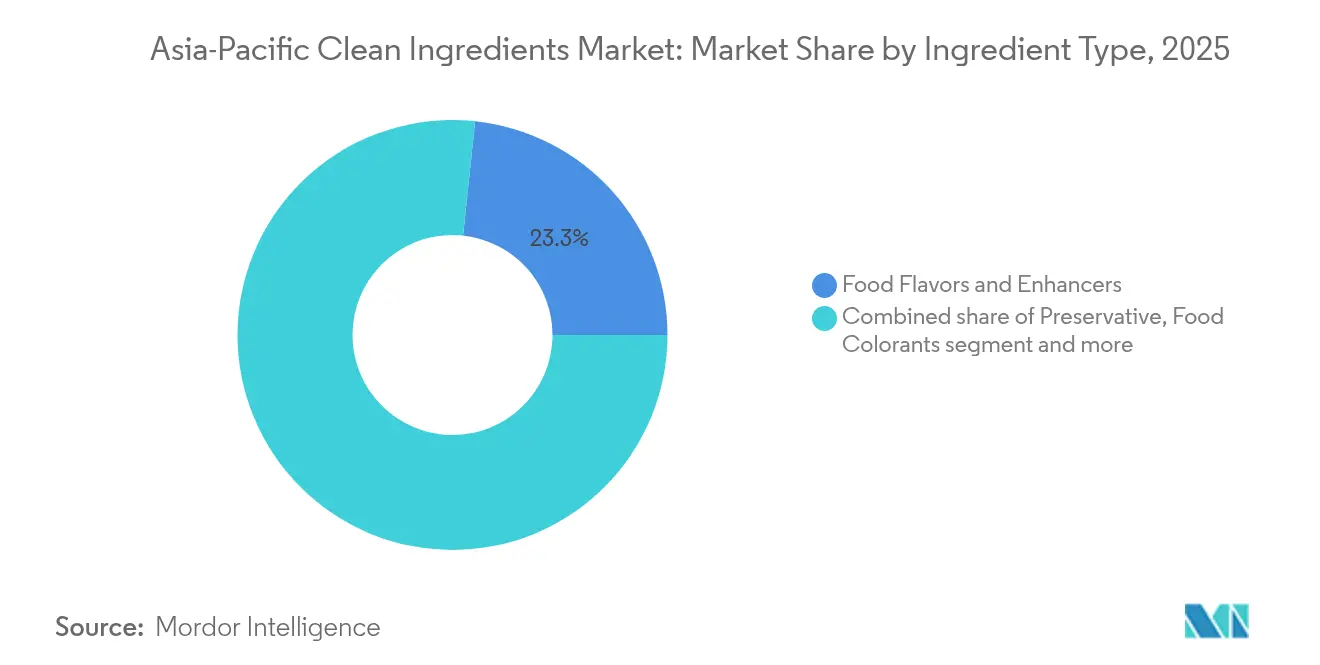
- By ingredient, food flavors and enhancers led with a 23.32% share of the Asia-Pacific clean ingredients market in 2025, while food colorants are expected to grow at a 4.86% CAGR between 2026 and 2031.
- By form, dry formats accounted for 61.42% of volume in 2025; liquid formulations recorded the fastest expansion at a 5.08% CAGR through 2031.
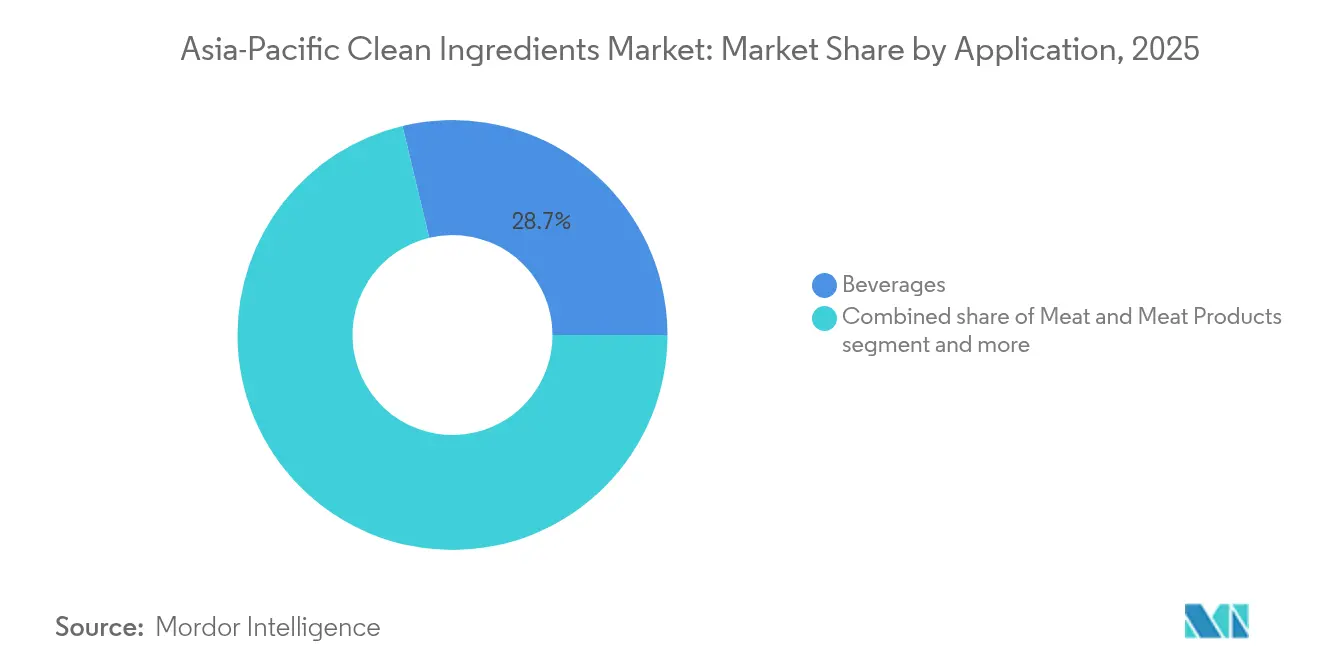
- By application, beverages held 28.74% of the 2025 share of the Asia-Pacific clean ingredients market size, whereas meat and meat products are forecast to advance at a 4.49% CAGR to 2031.
- By geography, China captured 41.02% of the Asia-Pacific clean ingredients market share in 2025, while Indonesia shows the highest trajectory at a 7.12% CAGR through 2031.
Note: Market size and forecast figures in this report are generated using Mordor Intelligence’s proprietary estimation framework, updated with the latest available data and insights as of 2026.
Market Trends and Insights
Drivers Impact Analysis of Asia-Pacific Clean Ingredients Market*
| Driver | (~) % Impact on CAGR Forecast | Geographic Relevance | Impact Timeline |
|---|---|---|---|
| Rising processed and convenience-food penetration | +0.6% | China, India, Indonesia, Vietnam | Medium term (2-4 years) |
| Shift toward natural/clean-label additives | +0.8% | Japan, South Korea, Australia, spillover to Thailand and Malaysia | Short term (≤2 years) |
| Expansion of functional/fortified launches | +0.5% | China and India metro areas | Medium term (2-4 years) |
| Investments in precision-fermentation platforms | +0.4% | Singapore, Australia, scale-up in China and India | Long term (≥4 years) |
| Government-backed food-manufacturing corridors | +0.3% | India, Thailand, Indonesia | Long term (≥4 years) |
| E-commerce-enabled micro-batch beverage start-ups | +0.2% | China, Japan, South Korea | Short term (≤2 years) |
| Source: Mordor Intelligence | |||
Rising processed and convenience-food penetration
As urban migration surges in China, India, Indonesia, and Vietnam, households increasingly turn to packaged snacks, ready meals, and shelf-stable drinks. This trend is propelling the adoption of clean-label preservatives and flavor systems in mainstream recipes. In a bid to align with retailer clean-label mandates without sacrificing microbial stability, manufacturers are replacing synthetic sorbates and benzoates with fermentation-derived lactic and acetic acids. In India, the Production Linked Incentive scheme has allocated a substantial INR 109 billion (USD 1.3 billion) to modernize domestic processing plants[1]. This initiative not only elevates baseline ingredient standards but also accelerates innovation cycles. Furthermore, enhanced cold-chain capacities in major cities are reducing spoilage and extending ingredient declaration periods. This development is particularly advantageous for suppliers of natural antioxidants and texture systems. Together, these industry shifts are driving up unit demand, even as per-unit inclusion rates stabilize due to reformulation efficiencies.
Shift toward natural/clean-label additives
In Japan, South Korea, and Australia, label-literacy campaigns are intensifying consumer scrutiny of ingredient lists. As a result, brands are increasingly replacing artificial colors and flavors with options derived from botanicals or fermentation. Japan has updated its 2024 guidelines, mandating the disclosure of synthetic processing aids. This has led producers of instant noodles and confections to pivot towards using extracts from turmeric, beet, and spirulina. Data from South Korea indicates a surge in the volumes of natural colorants being imported, as manufacturers actively seek out compliant alternatives. Meanwhile, Australia's Clean Label Standard, though voluntary, has taken a firm stance by banning 47 synthetic additives[2]. This move is steering investments towards enzyme-based processing and fermentation methods. In response to these regional shifts, multinational brands are aligning their recipes with the strictest local regulations. This harmonization is compelling regional suppliers to enhance their purification and documentation practices.
Expansion of functional/fortified food and beverage launches
Mainstream food categories are increasingly embracing claims related to immunity, gut health, and cognitive performance. This shift has spurred a heightened demand for bioavailable vitamins, probiotics, and standardized botanicals, especially those resilient to thermal or high-pressure processing. In 2024, China approved 87 new health-food products, marking a 23% increase from the previous year and underscoring a trend of regulatory openness. Meanwhile, India is taking steps to formalize claims related to probiotics, omega-3s, and plant sterols, thereby expanding its fortification toolkit. In the beverage sector, start-ups in both China and Japan are infusing ready-to-drink products with extracts such as ashwagandha, reishi, and lion's mane, driving a surge in the consumption of high-purity adaptogens[3]. Ingredient suppliers are setting themselves apart by employing microencapsulation techniques, ensuring active ingredients remain protected during ultra-high temperature processing and throughout distribution.
Investments in precision-fermentation ingredient platforms
Singapore's sovereign wealth funds, alongside Australia's CSIRO, spearhead significant financing rounds, boosting fermentation capacities for dairy proteins, fats, and flavor molecules, independent of traditional animal agriculture. These investments aim to scale production technologies, enabling the industry to meet growing demand for sustainable and animal-free alternatives. Due to government grants, the cost premium for precision-fermentation outputs has been slashed from threefold in 2023 to an anticipated 1.5-fold by 2025. This reduction paves the way for premium ice cream, yogurt, and nutrition-bar manufacturers to access these outputs, fostering innovation in product development. China's 14th Five-Year Plan places a strong emphasis on synthetic biology, channeling subsidies into optimizing microbial strains, thereby reducing downstream purification costs and enhancing production efficiency. These lowered prices are hastening a shift away from commodity casein and whey isolates, bolstering profit margins for early adopters and encouraging broader adoption across the food industry.
Restraints Impact Analysis of Asia-Pacific Clean Ingredients Market*
| Restraint | (~) % Impact on CAGR Forecast | Geographic Relevance | Impact Timeline |
|---|---|---|---|
| Stringent multi-jurisdiction regulatory approvals | −0.4% | China, India, Japan, Australia | Medium term (2-4 years) |
| Volatile prices of botanical/fermentation feedstocks | −0.3% | Vanilla, stevia, guar supply chains | Short term (≤2 years) |
| Nano- and micro-particle safety scrutiny | −0.2% | Australia, Japan, South Korea | Long term (≥4 years) |
| Sugar-reduction mandates curbing high-intensity sweetener demand | −0.2% | Thailand, Singapore, Malaysia | Medium term (2-4 years) |
| Source: Mordor Intelligence | |||
Stringent multi-jurisdiction regulatory approvals
Due to differing safety tests and disclosure rules in China, India, Japan, and Australia, suppliers face a clearance wait of up to 24 months for novel proteins or botanical extracts. China's GB 2760-2024 has tightened purity standards for natural colorants, requiring suppliers to resubmit dossiers that were previously accepted in other regions, thereby increasing regulatory hurdles. India mandates local clinical trials for probiotic strains, even those already recognized by U.S. or EU agencies, significantly inflating entry costs by an additional USD 200,000-500,000 per strain. This requirement not only raises financial barriers but also prolongs the approval process. In Australia and New Zealand, public consultations are mandatory for any novel food, which can extend launch timelines by six to nine months. These fragmented and region-specific protocols compel suppliers to stagger their rollouts across markets, resulting in delayed returns on investment and a slowdown in overall market growth, as companies struggle to navigate the complex regulatory landscape.
Volatile prices of botanical/fermentation feedstocks
In early 2024, vanilla prices surged to USD 600 per kg, driven by cyclone damage in Madagascar that disrupted supply chains and reduced global availability. However, prices later dipped to USD 450 per kg as alternative sources, such as Indonesia and Papua New Guinea, entered the market, increasing supply and intensifying competition. This price drop significantly squeezed margins for flavor houses bound by short-term contracts, limiting their profitability. In 2024, costs for stevia leaves in China fluctuated between CNY 18-28 per kg, a volatility attributed to weather-related harvest changes, including irregular rainfall patterns and temperature shifts that impacted crop yields. Meanwhile, in India and Thailand, biofuel mandates aimed at reducing carbon emissions pushed glucose and molasses feedstock prices up by 12-15% year on year, consequently elevating fermentation input costs for manufacturers. The absence of long-term hedging strategies has led to quarterly margin compressions, curtailing research and development budgets and stalling capacity expansions, thereby hindering innovation and growth in the industry.
*Our forecasts treat driver/restraint impacts as directional, not additive. The impact forecasts reflect baseline growth, mix effects, and variable interactions.
Asia-Pacific Clean Ingredients Market Segment Analysis
By Ingredient:
Fermentation-Derived Flavors Maintain Lead, Natural Colorants AccelerateIn 2025, Food Flavors and Enhancers dominated the Asia-Pacific clean ingredients market, capturing a 23.32% share. Their significance is underscored by their pivotal role in masking taste and adapting to regional flavors, particularly in beverages, baked goods, and savory snacks. This segment's growth is bolstered by a surge in beverage and ready-to-drink (RTD) coffee launches in China and Japan. Additionally, there's a growing trend among meat processors in Southeast Asia to adopt amino acid-based umami enhancers. To ensure consistent quality and supply, manufacturers are increasingly leaning on fermentation-derived solutions. Moreover, encapsulation technologies are being utilized to bolster flavor stability, especially in intricate processing settings.
Food Colorants are set to be the fastest-growing segment, with an anticipated expansion at a 4.86% CAGR through 2031, outpacing the broader market. Regulatory moves, like the ban on titanium dioxide in Australia and Japan, have hastened the shift towards natural pigments sourced from spirulina, beetroot, and turmeric. These clean-label options not only cater to consumer demands for safety and transparency but also ensure hue stability under varying pH and temperature conditions. Continuous research and development, coupled with enhanced extraction methods, are amplifying the performance and cost-effectiveness of these natural color systems, establishing them as pivotal innovation catalysts in the region's clean ingredient landscape.

By Form:
Dry Dominance Eases as Liquid Formats Close the GapIn 2025, dry ingredients dominated the Asia-Pacific clean ingredients market, holding a 61.42% share of the total volume. Their leading position is attributed to benefits like ambient stability, lower freight costs, and their use in dry applications such as powdered soups, bakery mixes, and instant noodles. These ingredients are crucial for products needing stringent moisture control. Suppliers are increasingly investing in agglomeration and microencapsulation techniques to boost dispersibility and reduce off-notes. While other forms see innovation, dry ingredients continue to lead due to their cost-effectiveness and stability, solidifying their dominance in key food and beverage sectors.
Liquid systems are set to be the fastest-growing segment, with a projected CAGR of 5.08% through 2031, outpacing the overall market. This growth is driven by precision-fermentation ingredients, delivered in aqueous form, to beverage, yogurt, and plant-based milk producers. This method simplifies incorporation and preserves bioactive integrity. Enhanced cold-chain networks in major cities minimize spoilage risks and facilitate just-in-time deliveries, optimizing working capital. With a rising demand for quick-dissolving, consistent formulations in ready-to-drink (RTD) and cultured dairy products, liquid systems are well-positioned to gain a larger share in high-functionality applications.
By Application:
Beverage Scale Remains Intact, Meat Preservation Shows Fastest GrowthIn 2025, beverages led the Asia-Pacific clean ingredients market, capturing 28.74% of the total market share. This leadership is driven by swift flavor rotations, a surge in product launches, and consumers' readiness to invest in functional claims. Natural flavors, clean-label colorants, and adaptogenic ingredients are in high demand, especially in ready-to-drink teas, protein shakes, and sparkling botanical beverages, often at premium prices. Moreover, the cross-category adoption of clean ingredient systems in dairy-style and fermented drinks underscores the segment's expansive influence and formulation significance across the region.
Meat and meat products are rapidly gaining traction, with projections indicating a 4.49% CAGR. This growth is fueled by processors moving away from synthetic curing agents. Manufacturers are increasingly turning to rosemary and green tea extracts, along with fermentation-derived lactates. These alternatives not only ensure pathogen control and extend shelf life but also sidestep nitrosamine issues. Similar transitions are evident in the bakery and confectionery sectors, where enzyme systems are now preferred over chemical dough conditioners, especially in premium breads. Beyond these, categories like dairy, frozen desserts, sauces, condiments, and snacks are experimenting with precision-fermentation proteins, potent natural colorants, and cultured-fat hybrids, signaling a broader acceptance and growth potential for clean ingredients beyond just beverages.
Geography Analysis
China and Indonesia Clean Ingredients Market
In 2025, China secured a dominant 41.02% share of the Asia-Pacific clean ingredients market. This was bolstered by the government's focus on synthetic biology and a surge in health-food registrations, driving both domestic and export demand. Ingredient manufacturers are reaping the benefits of concentrated food-processing hubs, which not only reduce logistics costs but also offer state-of-the-art testing facilities. These hubs enable faster product development cycles and ensure compliance with stringent quality standards, further strengthening China's position in the market. Meanwhile, Indonesia is on a growth trajectory, boasting the fastest rate at a 7.12% CAGR through 2031. The nation is capitalizing on its Halal certification infrastructure and an uptick in disposable incomes, making it an attractive destination for foreign direct investment (FDI) in new processing estates. The establishment of these estates is expected to enhance production capacity and cater to the growing demand for Halal-certified products both domestically and internationally.
APAC and MEA Clean Ingredients Market
India is leveraging its Mega Food Parks and Production Linked Incentives to entice ingredient producers into cost-effective zones. This strategy is not only boosting domestic sourcing but also enhancing export capabilities, particularly to the Middle East and Africa. The Mega Food Parks provide integrated infrastructure for food processing, reducing operational costs and improving supply chain efficiency. In the Asia-Pacific arena, Japan and South Korea are setting the pace. Their stringent labeling regulations compel multinationals to standardize recipes across the region, ensuring compliance and consistency in product offerings. Meanwhile, Australia is influencing the market with its voluntary Clean Label Standard, which is shaping private-label specifications and driving up demand for premium flavors, colors, and enzymes. This standard encourages transparency and aligns with consumer preferences for natural and minimally processed ingredients.
ASEAN Clean Ingredients Market
Southeast Asia is solidifying its position as a nimble production hub for global ingredient companies eyeing Muslim-majority markets. Thailand's Eastern Economic Corridor and Malaysia's Halal parks are pivotal in this development. These initiatives provide advanced infrastructure and incentives, attracting investments from global players and fostering innovation in ingredient production. In Vietnam, a burgeoning middle class is fueling increased consumption in dairy, bakery, and beverages. However, the country's regulatory framework is struggling to keep pace, leading to approval backlogs that hinder the introduction of novel ingredients. This regulatory lag poses challenges for companies aiming to launch innovative products, potentially delaying market entry and growth opportunities.
Regulatory Landscape
Regulation for clean ingredients in Asia-Pacific is set country-by-country, with most major markets maintaining positive lists and category-specific maximum use levels for additives. China implemented GB 2760-2024 in February 2025, tightening use conditions and purity expectations for permitted additives, which increases dossier and re-submission workloads for suppliers commercializing natural colors, flavors, and preservatives across multiple applications.
Alongside national rules, governments and regional bodies are moving toward partial alignment and clearer labeling frameworks. ASEAN updated its Maximum Use Levels of Food Additives (Annex I, 2025 publication), creating a shared reference for selected additives across member states, while Australia and New Zealand continue to regulate through the joint Food Standards Code (Standard 1.3.1) with maximum permitted levels. In June 2026, APFRAS (hosted in Seoul under South Korea's MFDS) issued the APFRAS Seoul 2026 Declaration that commits participating stakeholders to harmonization efforts, and several markets advanced nutrition-label initiatives (for example, Singapore Food Agency's SAFE framework launch in January 2026 and Indonesia's Nutri-Level front-of-pack labeling approval in April 2026), raising reformulation and documentation requirements for ingredient suppliers.
Value Chain Analysis
The value chain starts with agricultural and carbohydrate feedstocks (botanicals such as turmeric, beet, and stevia, plus glucose and molasses for fermentation), then moves into extraction, fermentation, blending, and stabilization steps (spray drying, microencapsulation, and standardization) before application testing and regulatory sign-off for target food categories. Across the region, a common split emerges: India, China, Indonesia, and Vietnam anchor raw material supply and primary processing, while Japan, South Korea, and Singapore operate as higher-value hubs for advanced processing, formulation science, and regulatory-grade documentation that supports multinational rollouts.
Compliance and cold-chain execution are the main friction points. Organic and non-GMO certifications and related credentials can take 6 to 12 months, and temperature-sensitive liquid systems and bioactives depend on dependable refrigerated storage and transport to preserve potency and reduce spoilage risk. Regulatory and labeling changes also add steps inside the chain, including Vietnam's Decree No. 46/2026/ND-CP (promulgated January 26, 2026) on guidance for conformity declarations covering food additives and primary packaging, and Indonesia BPOM's April 2026 Nutri-Level policy, which increases reformulation work for branded manufacturers. These factors tend to steer buyers toward suppliers that can provide integrated taste-texture-nutrition systems with traceability, analytical testing support, and multi-market regulatory readiness, rather than standalone commodities.
Competitive Landscape
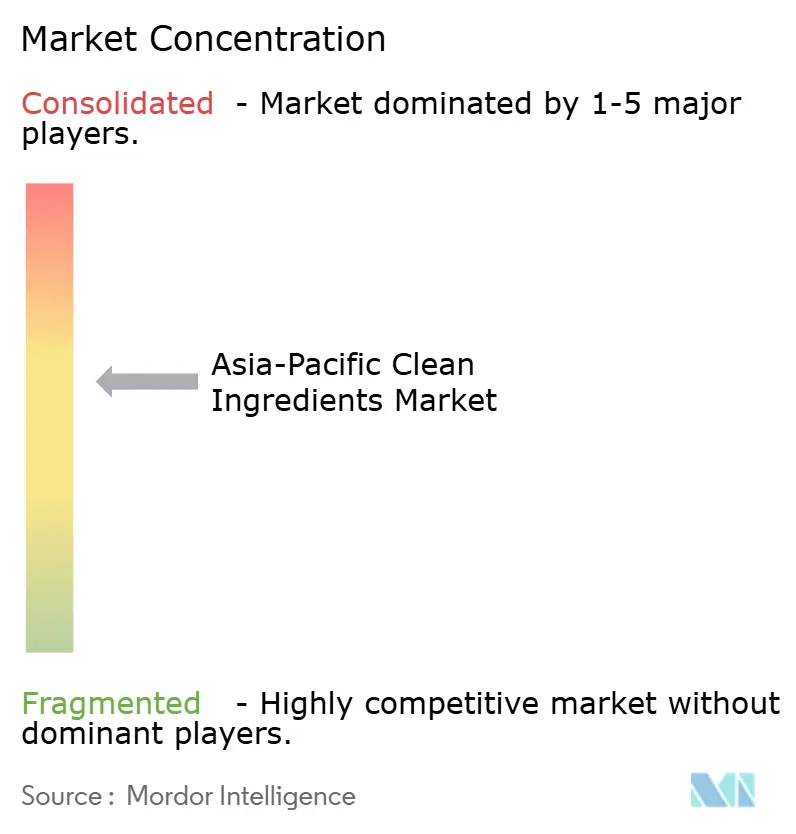
The Asia-Pacific clean ingredients market is moderately fragmented. Global giants like Cargill, ADM, Kerry, IFF, and Givaudan leverage integrated supply chains, technical support, and multi-year contracts with FMCG leaders to safeguard their volumes. Their investments span from securing commodity feedstocks, as highlighted by Cargill’s 60,000-ton cocoa expansion in Indonesia, to high-margin biotech platforms through strategic partnerships and M&A. These strategies enable them to maintain a competitive edge by ensuring consistent supply, fostering innovation, and building long-term customer relationships. A recent merger between DSM and Firmenich birthed a USD 13 billion nutrition behemoth, seamlessly integrating probiotics, enzymes, and flavors into cohesive solutions, thus accelerating customer development timelines and offering comprehensive product portfolios to meet diverse client needs.
Regional players like PureCircle in stevia, RZBC in citric acid, and COFCO Biochemical in fermentation-derived organics capitalize on local relationships and cost efficiencies, allowing them to undercut multinationals on high-volume SKUs. These companies benefit from their deep understanding of regional markets, enabling them to tailor their offerings and pricing strategies effectively. Meanwhile, venture-backed newcomers like TurtleTree and Superbrewed Food, specializing in dairy-identical proteins and postbiotics, leverage their lower overheads and adaptable production to secure pilot projects in sports nutrition and infant formulas. Their focus on innovation and niche markets positions them as agile competitors capable of addressing emerging consumer demands.
Chr. Hansen, Novozymes, and IFF, holding the reins on microbial strain optimization, are poised to drive future cost reductions, potentially positioning biotech ingredients in mid-tier price brackets. Their intellectual-property leadership ensures a steady pipeline of advancements, which could make these ingredients more accessible to a broader range of customers. Suppliers boasting in-house toxicology and regulatory teams can expedite multi-country dossier submissions by 12-18 months, creating a significant competitive edge over smaller rivals reliant on external consultants. This capability not only accelerates time-to-market but also strengthens their position in navigating complex regulatory landscapes.
Asia-Pacific Clean Ingredients Industry Leaders
-
Cargill Inc.
-
Archer Daniels Midland Co.
-
Kerry Group plc
-
Givaudan SA
-
International Flavors & Fragrances Inc
- *Disclaimer: Major Players sorted in no particular order
Asia-Pacific Clean Ingredients Market Companies Covered in this Report
- Cargill Inc.
- Archer Daniels Midland Co.
- Kerry Group plc
- Givaudan SA
- International Flavors & Fragrances Inc.
- Chr. Hansen Holding A/S
- Sensient Technologies Corp.
- Dohler GmbH
- DDW The Colour House
- Firmenich SA
- Symrise AG
- BASF SE
- Ingredion Inc.
- Tate & Lyle plc
- Ajinomoto Co. Inc.
- DSM-Firmenich AG
- Novozymes A/S
- PureCircle Ltd.
- COFCO Biochemical
- RZBC Group Co. Ltd.
- Corbion N.V.
Market Opportunities and Future Outlook
Manufacturing localization and application-led capacity additions are creating room for suppliers that can pair clean-label positioning with cost-competitive regional production. In July 2026, Givaudan inaugurated a new 24,000-square-metre flavor production facility in Cikarang, Indonesia, following a CHF 50 million investment, strengthening local supply of savory, sweet, and snack flavor powders for ASEAN processing corridors and reducing lead times versus imported blends. In China, Cargill broke ground in January 2026 on an expansion of its Beijing plant (over RMB 45 million), adding independent lines for flavored powdered beverages and flavored frozen coatings, aligned with the region's beverage and convenience-food demand centers.
Opportunities also emerge from fermentation-enabled substitution and regulatory-driven reformulation programs. In April 2026, Novonesis acquired a production facility in Rayong, Thailand (about USD 50 million) to expand fermentation capability, supporting broader adoption of biosolutions used as clean-label processing aids and functional systems. On the demand side, policy anchors such as Singapore's Nutri-Grade program (with scheduled expansion to sodium and fat in 2027) and ASEAN's Maximum Use Levels of Food Additives provide concrete triggers for reformulation work, particularly in beverages, sauces, and prepared foods where taste and preservation performance must hold up under tighter labeling scrutiny. Suppliers that can deliver stable natural color systems, fermentation-derived preservatives (lactates, acetates), and blended sweetening platforms that align with varying national positive lists can strengthen their position in multi-country launches.
Recent Industry Developments in Asia-Pacific Clean Ingredients Market
- July 2026: Givaudan inaugurated a new production facility in Cikarang, Indonesia, adding regional capacity to produce savory, sweet, and snack flavor powders. The investment strengthens local supply for ASEAN food manufacturing corridors and supports faster formulation iteration for clean-label flavor systems that need localized sensory tuning.
- May 2026: Amai Proteins received Singapore Food Agency approval for sweelin, its sweet protein, for use as a food additive. The approval expands the menu of novel sweetening tools available to manufacturers working under sugar-reduction and front-of-pack labeling regimes, while signaling a clearer pathway in Singapore for precision-fermentation-derived ingredient dossiers.
- October 2025: Arjuna Natural launched Shoden-R, a non-GMO ashwagandha extract derived solely from the root and positioned for functional foods and beverages. Standardization around withanolide glycosides supports consistent performance in finished products and helps brands manage label transparency while scaling adaptogen-based formulations.
Asia-Pacific Clean Ingredients Market Report Scope and Research Methodology
Market Definition and Coverage
This market covers the sales value of clean ingredients used by food and beverage manufacturers across Asia-Pacific. Here, the ingredient is positioned as recognizable, minimally processed, or free from specific artificial additives.
Scope exclusions: We exclude finished packaged foods sold to consumers, packaging materials, and on-premise foodservice revenue that does not reflect ingredient sales.
Segments Covered in This Report
- By Ingredient
- Food Preservatives
- Food Sweeteners
- Food Colorants
- Food Hydrocolloids
- Food Flavors and Enhancers
- Other Ingredients Types
- By Form
- Dry
- Liquid
- By Application
- Bakery and Confectionery
- Dairy and Frozen Desserts
- Beverages
- Meat and Meat Products
- Sauces, and Condiments
- Other Applications
- Country
- Australia
- China
- India
- Indonesia
- Japan
- Malaysia
- South Korea
- Thailand
- Vietnam
- Rest of Asia-Pacific
Data Sources, Market Sizing, and Validation
Desk Research
For desk research, we begin by mapping the demand base for processed foods and beverages in Asia-Pacific, since clean ingredient adoption typically shows up first at the manufacturing and formulation stage. Public sources such as FAOSTAT, UN Comtrade, national statistics offices (for example in China, India, Japan, and Australia), and customs and food regulator portals are reviewed to understand ingredient trade flows, labeling rules, and reformulation timing.
We then cross-check the direction of change using association releases and technical publications, such as ingredient and food science journals, food standards updates, and reputed press coverage of reformulation and additive replacement trends. Company annual reports, investor presentations, and product announcements help identify ingredient classes gaining volume, as well as which categories are being substituted. Where available, we also use paid subscriptions for company financials and intelligence, patent databases, and shipment-level import-export data to validate supplier footprints and pricing direction. These sources are illustrative, and we also reviewed other public and paid materials for data collection, validation, and clarification.
Primary Interviews and Surveys
Primary work is used to pressure-test assumptions that desk sources do not show clearly, especially the share of formulations shifting to natural colors, flavors, sweeteners, starches, and preservatives across key food categories. We speak with ingredient suppliers, distributors, contract manufacturers, and quality and regulatory teams in major Asia-Pacific countries so the model reflects real procurement patterns, specification changes, and pricing movements.
Distribution of primary research fieldwork respondents
| Company type | Respondent position |
|---|---|
| Top tier: 28% | CXOs: 17% |
| Mid tier: 54% | Functional/Unit leaders: 31% |
| Smaller Players: 18% | Managers: 52% |
Market-Sizing & Forecasting
Our sizing starts with a top-down build where processed food and beverage output, relevant ingredient import-export lines, and category-level reformulation signals are used to reconstruct the addressable spend for clean ingredients across Asia-Pacific. Once that demand pool is formed, we translate it into value using practical price bands by ingredient class and form, then adjust for country mix and channel realities.
To keep totals realistic, we corroborate with selective bottom-up checks, such as rolling up a sampled set of supplier revenues in the region, sanity-checking distributor margin structures, and comparing observed price per kilogram ranges against estimated volumes. Inputs that move the model include the share of clean label claims in new launches, replacement rates for artificial colors and preservatives, availability and pricing of botanical and fermentation feedstocks, local labeling and additive rules, and application mix shifts in bakery, beverages, dairy, and sauces.
For forecasting, we use scenario analysis supported by expert views on reformulation pace and raw material price direction, then smooth year-to-year changes so the trend reflects realistic adoption curves rather than sharp jumps. Where bottom-up information is incomplete for smaller countries, we use proxy indicators such as trade intensity, processed food production growth, and comparable adoption levels in nearby markets.
Data Validation & Update Cycle
We check outputs in several steps so the final number is not driven by one assumption. We compare modeled totals against independent signals such as ingredient trade balances, supplier expansion announcements, and changes in regulatory guidance, and then investigate any large variances before sign-off.
A second analyst review is completed for key inputs such as pricing logic, currency conversions, and country weights, and we re-contact experts when a parameter appears out of line. Reports are refreshed annually, with interim updates made when material events occur, such as major rule changes or meaningful shifts in raw material supply. Before delivery, an analyst runs a final pass to ensure clients receive the latest updated view.
Mordor Intelligence's Asia Pacific Clean Ingredients Market Size Compared Against Other Published Estimates
Published market values for clean ingredients in Asia-Pacific can vary a lot, mainly because the boundary of what is counted changes from one publisher to another. Differences can also come from how quickly pricing is refreshed, which food categories are treated as in-scope, and whether the estimate is tied back to observable demand signals.
By tracking ingredient-class price bands, adoption rates within core processed food categories, and country-level trade and production checks, Mordor Intelligence keeps the market total aligned to clean-ingredient sales into defined applications, rather than broader clean label food revenue.
Benchmark comparison
| Source | Market Size | Gaps in Research Methodology |
|---|---|---|
| Mordor Intelligence | USD 11.07 B (2025) | |
| Trade Journal A | USD 0.86 B (2025) | Often limited to packaged-food clean label claims and select ingredient groups, which can undercount starches, sweeteners, and application-specific blends sold through B2B channels. |
| Global Consultancy B | USD 13.51 B (2025) | May bundle adjacent specialty ingredients and broader natural additives into the scope, and may apply aggressive price inflation assumptions without consistent country-level validation. |
The spread in the table is mostly explained by scope boundaries and pricing logic, not by a single demand trend. When the model stays anchored to ingredient sales into defined applications and the price checks are repeatable, the result is easier to trace and replicate year after year.
Key Questions Answered in the Report
What is the current value of the Asia Pacific clean ingredients market?
The market is valued at USD 11.33 billion in 2026 and is projected to reach USD 12.71 billion by 2031.
Which ingredient segment holds the largest share?
Food Flavors and Enhancers account for 23.32% of 2025 revenue.
How fast are liquid formulation sales expanding?
Liquid systems register a 5.08% CAGR between 2026-2031.
Which application will add demand most quickly?
Meat and Meat Products show the fastest application growth at 4.49% CAGR, reflecting natural preservative uptake.