Market Overview
| Study Period | 2017 - 2030 |
|---|---|
| Base Year For Estimation | 2024 |
| Forecast Data Period | 2025 - 2030 |
| Market Size (2025) | USD 243.08 Billion |
| Market Size (2030) | USD 337.54 Billion |
| Growth Rate (2025 - 2030) | 6.79% CAGR |
| Market Concentration | Medium |
Major Players
*Disclaimer: Major Players sorted in no particular order Image © Mordor Intelligence. Reuse requires attribution under CC BY 4.0. |
|

Asia-Pacific Courier, Express, And Parcel (CEP) Market Analysis by Mordor Intelligence
The Asia-Pacific courier, express, and parcel market size stands at USD 243.08 billion in 2025 and is projected to reach USD 337.54 billion by 2030, advancing at a 6.79% CAGR between 2025-2030. This expansion reflects the region’s sustained e-commerce momentum, wider digital payments adoption, and supportive trade frameworks such as RCEP and CPTPP. Same-day fulfillment expectations have shifted from premium add-ons to baseline service levels, prompting heavy investment in urban micro-fulfillment assets. Operators that integrate real-time tracking, predictive routing, and temperature-controlled capacity are positioned to secure higher-margin volumes. Meanwhile, labor constraints and fuel price swings temper operating margins and incentivize automation.
Key Report Takeaways
- By destination, domestic shipments held 64.52% of the Asia-Pacific courier, express, and parcel market share in 2024, while international services are poised for the quickest expansion at 7.05% CAGR between 2025-2030.
- By speed of delivery, non-express deliveries commanded 58.46% of the Asia-Pacific courier, express, and parcel market size in 2024; express services record the fastest rise at 7.48% CAGR between 2025-2030.
- By model, the business-to-consumer (B2C) segment accounted for 52.29% of 2024 revenue, whereas consumer-to-consumer (C2C) values are expected to climb at a 4.96% CAGR between 2025-2030.
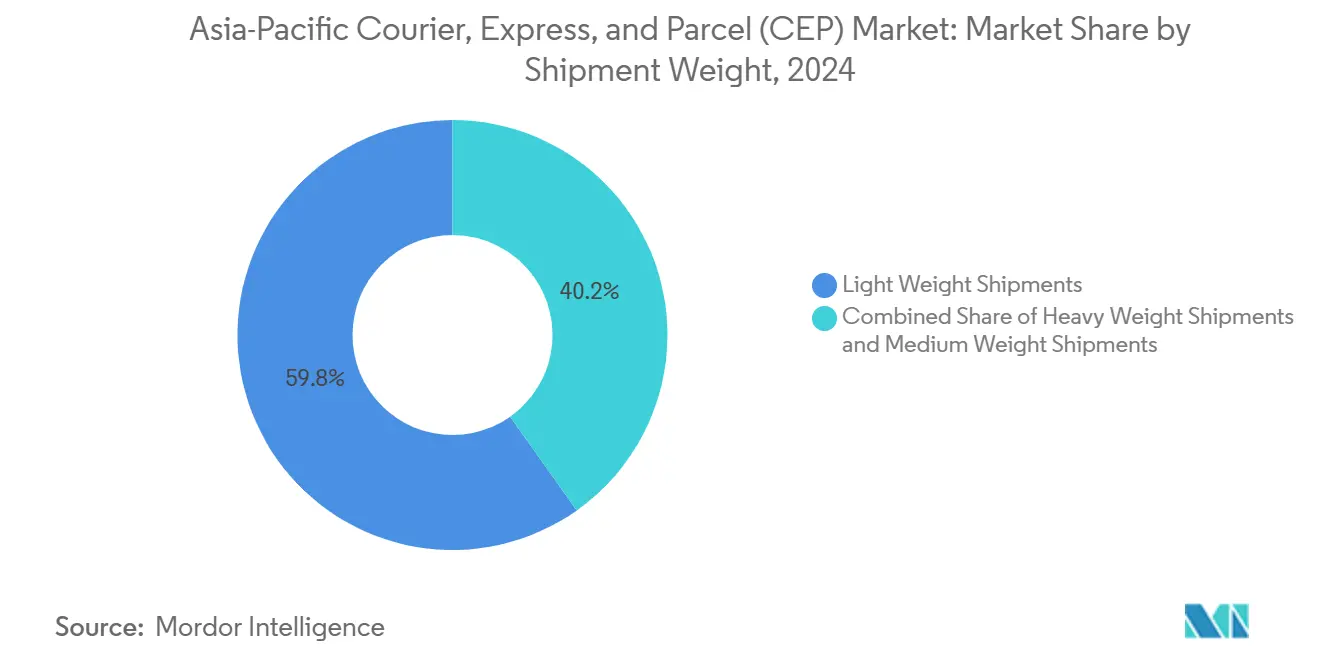
- By shipment weight, lightweight parcels dominated with a 59.80% share in 2024; heavyweight parcels exhibit the strongest growth at 5.66% CAGR between 2025-2030.
- By mode of transport, road transport led with 50.09% share in 2024 and air transport is projected to register the highest 5.77% CAGR between 2025-2030.
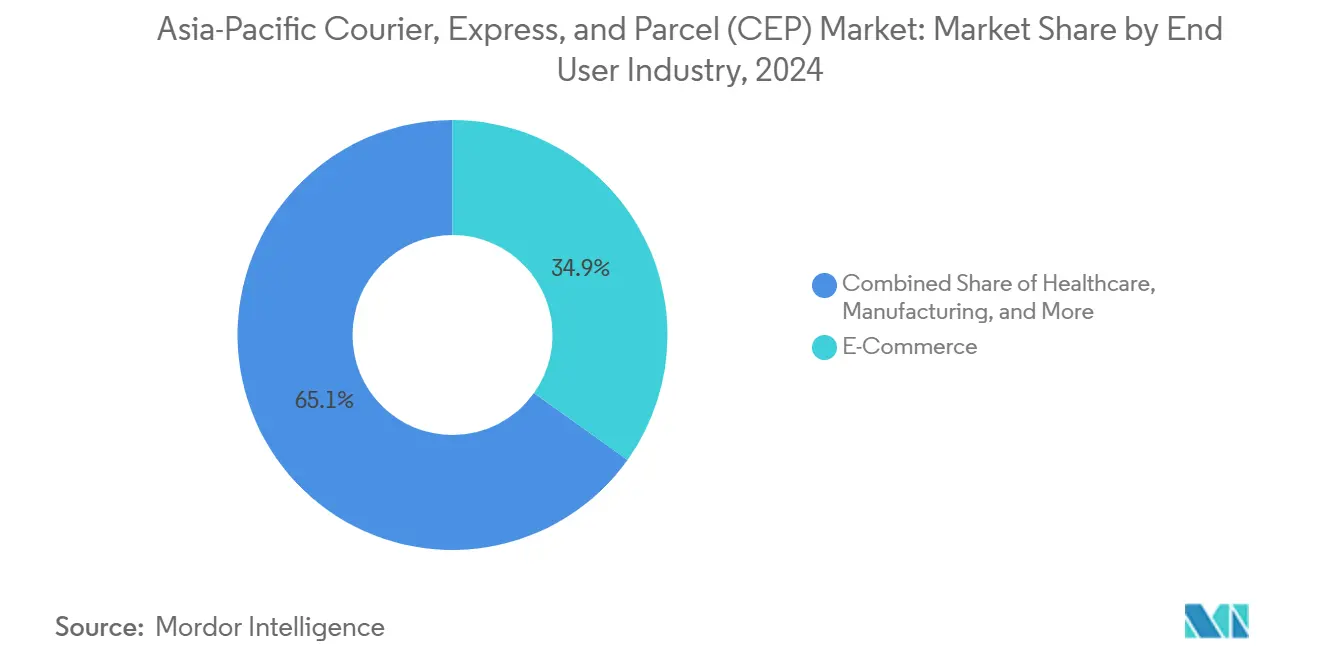
- By end user, e-commerce generated 34.85% of 2024 demand, while healthcare shows the fastest trajectory at 7.16% CAGR between 2025-2030.
- By country, China captured 58.38% of 2024 revenue; India is forecast to grow at 10.72% CAGR between 2025-2030, the highest among major economies.
Asia-Pacific Courier, Express, And Parcel (CEP) Market Trends and Insights
Drivers Impact Analysis
| Driver | (~) % Impact on CAGR Forecast | Geographic Relevance | Impact Timeline |
|---|---|---|---|
| E-commerce boom and same-day culture | +2.1% | China, India, Southeast Asia | Short term (≤ 2 years) |
| Cross-border e-tailer alliances (RCEP, CPTPP) | +1.8% | ASEAN, Australia, Japan, South Korea | Medium term (2-4 years) |
| Government smart-logistics corridors | +1.3% | China, India, ASEAN | Long term (≥ 4 years) |
| Cold-chain surge for biologics and fresh food | +0.9% | Japan, Australia, large urban centers | Medium term (2-4 years) |
| AI-driven route optimization and autonomous hubs | +0.7% | China, Japan, Singapore | Long term (≥ 4 years) |
| Micro-fulfillment and dark-store proliferation | +0.6% | Tier-1 metropolitan areas | Short term (≤ 2 years) |
| Source: Mordor Intelligence | |||
Understand The Key Trends Shaping This Market
Download PDF
E-commerce Boom and Same-Day Culture
Rising urban incomes and mobile internet access have entrenched next-day and same-day delivery as the new normal across leading Asian cities. Regional e-commerce value surpassed USD 2 trillion in 2024, and shoppers now abandon carts if express options are unavailable[1]Reuters Staff, “Asia-Pacific E-commerce Market to Reach $3.2 Trillion by 2028,” Reuters, reuters.com. Logistics firms respond by positioning inventory inside city-edge micro-fulfillment sites and using predictive analytics to consolidate orders by postcode. Same-day density boosts stop efficiency yet raise wages and real estate costs, prompting wider deployment of electric two-wheelers and automated lockers. Rapid-commerce grocery models compress fulfillment windows to under 30 minutes, forcing a redesign of traditional hub-and-spoke networks into nodal mesh layouts that prioritize proximity. These shifts underpin premium yield opportunities for operators able to keep unit costs in check.
Cross-Border E-Tailer Alliances (RCEP, CPTPP)
Tariff elimination on 90% of goods traded under RCEP and streamlined customs protocols under CPTPP have shortened average clearance times by one-third within member states[2]ASEAN Secretariat, “RCEP Overview,” ASEAN, asean.org. Mid-sized logistics providers now harness digital certificates of origin to offer two-day door-to-door delivery between Bangkok and Tokyo. Smaller sellers in the Philippines and Vietnam gain export access through marketplace tie-ups with regional integrators that bundle freight, duty pre-payment, and returns management. As import ceilings rise, parcel volumes shift from postal channels to premium express lanes, supporting rate integrity despite softening commodity prices. Enhanced interoperability across single-window platforms further shrinks paperwork and boosts service reliability.
Government Smart-Logistics Corridors
China’s 14th Five-Year Plan earmarks extensive railway and warehouse automation spending, while India’s National Logistics Policy targets a 5 percentage-point drop in logistics cost-to-GDP by 2030[3]Ministry of Commerce & Industry, “National Logistics Policy,” commerce.gov.in. Dedicated freight corridors and inland dry ports reduce hinterland transit by up to two days, improving network velocity. Public-private partnerships incorporate IoT-enabled checkpoints to share real-time congestion data with carriers, cutting detention fees. Integrated multimodal nodes encourage parcel operators to shift trunk legs from road to rail, balancing cost and emission goals. As corridors mature, economies of scale accrue to firms with nationwide reach, raising barriers for smaller incumbents.
Cold-Chain Surge for Biologics and Fresh Food
Temperature-controlled parcel flows rose 18% in 2024 on the back of vaccine distribution and direct-to-consumer meal kits. High-margin biologics demand continuous monitoring within 2–8°C tolerances, spurring investment in insulated totes, Bluetooth loggers, and cross-dock chill rooms. Japanese grocery chains now require sub-24-hour cold delivery across 500 km stretches, rewarding CEP operators that integrate refrigerated vans into last-mile fleets. Premium pricing unlocked by validated cold-chain lanes offsets capital intensity but necessitates stringent SOP adherence and real-time alerts to avoid spoilage penalties. Niche specialists partner with airlines to secure dedicated belly-hold space on overnight flights, ensuring schedule certainty.
Restraints Impact Analysis
| Restraint | (~) % Impact on CAGR Forecast | Geographic Relevance | Impact Timeline |
|---|---|---|---|
| Urban driver-hour caps and labor shortages | -1.4% | Singapore, Japan, megacities | Short term (≤ 2 years) |
| Volatile bunker and jet-fuel surcharges | -0.8% | International lanes | Medium term (2-4 years) |
| Addressing-system gaps in tier-2/3 cities | -0.6% | India, Indonesia, Vietnam | Medium term (2-4 years) |
| Geopolitical trade-lane disruptions | -0.4% | South China Sea routes | Long term (≥ 4 years) |
| Source: Mordor Intelligence | |||
Urban Driver-Hour Caps and Labor Shortages
Singapore’s 44-hour weekly limit and Tokyo’s downtown truck curfews constrain peak-hour capacity. Aging demographics in Japan and South Korea shrink the available workforce even as parcel counts climb. Chinese tier-one cities saw logistics wages climb during 2024, with operators offering sign-on bonuses to secure riders. To mitigate exposure, carriers extend alternative collection points and test sidewalk robots. Yet autonomous options remain at pilot scale, keeping tight labor supply a near-term constraint.
Volatile Bunker and Jet-Fuel Surcharges
Global shipping costs spiked with energy market fluctuations, lifting jet fuel indices 25% in 2024[4]International Air Transport Association, “Fuel Monitor 2024,” IATA, iata.org. Express firms with high airlift dependency grapple with lagging surcharge pass-through in annual contracts. Hedging strategies cover core lanes, but secondary routes remain exposed. Road carriers shift toward electric vans where charging grids allow, insulating long-run cost structures yet requiring upfront capital. Persistent volatility urges multi-modal diversification and adaptive pricing clauses.
Segment Analysis
By End User Industry: E-Commerce Leads, Healthcare Accelerates
E-commerce contributed 34.85% of parcel demand in 2024, reflecting entrenched online shopping behavior. Healthcare deliveries advance at a 7.16% CAGR between 2025-2030, driven by biologics, clinical trial samples, and home-care devices. The Asia-Pacific courier, express, and parcel market supports regulatory-compliant cold-chain lanes featuring passive packaging and real-time sensors.
Manufacturing maintains a stable baseline through just-in-time raw-material flows, while financial services require secure, tracked movement of confidential documents. Grocery quick commerce stretches network capacity with high-frequency, low-ticket orders demanding near-instant dispatch.
Note: Segment shares of all individual segments available upon report purchase
Get Detailed Market Forecasts at the Most Granular Levels
Download PDF
By Destination: International Momentum Strengthens
International parcel flows expanded at a 7.05% CAGR between 2025-2030, even as domestic consignments retained a commanding 64.52% hold on the Asia-Pacific courier, express, and parcel market in 2024. Customs digitalization under RCEP cuts border dwell time, enabling 2- to 3-day delivery between key metropolitan pairs. The Asia-Pacific courier, express, and parcel market size linked to cross-border e-commerce is forecast to grow steadily through 2030. Domestic density advantages support low unit costs, but same-day guarantees pressure margins in megacities.
Cross-border demand is strongest among mid-market exporters pursuing supply-chain diversification. Quick commerce marketplaces now promise 72-hour delivery for niche Korean beauty products into Southeast Asia, with buyers paying double the standard tariff for premium tracking. Addressing gaps and language barriers persists, yet is gradually mitigated through shared data interfaces between customs, carriers, and marketplaces.
By Speed of Delivery: Express Gains Share
Non-express still leads volume with 58.46% share, anchored by cost-sensitive B2B buyers. Nevertheless, express lanes are expanding at a 7.48% CAGR between 2025-2030, thanks to rising urban incomes. The Asia-Pacific courier, express, and parcel market benefits from layered service tiers that reward on-time performance. AI-driven routing enables tighter delivery windows without proportional cost spikes, pushing legacy postal services to upgrade automation.
Standard services continue to secure rural demand where price trumps speed. Growth in express reflects consumers’ readiness to fund convenience, particularly for electronics and fashion. Preferential access to urban loading zones in Japan and Australia, granted under critical-infrastructure designations, further elevates express competitiveness in congested corridors.
By Shipment Weight: Light Parcels Dominate
Light consignments occupy 59.80% share in 2024 due to frequent, low-value e-commerce orders. Heavy packages expand at a 5.66% CAGR between 2025-2030, supported by industrial spare-parts flows and home-appliance restocking. Handling light parcels yields thinner revenue per stop, heightening focus on automated sorting to sustain profitability. The Asia-Pacific Courier, Express, and Parcel market share for light parcels remains high yet invites innovation in dimension-weight pricing to reflect true cost.
Subscription models further amplify shipment frequency while reducing average carton size. Miniaturization in consumer electronics raises the value density of medium-weight shipments, allowing airlines to monetize belly-hold space more effectively.
Note: Segment shares of all individual segments available upon report purchase
Get Detailed Market Forecasts at the Most Granular Levels
Download PDF
By Mode of Transport: Road Retains Edge
Road transport accounted for a 50.09% share in 2024 on the back of vast intracity and short-haul needs. Dedicated highway investments under Belt and Road improve average speeds while EV fleet adoption supports emissions compliance. Air transport shows a 5.77% CAGR between 2025-2030 as cross-border premium shipping climbs. The Asia-Pacific Courier, Express, and Parcel market size for air-based lanes rises with lightweight, high-value electronics and fashion.
Rail links such as the China-Laos line carve a modest niche for bulky yet time-sensitive goods, while waterways serve cost-driven lanes. Multimodal orchestration tools harmonize handoffs, balancing reliability and cost.
By Model: B2C Rules, C2C Emerges
The B2C segment held a 52.29% share in 2024 as brands deepen direct-to-consumer channels. The Asia-Pacific courier, express, and parcel market size attributable to C2C interactions is smaller but rising through social commerce and second-hand platforms. Unified payment rails in India reduce cash-on-delivery reliance, enhancing drop efficiency.
Live-stream selling in China creates pulse demand events where sellers pre-stage inventory in bonded warehouses positioned near consumption clusters. C2C volumes are expected to grow at a 4.96% CAGR between 2025-2030, as hobbyists and micro-entrepreneurs capitalize on low entry barriers, prompting carriers to launch smartphone-based label printing and doorstep handover services.
Geography Analysis
China held 58.38% of the Asia-Pacific courier, express, and parcel market in 2024, fueled by dense e-commerce ecosystems and state-backed smart-logistics corridors. Integrated digital wallets, super-apps, and real-time visibility platforms support seamless shopper experiences. Automated mega-hubs outside Shanghai and Shenzhen sort over 100,000 parcels per hour, underpinning a low cost per piece. Yet geopolitical tensions and near-shoring trends encourage multinationals to diversify sourcing, which may temper China’s growth lead.
India is on track for the highest 10.72% CAGR between 2025-2030 as digital infrastructure expands. Unified Payments Interface ubiquity reduces failed cash-on-delivery attempts, and GST harmonization cuts interstate paperwork. The government targets to lower the logistics cost-to-GDP, stimulate private-sector investments in multimodal parks. Tier-2 and tier-3 cities account for most incremental parcel growth as smartphone adoption proliferates.
Japan and Australia represent service-quality benchmarks, demanding near-perfect on-time ratios and advanced environmental compliance. Labor scarcity accelerates autonomous sorting and electric fleet pilots. Southeast Asia, led by Indonesia, Vietnam, and Thailand, benefits from youthful demographics and rising disposable incomes. ASEAN connectivity programs slash customs friction, driving intra-bloc parcel flows. Singapore’s status as logistics and financial nucleus positions it for high-value trans-shipment while Malaysia leverages free-zone infrastructure for regional distribution.
Competitive Landscape
Competitive intensity is moderately consolidated, with global integrators, regional champions, and tech-native entrants forming a three-tier hierarchy. SF Express and ZTO Express deploy AI-enabled sorters and dynamic pricing engines, challenging incumbents on speed and cost. DHL, FedEx, and UPS continue to invest in cross-border lane quality, customs brokerage, and healthcare logistics to differentiate on reliability.
Regional postal operators leverage dense last-mile networks but must modernize legacy IT to match private-sector service levels. Start-ups aggregate gig-based couriers via app marketplaces, offering flexible coverage in underserved suburbs. Nonetheless, high capex for automated hubs and aircraft fleets favors players with robust balance sheets, slowing disruptive displacement. Partnership models flourish: airlines sell block space to CEP firms, while retailers co-invest in micro-fulfillment sites to secure dedicated capacity.
Mid-market carriers pursue vertical specialization in cold-chain and oversized freight, sidestepping direct competition with integrators. Technology adoption—computer vision for dimensioning, digital twin simulations, and blockchain for provenance—has become a baseline requirement rather than a differentiator.
Asia-Pacific Courier, Express, And Parcel (CEP) Industry Leaders
-
China Post
-
SF Express (KEX-SF)
-
DHL Group
-
Yamato Holdings Co., Ltd.
-
Shanghai YTO Express (Logistics) Co., Ltd.
- *Disclaimer: Major Players sorted in no particular order

Need More Details on Market Players and Competitors?
Download PDF
Recent Industry Developments
- September 2025: UPS expanded its intra-Asia air network, adding direct Shenzhen–Sydney flights to enhance Asia–Pacific lane reliability.
- July 2025: China Post introduced three intercontinental cargo routes from Guangzhou, Nanjing, and Zhengzhou to Luxembourg to speed up cross-border e-commerce deliveries.
- June 2025: FedEx Express shifted to a direct-serve model in Vietnam to capitalize on rising export parcel demand.
- April 2025: DHL committed EUR 2 billion (USD 2.20 billion) to Life Sciences & Healthcare capabilities, assigning EUR 500 million (USD 551.82 million) to Asia-Pacific cold-chain projects.
Asia-Pacific Courier, Express, And Parcel (CEP) Market Report Scope
Domestic, International are covered as segments by Destination. Express, Non-Express are covered as segments by Speed Of Delivery. Business-to-Business (B2B), Business-to-Consumer (B2C), Consumer-to-Consumer (C2C) are covered as segments by Model. Heavy Weight Shipments, Light Weight Shipments, Medium Weight Shipments are covered as segments by Shipment Weight. Air, Road, Others are covered as segments by Mode Of Transport. E-Commerce, Financial Services (BFSI), Healthcare, Manufacturing, Primary Industry, Wholesale and Retail Trade (Offline), Others are covered as segments by End User Industry. Australia, China, India, Indonesia, Japan, Malaysia, Pakistan, Philippines, Thailand, Vietnam are covered as segments by Country.
Destination
| Domestic |
| International |
Speed of Delivery
| Express |
| Non-Express |
Model
| Business-to-Business (B2B) |
| Business-to-Consumer (B2C) |
| Consumer-to-Consumer (C2C) |
Shipment Weight
| Heavy Weight Shipments |
| Light Weight Shipments |
| Medium Weight Shipments |
Mode of Transport
| Air |
| Road |
| Others |
End User Industry
| E-Commerce |
| Financial Services (BFSI) |
| Healthcare |
| Manufacturing |
| Primary Industry |
| Wholesale and Retail Trade (Offline) |
| Others |
Country
| Australia |
| China |
| India |
| Indonesia |
| Japan |
| Malaysia |
| Pakistan |
| Philippines |
| Thailand |
| Vietnam |
| Rest of Asia-Pacific |
| Destination | Domestic |
| International | |
| Speed of Delivery | Express |
| Non-Express | |
| Model | Business-to-Business (B2B) |
| Business-to-Consumer (B2C) | |
| Consumer-to-Consumer (C2C) | |
| Shipment Weight | Heavy Weight Shipments |
| Light Weight Shipments | |
| Medium Weight Shipments | |
| Mode of Transport | Air |
| Road | |
| Others | |
| End User Industry | E-Commerce |
| Financial Services (BFSI) | |
| Healthcare | |
| Manufacturing | |
| Primary Industry | |
| Wholesale and Retail Trade (Offline) | |
| Others | |
| Country | Australia |
| China | |
| India | |
| Indonesia | |
| Japan | |
| Malaysia | |
| Pakistan | |
| Philippines | |
| Thailand | |
| Vietnam | |
| Rest of Asia-Pacific |
Need A Different Region or Segment?
Customize Now
Market Definition
- Courier, Express, and Parcel - The Courier, Express, and Parcel services, often called as CEP Market, refers to the logistics and postal service providers which specialize in moving small goods (parcels/packages). It captures the overall market size (USD) and market volume (number of parcels) of (1) the shipments/parcels/packages which are under 70kgs/ 154lbs weight, (2) Business Customer packages viz. Business-to-Business (B2B) & Business-to-Consumer (B2C) as well as private customer packages (C2C), (3) non-express parcel delivery services (Standard and Deferred) as well as express parcel delivery services (Day-Definite-Express and Time-Definite-Express), (4) domestic as well as international shipments.
- Demographics - To analyse total addressable market demand, population growth & forecasts have been studied and presented in this industry trend. It represents population distribution across categories like gender (male/female), development area (urban/rural), major cities among other key parameters like population density and final consumption expenditure (growth and share % of GDP). This data has been used for assessing the fluctations in demand & consumption expenditure, and the major hotspots (cities) of potential demand.
- Domestic Courier Market - Domestic Courier Market refers to the CEP shipments wherein the origin and destination is within the boundary of the geography studied (country or region as per the scope of report). It captures the market size (USD) and market volume (number of parcels) of (1) the shipments/parcels/packages which are under 70kgs/ 154lbs weight, including light weight shipments, medium weight shipments and heavy weight shipments (2) Business Customer packages viz. Business-to-Business (B2B) & Business-to-Consumer (B2C) as well as private customer packages (C2C), (3) non-express parcel delivery services (Standard and Deferred) as well as express parcel delivery services (Day-Definite-Express and Time-Definite-Express).
- E-Commerce - This end user industry segment captures the external (outsourced) logistics expenditure incurred by the e-tailers, through online sales channel, on Courier, Express, and Parcel (CEP) services. The scope includes (i) the supply chain of a company's online customer orders being fulfilled, (ii) the process of getting a product from the point of manufacturing to the point at which it is delivered to consumers. It involves managing inventory (deferred as well as time critical), shipping, and distribution.
- Export Trends and Import Trends - Overall logistics performance of an economy is positively and significantly (statistically) correlated to its trade performance (exports and imports). Hence, in this industry trend, total value of trade, major commodities/ commodity groups and the major trade partners, for the studied geography (country or region as per the scope of report) have been analysed alongside the impact of major trade/logistics infrastructure investments & regulatory environment.
- Financial Services (BFSI) - This end user industry segment captures the external (outsourced) logistics expenditure incurred by the BFSI players, on Courier, Express, and Parcel (CEP) services. CEP is important to the financial services industry in shipping of confidential documents and files. The establishments in this sector are engaged in (i) financial transactions (that is, transactions involving the creation, liquidation, or change in ownership of financial assets) or in facilitating financial transactions, (ii) financial intermediation, (iii) the pooling of risk by underwriting annuities and insurance, (iv) providing specialized services that facilitate or support financial intermediation, insurance and employee benefit programs, and (v) monetary control - the monetary authorities.
- Fuel Price - Fuel price spikes can cause delays and diruption for logistics service providers (LSPs), while drops in the same can result in higher short-term profitability and increased market rivalry to offer consumers with the best deals. Hence, the fuel price variations have been studied over the review period and presented along with the causes as well as market impacts.
- GDP Distribution by Economic Activity - Nominal Gross Domestic Product and distribution of the same, across major economic sectors in the geography studied (country or region as per scope of the report) have been studied and presented in this industry trend. As GDP is positively related to the profitability and growth of logistics industry, this data has been used in adjunction to the input-output tables/ supply-use tables for analyzing the potential major contributing sectors towards the logistics demand.
- GDP Growth by Economic Activity - Growth of Nominal Gross Domestic Product across major economic sectors, for the geography studied (country or region as per scope of the report) have been presented in this industry trend. This data has been utilized for assessing the growth of logistics demand from all the market end users (economic sectors considered here).
- Healthcare - This end user industry segment captures the external (outsourced) logistics expenditure incurred by the Healthcare players (Hospitals, clinics, mrdical centres) , on Courier, Express, and Parcel (CEP) services. The scope includes CEP services involved in the defrerred as well time critical movement of medical goods & supplies (surgical supplies and instruments, including gloves, masks, syringes, equipment). The establishments in this sector (i) include the ones providing medical care exclusively (ii) deliver services by trained professionals (iii) involve processes, including labor inputs of health practitioners with the requisite expertise (iv) are defined based on the educational degree held by the practitioners included in the industry.
- Inflation - Variations in both Wholesale Price Inflation (YoY change in producer price index) and Consumer Price Inflation have been presented in this industry trend. This data has been used to assess the inflationary environment as it plays a vital role in smooth functioning of the supply chain, directly impacting the logistics operational cost components e.g., pricing of tyres, driver wages & benefits, energy/fuel prices, maintenace costs, toll charges, warehousing rents, custom brokerage, forwarding rates, courier rates etc. hence impacting the overall freight and logistics market.
- Infrastructure - As infrastructure plays a vital role in an economy's logistics performance, variables like length of roads, distribution of road length by surface category (paved v/s unpaved), distribution of road length by road classification (expressways v/s highways v/s other roads), rail length, volume of containers handled by major ports and tonnage handled by major airports have been analysed and presented in this industry trend.
- International Express Service Market - International Express Service Market refers to the CEP shipments wherein the origin or destination is not within the boundary of the geography studied (country or region as per the scope of report). It captures the market size (USD) and market volume (number of parcels) of (1) the shipments/parcels/packages which are under 70kgs/ 154lbs weight, including light weight shipments, medium weight shipments and heavy weight shipments (ii) Inter-Region as well as Intra-Region Shipments
- Key Industry Trends - The report section named "Key Industry Trends" include all the key variables/parameters studied to better analyze the market size estimates and forecasts. All the trends have been presented in the form of data points (time series or latest available data points) along with analysis of the paramter in the form of concise market relevant commentary, for the geography studied (country or region as per the scope of report).
- Key Strategic Moves - The action taken by a company to differentiate from its competitor or used as a general strategy is referred to as a key strategic move (KSM). This includes (1) Agreements (2) Expansions (3) Financial Restructuring (4) Mergers and Acquisitions (5) Partnerships, and (6) Product Innovations. Key players (Logistics Service Providers, LSPs) in the market have been shortlisted, their KSM have been studied and presented in this section.
- Logistics Performance - Logistics Performance and Logistics Costs are the backbone of trade, and influences trade costs, making countries compete globally. Logistics performance is influenced by market wide adopted supply chain management strategies, government services, investments & policies, fuel/ energy costs, inflationary environment etc. Hence, in this industry trend, the logistics performance of the geography studied (country/ region as per the scope of report) has been analysed and presented over the review period.
- Manufacturing - This end user industry segment captures the external (outsourced) logistics expenditure incurred by the Manufacturing industry (including Hi-Tech/Technology) players, on Courier, Express, and Parcel (CEP) services. The end user players considered are the establishments primarily engaged in the chemical, mechanical or physical transformation of materials or substances into new products. Logistics Service Providers (LSPs) play a crucial role in maintaining a smooth flow of raw materials across the supply chain, enabling timely delivery of finished goods to distributors or end customers and storing & supplying the raw materials to clients for just-in-time manufacturing.
- Other End Users - Other end user segment captures the external (outsourced) logistics expenditure incurred by the construction, real estate, educational services, and professional services (administrative, waste management, legal, architectural, engineering, design, consulting, scientific R&D), on Courier, Express, and Parcel (CEP) services. Logistics Service Providers (LSPs) plays a crucial role in the reliable movement of time critical supplies and documents to/from these industries such as transporting any equipment or resources required, shipping confidential documents and files.
- Primary Industry - This end user industry segment captures the external (outsourced) logistics expenditure incurred by the AFF (Agriculture, Fishing, and Forestry) and Extraction indsutry (Oil &Gas, Quarrying and Mining) players, on Courier, Express, and Parcel (CEP) services. The end user players considered are the establishments (i) primarily engaged in growing crops, raising animals, harvesting timber, harvesting fish & other animals from their natural habitats and providing related support activities; (ii) that extract naturally occurring mineral solids, such as coal and ores; liquid minerals, such as crude petroleum; and gases, such as natural gas. Herein, Logistics Service Providers (LSPs) (i) play a crucial role in acquisition, storage, handling, transportation, and distribution activities for the optimal & continuous flow of inputs (seeds, pesticides, fertilizers, equipment, and water) from manufacturers or suppliers to the producers and smooth flow of output (produce, agro-goods) to distributors/ consumers; (ii) cover entire phases from upstream to downstream and play a crucial role in the transportation of machinery, drilling equipments, extracted minerals, crude oil & natural gas and refined/ processed products from one place to another. This includes both termperature controlled and non-temperature controlled logistics, as and when required according to the shelf life of goods being transported or stored.
- Producer Price Inflation - It indicates inflation from viewpoint of the producers viz. the average selling price received for their output over a period of time. Annual change (YoY) of producer price index is reported as wholesale price inflation in the "Inflation" industry trend. As WPI captures dynamic price movements in most comprehensive way, it is widely used by governments, banks, industry, business circles and is deemed important in formulation of trade, fiscal and other economic policies. The data has been used in adjunction to consumer price inflation for better understanding the inflationary environment.
- Segmental Revenue - Segmental Revenue has been triangulated or computed and presented for all the major players in the market. It refers to the courier, express, and parcel (CEP) market specific revenue earned by the company, over the base year of study, in the geography studied (country or region as per the scope of report). It is computed through the study and analysis of major parameters like financials, service portfolio, employee strength, fleet size, investments, number of countries present in, major economies of concern, etc. that have been reported by the company in its annual reports, webpage. For companies having scarce financial disclosures, paid databases like D&B Hoovers, Dow Jones Factiva have been resorted to and verified through industry/expert interactions.
- Transport and Storage Sector GDP - Value and growth of Transport and Storage Sector GDP has a direct relation to the freight and logistics market size. Hence, this variable has been studied and presented over the review period, in value terms (USD) and as share % of total GDP, in this industry trend. The data has been supported by concise and relevant commentary around the investments, developments, and current market scenario.
- Trends in E-Commerce Industry - Enhanced internet connectivity and boom in smartphone penetration, coupled with increasing disposable incomes, has led to a phenomenal growth in the e-commerce market globally. Online shoppers require fast and efficient delivery of their orders leading to an increase in the demand for logistics services especially e-commerce fulfilment services. Hence, the Gross Merchandise Value (GMV), historial and projected growth, breakup of major commodity groups in e-commerce industry for the studied geography (country or region as per scope of the report) have been analysed and presented in this industry trend.
- Trends in Manufacturing Industry - Manufacturing industry involves the transformation of raw materials into finished products, while logistics industry ensures the efficient flow of raw materials to the factory, and the transport of manufactured products to the distributors & consumers. Demand-Supply of both industries are highly cross-linked and critical for a seamless supply chain. Hence, the Gross Value Added (GVA), breakup of GVA into major manufacturing sectors, and growth of manufacturing industry over the review period have been analysed and presented, in this industry trend.
- Wholesale and Retail Trade (Offline) - This end user industry segment captures the external (outsourced) logistics expenditure incurred by the wholesalers and retailers, through offline sales channel, on Courier, Express, and Parcel (CEP) services. The end user players considered are the establishments primarily engaged in wholesaling or retailing merchandise, generally without transformation, and rendering services incidental to the sale of merchandise. Logistics Service Providers (LSPs) plays a crucial role in the reliable movement of supplies to and finished products from production houses to the distributors and finally to the end customer covering activites like material sourcing, transportation, order fulfillment, warehousing & storage, demand forecasting, inventory management etc.
| Keyword | Definition |
|---|---|
| Axle Load | The axle load refers to the total load (weight) bearing on the roadway through wheels connected to a given axle. Across the globe, there are systems in place to ensure axle load monitoring, wherein surpassing the defined limits set by the concerned regulatory authority can lead to penalty/fine. For transportation of goods via road this can be an important determinant of costs as knowledge about the axle load limits can be used to (i) load the vehicle optimally for maximizing profits (ii) avoid exceeding the same and hence the probable fines associated (iii) avoid wear and tear of the vehicle (iv) avoid damage to pavement resulting in noticeable public maintenance and repair costs (v) achieve better turnaround time. |
| Back Haul | Backhaul is the return movement of a transport vehicle from its original destination to its original point of departure, and can include full, partial, or empty truck loads (all or part of the way) depending on the visibility of the local freight ecosystem. In this regard, transportation of empty containers to the point of origin, known as deadheading is also a significant factor, considering the supply/container shortages across the geographies, resulting in cost escalation and under optimized profit potential attainment. Generally, the carriers offer discounts on the backhaul, to secure freight for the trip. |
| Bill of Lading (BOL) | A bill of lading is a legal contract document issued by a carrier to a shipper to acknowledge reception of their cargo, and is evidence for the contract of carriage between the two parties. Broadly it details the (i) type, quantity, and other specifications of the goods being carried (ii) destination, and terms & conditions of the shipment (iii) carrier and drivers with all the necessary information to process the shipment, which can be used for insurance and customs clearance purposes (iv) assurance that the consignment is damage-free and ready to be shipped to the consignee. In this regard, a house bill of lading (HBL) is a document issued by a freight forwarder or a non-vessel operating common carrier (NVOCC) to acknowledge receipt of items for shipment (to a shipper). If shipments from several shippers are involved a master bill of lading (MBL) might be involved which is a consolidated version of the same for all the shipments being taken care of by the carrier (to a common destination) and might be issued by the carrier to the freight forwarder or the shipper (depending on who books the transport). |
| Bunkering | Bunkering is the process of supplying fuel to power the propulsion system of a ship. It includes the logistics of loading and distributing the fuel among available shipboard tanks. In this regard, (i) Bunker fuel is technically any type of fuel oil used aboard ships. It gets its name from the containers on ships and in ports that it is stored in; in the days of steam they were coal bunkers but now they are bunker-fuel tanks, (ii) Bunker refers to the spaces (Tank) on board a vessel to store fuel, (iii) Bunker trader refers to a person dealing in trade of bunker (fuel), (iv) Bunker call is made when a cargo ship anchors or berths in a port to take on bunker oil or supplies, (v) Bunkering service is the supply of a requested quality and quantity of bunkers to a ship. Bunkering is signficant from point of view of freight rates applicable to the shipper as Bunker Contribution (BUC)/ Fuel Adjustment Factor (FAF)/ Bunker Adjustment Factor (BAF) are applied by shipping lines to offset the effect of fluctuations in the cost of bunkers. |
| Cabotage | Transport by a vehicle registered in a country, performed on the national territory of another country. Cabotage law may restrict domestic cargo traffic to be carried in its own nationally registered, and sometimes built and crewed vehicles, though regulations vary across industries/commodity groups/countries and sometimes specify maximum allowable percentage of cabotage that can be serviced by foreign registered fleet. |
| C-commerce | Collaborative commerce (also known as C-commerce), (i) describes electronically enabled business interactions among an enterprise’s internal personnel, business partners and customers throughout a trading community (industry, industry segment, supply chain or supply chain segment); (ii) is the optimization of supply and distribution channels to capitalize on the global economy by using new technology efficiently. Advantages of C-commerce, to detail few include (i) maximization of organization's efficiency and profitability (ii) technology integration with physical channels to allow companies to work together (iii) increased information exchange such as inventory and product specifications, using the web as an intermediary (iv) increased competitiveness by reaching a broader audience. Examples of C-commerce, also known as peer-to-peer commerce, include (i) companies that allow consumers to rent things from each other, or marketplaces, such as Meta (formerly Facebook) Marketplace, that allow the sale of used goods; (ii) DoorDash teamed up with many national brands, such as McDonald’s and Chipotle, to offer fast food delivery, building their business model on c-commerce. They have since expanded their delivery service from restaurants to retailers and even offer 'fleets' of drivers to businesses. |
| Courier | A business/company that delivers packages/parcels/shipments (upto 70 kgs) including quick door to door pickup and delivery service for goods or documents, domestically or internationally, on a commercial contract basis. Example, DHL Group, FedEx, United Parcel Service of America, Inc., USPS, International Distributions Services, J&T Express, SF Express among several others |
| Cross docking | Cross docking is a practice in logistics management that includes unloading incoming delivery vehicles and loading the materials directly into outbound delivery vehicles, omitting traditional warehouse logistical practices and saving time and money. It requires close synchronization of both inbound and outbound movements. It is highly significant in reduction of costs pertaining to warehousing & storage (and the associated Value Added Services). |
| Cross Trade | International transport between two different countries performed by a vehicle registered in a third country. A third country is a country other than the country of loading/embarkation and the country of unloading/disembarkation. Cross Trade law may restrict international cargo traffic to be carried by respective country's registered vehicles, and sometimes built and crewed vehicles, though regulations vary across industries/commodity groups/countries and sometimes specify maximum allowable percentage of cross trade that can be serviced by foreign registered fleet. |
| Customs Clearance | The process of declaring and clearing cargoes through customs. It includes the procedures involved in getting cargo released by Customs through designated formalities such as presenting import license/permit, payment of import duties and other required documentations by the nature of the cargo. In this regard, a customs broker is a person or company licensed by the respective department of the country to act on behalf of freight importers and exporters. |
| Dangerous Goods | Dangerous goods (or hazardous materials or HAZMAT) include flammable liquids/solids, gases (compressed, liquified, dissolved under pressure), corrosives, oxidising substances, explosive substances and articles, substances which on contact with water emit flammable gasses, organic peroxides, toxic substances, infectious substances, radioactive materials, miscellaneous dangerous goods and articles. |
| First mile Delivery | First mile delivery refers to the (i) first stage of the freight/shipment/cargo/courier transportation (ii) the transportation of goods from a merchant’s premises or warehouse to the next fulfillment centre/warehouse/hub from where the goods are forwarded (iii) shipping goods from local distribution centers to stores (For retailers) (iv) transportation of finished goods from a plant or a factory to a distribution center (For manufacturers), (v) pick up of goods from the end-customer’s home or store followed by movement to a warehouse or storage location (movers and packers), (vi) process where goods are picked up from a retailer and then transferred to third-party logistics providers or courier service providers to be delivered to the end-consumer (e-commerce). Once the package reaches the next warehouse or the courier’s hub, it is then sorted and transported further until it reaches the customer’s doorstep. Example, if one chooses UPS as a courier, first-mile delivery will be the product being delivered from manufacturer's/retailer's warehouse to the UPS’s warehouse/ fulfilment centre. |
| Last Mile Delivery | Last mile delivery refers to the very last step of the delivery process when a parcel is moved from a transportation hub (warehouse or a distribution center or fulfillment centre) to its final destination, which usually is a personal residence/retail store/ business, or parcel locker. It accounts for around half of the total cost involved in entire process of first mile, middle mile, and last mile delivery, though it can vary shipment to shipment, based on commodity, business model and similar factors. |
| Milkrun | A Milk Run is a delivery method used to transport mixed loads from various suppliers to one customer, using lean management principles applied to logistics. Instead of each supplier sending a truck every week to meet the needs of one customer, one truck (or vehicle) visits the suppliers to pick up the loads for that customer. This method of transport got its name from the dairy industry practice, where one tanker used to collect milk from several dairy farms for delivery to a milk processing company. A milk run can be a more efficient way to handle logistics but require proper planning. If the route involves products from different companies, there is need for an agreement about cost-sharing and other aspects of the cooperative delivery arrangement. Once the group settles these issues, this delivery method can save time and money for everyone by pooling operation costs and resources. |
| Multi country consolidation | Multi-Country Consolidation (MCC) is a cost-effective solution that consolidates one's cargo from different countries of origin to build Full Container Loads (FCL). MCC is most suitable for companies that import light volumes of goods from multiple countries but want to take advantage of the more economic FCL freight rates. Apart from costing some of the other advantages include (i) flexibility to choose suppliers from a wider range of origin countries without worrying about the logistics to final destination from each origin, (ii) ability to pick the most suitable suppliers from many different countries for one's business operations. The increase in one's sourcing options by MCC provides the kind of flexibility needed in competitive global markets. |
| Q-commerce | Q-commerce, also referred to as quick commerce, is a type of e-commerce where emphasis is on quick deliveries, typically in less than an hour. The companies providing Q-Commerce services might have vertically intergrated model or might be using third party delivery platforms (outsourced logistics). It has advantages like (i) competitve USP, (ii) potential to earn greater profit margins, (iii) better customer experience, (iv) guaranteed availability of products, (v) traceability, and (vi) scaleability. |
| ReverseLogistics | Reverse logistics is a type of supply chain management that moves goods from customers back to the sellers or manufacturers and may involve ciruclar economy principles (3Rs) viz. recycling, reuse (repurposing, reselling), reducing or repairing. In this regard, reverse commerce (or Recommerce) is the selling of previously owned items through physical or online marketplaces/distribution channels to buyers who reuse, recycle or resell them. |
Need More Details on Market Definition?
Ask a Question
Research Methodology
Mordor Intelligence follows a four-step methodology in all our reports.
- Step-1: Identify Key Variables: In order to build a robust forecasting methodology, the variables and factors identified in Step-1 are tested against available historical market numbers. Through an iterative process, the variables required for market forecast are set and the model is built on the basis of these variables.
- Step-2: Build a Market Model: Market-size estimations for the forecast years are in nominal terms. Inflation is considered to be a part of the pricing, and the average selling price (ASP) is varying throughout the forecast period for each country
- Step-3: Validate and Finalize: In this important step, all market numbers, variables and analyst calls are validated through an extensive network of primary research experts from the market studied. The respondents are selected across levels and functions to generate a holistic picture of the market studied.
- Step-4: Research Outputs: Syndicated Reports, Custom Consulting Assignments, Databases & Subscription Platforms

Get More Details On Research Methodology
Download PDF


