
Market Overview
| Study Period | 2021 - 2031 |
|---|---|
| Forecast Data Period | 2026 - 2031 |
| Historical Data Period | 2021 - 2024 |
| Market Size (2026) | USD 16.17 Billion |
| Market Size (2031) | USD 20.56 Billion |
| Growth Rate (2026 - 2031) | 4.92 % |
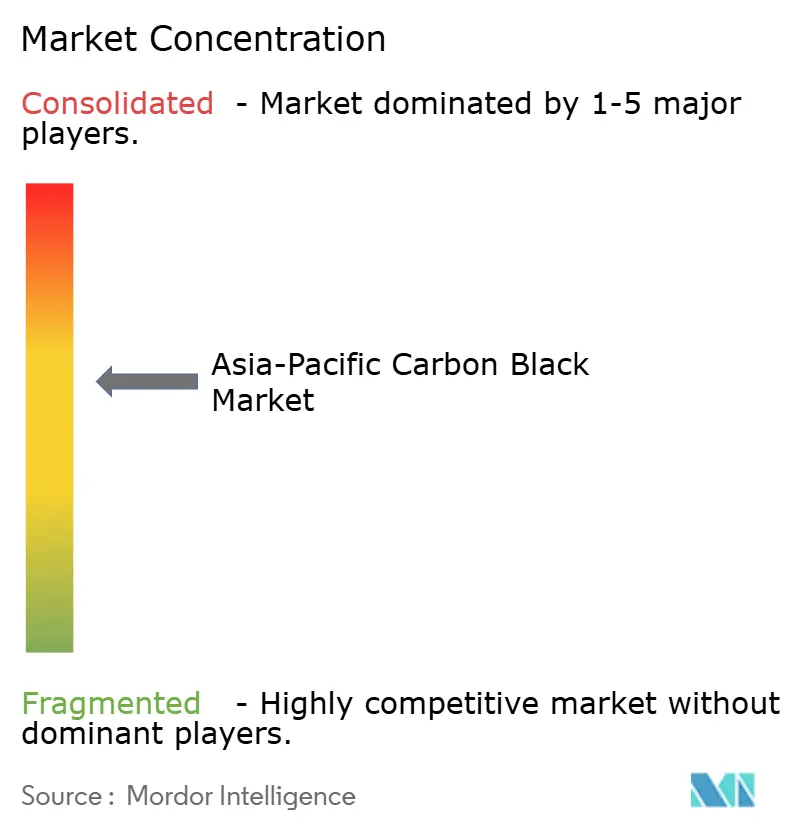
| Market Concentration | Medium |
Major Players *Disclaimer: Major Players sorted in no particular order Image © Mordor Intelligence. Reuse requires attribution under CC BY 4.0. | |
Asia-Pacific Carbon Black Market Analysis by Mordor Intelligence
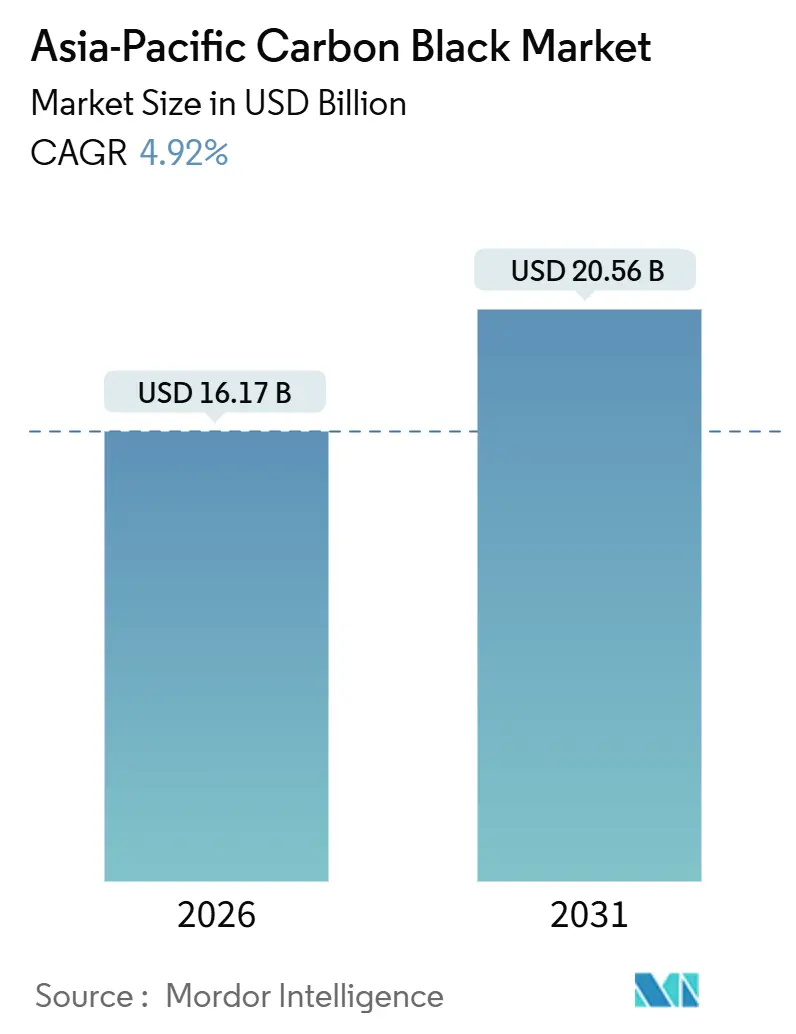
The Asia-Pacific Carbon Black Market size is estimated at USD 16.17 billion in 2026, and is expected to reach USD 20.56 billion by 2031, at a CAGR of 4.92% during the forecast period (2026-2031). The region’s shift from high-volume commodity grades toward specialty blacks that serve electric-vehicle battery casings and high-performance tires is reinforcing margin expansion, while China’s energy-efficiency mandates are accelerating plant modernization and capacity consolidation. Integrated producers with captive feedstock pipelines are cushioning earnings against crude-linked tar price volatility, whereas mid-tier firms are differentiating through recovered-carbon-black and acetylene-black innovations. Demand tailwinds stem from India’s fast-growing two-wheeler and commercial-vehicle tire replacement cycle, expanding regional digital printing output, and stricter battery safety standards that require conductive blacks. Conversely, silica substitution in green tread compounds and tightening sulfur-oxide limits on furnace-black plants weigh on growth, although these restraints are offset by the region’s resilient vehicle-miles-traveled trajectory and policy support for circular-carbon initiatives.
Key Report Takeaways
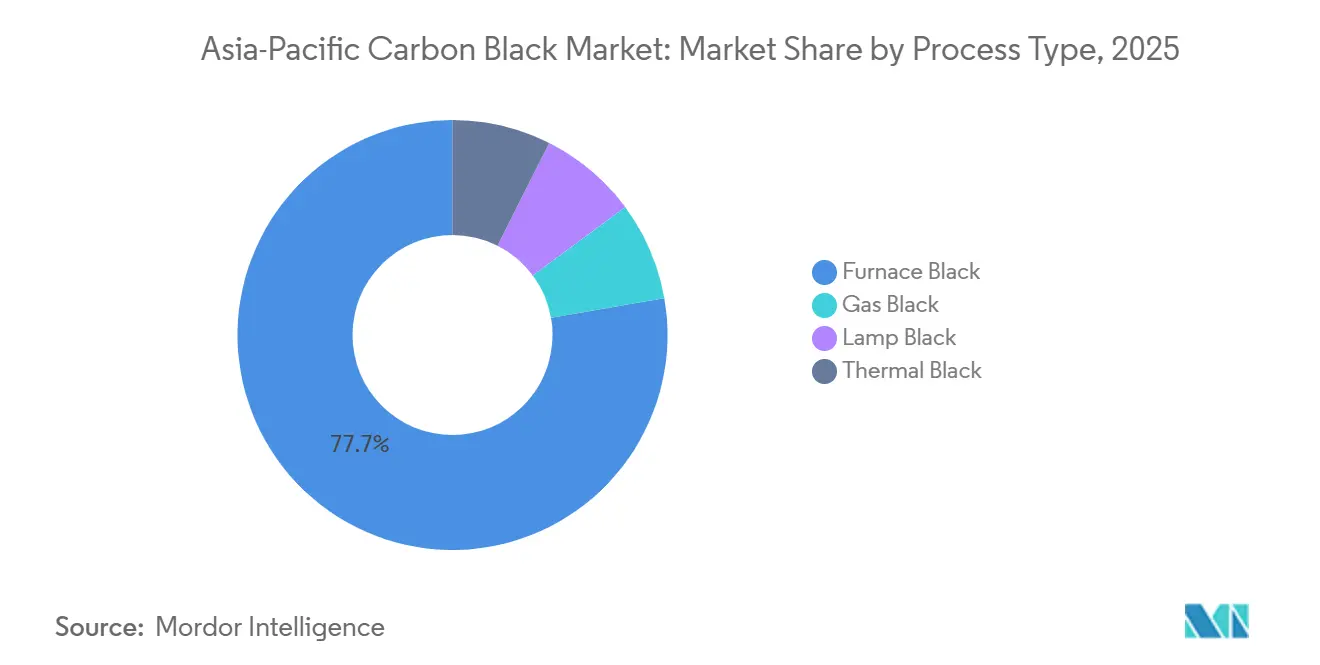
- By process type, Furnace Black held 77.74% of the Asia-Pacific carbon black market share in 2025, whereas Lamp Black is projected to grow at a 5.21% CAGR through 2031.
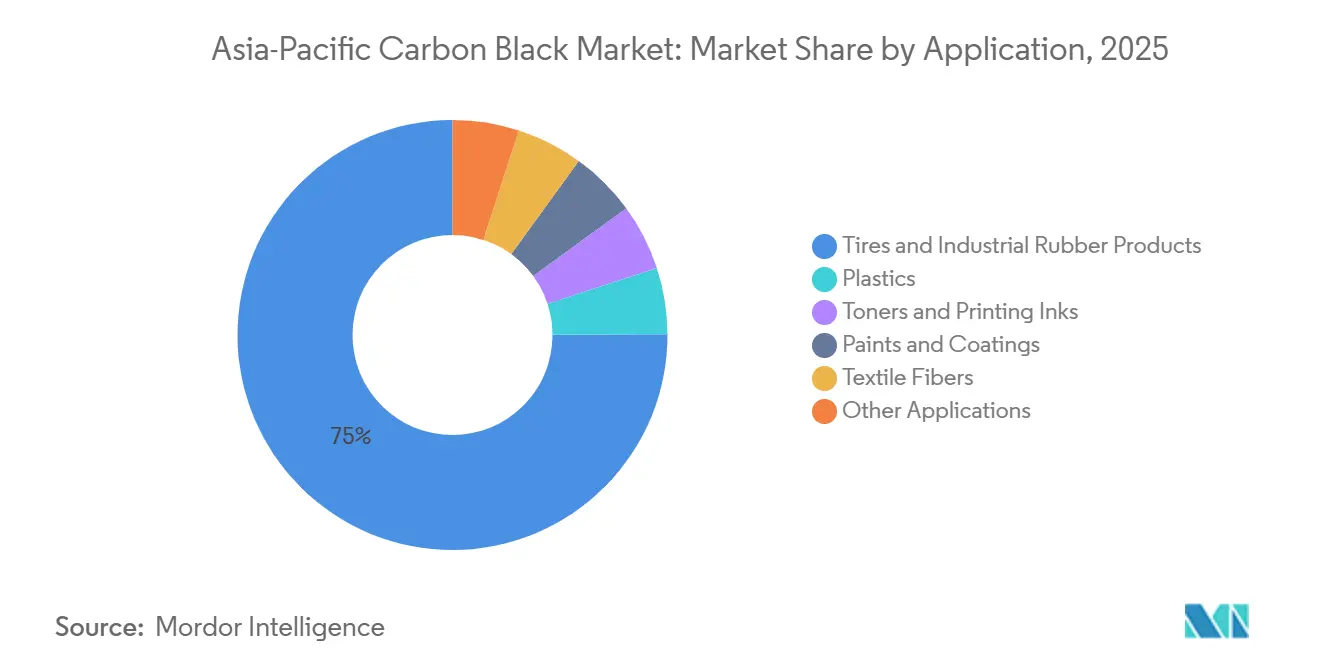
- By application, Tires and Industrial Rubber accounted for 74.89% of the Asia-Pacific carbon black market size in 2025, while Toners and Printing Inks are advancing at a 6.26% CAGR through 2031.
- By geography, China dominated with a 54.18% share in 2025; India is forecast to expand at a 5.10% CAGR to 2031.
Note: Market size and forecast figures in this report are generated using Mordor Intelligence’s proprietary estimation framework, updated with the latest available data and insights as of January 2026.
Market Trends and Insights
Drivers Impact Analysis of Asia-Pacific Carbon Black Market*
| Drivers | (~) % Impact on CAGR Forecast | Geographic Relevance | Impact Timeline |
|---|---|---|---|
| Rising tire-replacement demand across China and India | +1.2% | China, India, ASEAN core | Medium term (2-4 years) |
| Specialty black uptake in high-performance EV tires | +0.9% | China, Japan, South Korea | Medium term (2-4 years) |
| Regulations phasing out low-grade wet-granulation units | +0.7% | China, spillover to ASEAN | Short term (≤ 2 years) |
| Recovered carbon black mandates in Japan and South Korea | +0.5% | Japan, South Korea | Long term (≥ 4 years) |
| OEM shift to conductive blacks for Li-ion battery casings | +0.8% | China, Japan, South Korea, India | Medium term (2-4 years) |
| Source: Mordor Intelligence | |||
Rising Tire-Replacement Demand Across China and India
China and India together consume over 60% of regional tires, yet their replacement cycles differ. China’s mature passenger-car fleet generates steady aftermarket pull for high-abrasion grades, while India’s expanding commercial-vehicle and two-wheeler base underpins faster incremental volume. CRISIL projects India’s tire-replacement demand to rise 7-8% in fiscal 2026, supported by infrastructure spending and higher freight tonnage. The International Monetary Fund expects Asia-Pacific GDP to grow 4.6% in 2025, adding road-travel demand and tire wear. Phillips Carbon Black Limited is enlarging its Mundra facility to capture this growth and coastal export opportunities, evidencing producer confidence in sustained aftermarket momentum.
Specialty Black Uptake in High-Performance EV Tires
Electric vehicles need tires that balance low rolling resistance with greater load-bearing capacity. Cabot’s 2024 PROPEL E8 grade lowers hysteresis by 15% relative to traditional N200 series blacks, enabling tire makers to reduce silica content without compromising wet traction. Goodyear’s supply agreement with Monolith Materials, also announced in 2024, sources methane-pyrolysis carbon black that cuts production emissions by 90%, aligning with OEM Scope 3 carbon accounting. Tokai Carbon reported JPY 37.4 billion in segment sales during Q3 2024 and is co-developing a recovered-carbon-black line with Bridgestone, showing that specialty grades lift average selling prices by 20-30% even though they represent less than 5% of volume.
Regulations Phasing Out Low-Grade Wet-Granulation Units
China’s GB 29449-2024 caps energy use in carbon-black production at 3,200 kWh per tonne, a threshold older wet-granulation lines exceed by 20-30%. The 2024 pollutant-discharge permit system layers real-time monitoring for sulfur dioxide and particulates, driving compliance costs higher[1]. Longxing Chemical reported RMB 2.89 billion revenue in the first half of 2024 and credited margin gains to the closure of 12 competing lines in Shandong, illustrating how regulation is lifting the Herfindahl index. As the top five Chinese producers now hold 65% of domestic capacity, energy standards are hastening consolidation that favors scale players with dry-pellet technology.
Recovered Carbon Black Mandates in Japan and South Korea
Japan’s Ministry of Economy, Trade and Industry targets 10-15% substitution of virgin carbon black with recovered grades by 2030[2]. Bridgestone and Tokai Carbon formed a joint venture in 2024 to build a 5,000-tonne-per-year facility, scheduled for fiscal 2032. South Korea’s 2024 Framework Act on Resources Circulation imposes extended producer responsibility on tire makers, spurring investments such as Marubeni’s USD 15 million stake in LD Carbon to boost output to 10,000 tonnes by 2027. Although pyrolysis material carries higher ash and broader particle-size distribution, its 30-40% lower carbon intensity supports adoption in medium-performance applications.
Restraints Impact Analysis of Asia-Pacific Carbon Black Market*
| Restraints | (~) % Impact on CAGR Forecast | Geographic Relevance | Impact Timeline |
|---|---|---|---|
| Volatile crude-derived feedstock prices | -0.8% | Global, import-dependent ASEAN | Short term (≤ 2 years) |
| Growing silica substitution in green tread compounds | -0.6% | China, Japan, South Korea, India | Medium term (2-4 years) |
| Stricter SOx/NOx emission caps on furnace black plants | -0.5% | China, spillover to India and ASEAN | Short term (≤ 2 years) |
| Source: Mordor Intelligence | |||
Volatile Crude-Derived Feedstock Prices
Carbon black relies on fluid catalytic-cracking tar and coal-tar pitch whose prices track Brent benchmarks with a 2-3-month lag. The World Bank projects Brent at USD 64 per barrel in 2025 and USD 60 in 2026. A USD 10 swing moves feedstock costs 8-10%, compressing producer margins by up to 300 basis points when pass-through lags OEM contracts. Himadri Specialty Chemical disclosed that coal-tar-pitch volatility shaved 150 basis points off gross margin in Q2 2024. ASEAN producers that import 70-80% of tar feedstock saw landed costs surge 12% in H1 2024 due to freight spikes and currency depreciation, underlining how crude swings destabilize smaller, non-integrated players.
Growing Silica Substitution in Green Tread Compounds
Silica paired with silane agents reduces tire rolling resistance by up to 35%, improving fuel economy and meeting fleet-average standards. Evonik’s ULTRASIL system demonstrated 8% fuel-saving gains in testing, prompting passenger-car tire makers to adopt 30-50% blends. Tokai Carbon’s 2024 annual report estimated a 15,000-20,000-tonne demand loss in Japan from silica substitution. Biosilica from rice-husk ash, validated in a 2024 Journal of Applied Polymer Science study, is widening supply and pushing prices down. Carbon-black producers are developing hybrid blacks grafted with silica, but these niche grades have not stemmed share erosion in passenger tires, which represent the bulk of demand.
*Our forecasts treat driver/restraint impacts as directional, not additive. The impact forecasts reflect baseline growth, mix effects, and variable interactions.
Asia-Pacific Carbon Black Market Segment Analysis
By Process Type:
Furnace Black Retains Volume LeadershipFurnace Black accounted for 77.74% of Asia-Pacific carbon black market share in 2025 and continues to anchor bulk demand among tire and industrial-rubber users. Lamp Black, though smaller in tonnage, is forecast to expand at 5.21% CAGR through 2031 as ink and coating formulators value its ultra-fine particle size and lower polycyclic-aromatic content. Thermal and Gas Blacks, together below 5% of volume, serve high-purity plastics and conductive coatings where large or ultra-fine particles are critical.
Major producers are investing in oxidation and encapsulation to widen the performance envelope of furnace grades, yet the capital cost limits widespread adoption. China’s GB 29449-2024 energy cap is accelerating the retirement of inefficient wet-granulation lines, which consumed 20-30% more power, thereby shifting volume to integrated firms with dry-pellet technology. Birla Carbon’s 2024 Raven 1185 Ultra launch shows how Lamp Black can secure premium niches in digital printing. Meanwhile, Orion’s PRINTEX 3 gas black dominates magnetic toner applications, demonstrating specialty demand resilience despite its small share.

By Application:
Tires Dominate, Toners AccelerateTires and Industrial Rubber consumed 74.89% of regional carbon black in 2025, supported by a replacement cycle that is still expanding in India and by high-abrasion requirements for Chinese truck retreads. Toners and Printing Inks are the fastest-growing segment at 6.26% CAGR to 2031, propelled by rising digital press installations across packaging and commercial print shops. Plastics secure 8-10% of volume in conductive fuel lines and electrostatic-dissipative parts for electric vehicles, while Paints and Coatings absorb specialty blacks for automotive basecoats and low-VOC architectural finishes. Textile fibers remain a small but stable outlet.
DIC’s iron-treated carbon black patent delivers 30% higher magnetic saturation, illustrating how formulation advances unlock speed gains in copiers. Cabot’s PROPEL E8 demonstrates that application-specific reinforcement can offset silica encroachment by cutting hysteresis without sacrificing wet grip. Plastics users in ASEAN are adopting conductive blacks to meet ISO 23907 electrostatic standards for fuel systems that took effect in 2024. Surface-treated lamp blacks that disperse in waterborne paints align with China’s 2024 volatile-organic-compound limits, sustaining specialty demand growth despite a commodity-heavy base.
Geography Analysis
China Carbon Black Market
China consumed 54.18% of regional carbon black in 2025, anchored by the world’s largest tire manufacturing hub and a mature replacement cycle that pulls over 1.2 million tons annually. The Asia-Pacific carbon black market size for China is consolidating as GB 29449-2024 and pollutant-discharge permits force sub-scale plants to shut or modernize, pushing the top five players’ combined share to 65%. Integrated coal-chemical groups supply aromatic feedstock at transfer prices below spot, reinforcing cost leadership.
India Carbon Black Market
India is set to post the region’s fastest growth at 5.10% CAGR through 2031, underpinned by commercial-vehicle and two-wheeler tire demand where carbon-black intensity per unit exceeds passenger cars. Phillips Carbon Black Limited’s Mundra expansion will add 50,000 tons by 2027, positioning the firm to serve both domestic OEMs and Middle-Eastern exports. The Asia-Pacific carbon black market benefits from India’s coastal logistics that lower freight costs and shorten shipping times to Gulf customers.
APAC Carbon Black Market
Japan’s market is flat as shrinking passenger-car output and silica substitution erode volume, yet the country remains a technology leader in recovered and acetylene blacks that command 20-30% premiums. South Korea’s Framework Act on Resources Circulation is expected to divert 5,000-8,000 tons of virgin demand toward pyrolysis-derived substitutes by 2028. ASEAN economies - Indonesia, Thailand, Vietnam, and Malaysia - are witnessing rising demand for carbon black, with Indonesia’s tire industry absorbing up to 100,000 tons of imports each year. The Rest of Asia-Pacific, including Australia and Taiwan, represents specialty niches reliant on imports from Japan and South Korea.
Regulatory Landscape
China is tightening measurement and operating-compliance requirements for carbon black producers, which is reinforcing consolidation around modern, energy-efficient assets. GB/T 9580-2025 (identification method of standard reference carbon black) takes effect on February 1, 2026, setting a clearer benchmark for quality and testing consistency, while industry rules such as T/CRIA 20005-2025 (pollutant emission automatic monitoring marking rules), effective August 1, 2025, expand operational oversight through monitored emissions and standardized identification.
Alongside national measures, 2026 provincial energy-saving guidance drafts for carbon black enterprises (for example, DB13/T-2026) introduce structured requirements for energy-efficiency management, monitoring, and equipment-level metering. This raises the bar for legacy wet-granulation lines and other higher-energy operations. In India, waste and environmental compliance requirements under the Hazardous and Other Wastes (Management and Transboundary Movement) Rules, 2016, along with CPCB-linked operating procedures, shape recovered carbon black pathways, including pilot-based permissions for used tyre scrap imports tied to strict environmental controls and end-product handling.
Value Chain Analysis
The value chain starts with hydrocarbon feedstocks (including petroleum-derived streams such as FCC tar and coal-tar distillates) and utilities (steam and power), then moves through furnace black and specialty black production, pelletizing or post-treatment, quality control, and bulk logistics to tire and rubber manufacturers, plastics compounders, and ink and toner formulators. In Asia-Pacific, vertical integration into distillation and feedstock upgrading is still a key differentiator, as it helps producers manage tar quality variability and cost swings, while export-oriented players rely on proximity to ports and regional hubs to shorten lead times and maintain service levels.
Downstream, demand concentration in tires and industrial rubber keeps large buyers influential on specifications, contract terms, and pass-through timing. Specialty applications such as conductive blacks for batteries, inks, and high-dispersion grades reward producers that invest in post-treatment and formulation support. Circular and recovered-carbon approaches are shifting from pilot and niche volumes toward more integrated supply chains, illustrated by Cabot validating circular reinforcing carbon production capabilities in February 2026 at Cilegon (Indonesia) and Tianjin (China) using its EVOLVE Sustainable Solutions platform, which also pulls new upstream inputs such as tire pyrolysis oil into reinforcing-carbon supply.
Competitive Landscape
The Asia-Pacific carbon black market is moderately consolidated. Vertical integration provides feedstock security and shields margins from tar volatility, as seen in Birla Carbon’s captive distillation units and Jiangxi Black Cat’s coal-chemical parent. Specialty-grade innovation is the main competitive lever; Orion’s acetylene-black expansion in South Korea targets fast-growing battery-casing demand, while Cabot’s PROPEL E8 responds to EV tire specifications. White-space opportunities lie in recovered-carbon-black and bio-based feedstocks. Technology gaps are widening: leaders deploy machine-learning controls to fine-tune particle-size distributions, whereas laggards run legacy batch systems with 10-15% higher energy use. Regulatory tightening will force sub-100,000-tonne producers, especially in ASEAN, to either modernize or exit by 2028, further lifting regional concentration.
Asia-Pacific Carbon Black Industry Leaders
-
Birla Carbon
-
Jiangxi Black Cat Carbon Black Co., Ltd.
-
Cabot Corporation
-
Orion Engineered Carbons
-
Tokai Carbon Co. Ltd.
- *Disclaimer: Major Players sorted in no particular order
Asia-Pacific Carbon Black Market Companies Covered in this Report
- Birla Carbon
- Bridgestone Corporation
- Cabot Corporation
- Cancarb Limited
- Continental Carbon Company
- Denka Company Limited.
- Epsilon Carbon Private Limited
- Himadri Specialty Chemical Ltd.
- Jiangxi Black Cat Carbon Black Co., Ltd.
- Jinghai Carbon Black
- JINNENG Chemical (Qingdao) Co., Ltd
- Longxing Chemical Stock Co. Ltd
- Mitsubishi Chemical Group Corporation
- OCI COMPANY Ltd.
- Omsk Carbon Group
- Orion Engineered Carbons
- Phillips Carbon Black Limited (PCBL)
- Shandong Huadong Rubber Materials Co., Ltd.
- Tokai Carbon Co. Ltd.
Market Opportunities and Future Outlook
Capacity additions for specialty carbon black and post-treatment investments in India create whitespace in higher-margin grades for plastics, inks, coatings, and EV-adjacent requirements, reducing reliance on commodity tire reinforcement alone. This pivot is supported by Himadri Speciality Chemical starting commercial operations of a 70,000 TPA specialty carbon black line at Mahistikry (West Bengal) in April 2026, and by PCBL commissioning a 20,000 MTPA specialty line at Mundra (Gujarat) in June 2026. Together, these projects expand local availability of differentiated grades and support quicker qualification cycles for domestic converters and OEM-linked supply chains.
Circular reinforcing carbons and recovered carbon black integration offer another opportunity tied to policy and customer procurement needs, particularly as traceability and mass-balance schemes are being adopted. In 2026, Orion announced circular carbon black production at its ISCC PLUS-certified Qingdao plant using tire pyrolysis oil (ECORAX Circular grades), while Cabot validated circular reinforcing carbon production capabilities at Cilegon and Tianjin, indicating that circular feedstock sourcing, certification, and consistent product performance are becoming commercial differentiators. Southeast Asia also provides a supply-chain and localization opening for integrated build-outs that combine carbon black with tar processing, highlighted by the March 2026 start of construction for a large carbon black and tar processing project at Tsingshan Industrial Park, Indonesia.
Recent Industry Developments in Asia-Pacific Carbon Black Market
- June 2026: Orion S.A. announced production of circular carbon black at its ISCC PLUS-certified plant in Qingdao, China, using tire pyrolysis oil feedstock and offering ECORAX Circular 200, 210, and 215 grades. The company’s move advances circular reinforcing carbons in a major Asia-Pacific manufacturing hub and increases competitive pressure on suppliers that lack certified circular inputs for tire and rubber customers.
- February 2025: Birla Carbon held a ground-breaking ceremony for its greenfield carbon black facility in Rayong, Thailand, supporting its Southeast Asia expansion program. A Thailand-based site adds regional supply optionality for tire and industrial customers and can reduce exposure to cross-border logistics constraints for ASEAN demand.
- October 2024: Birla Carbon launched its first Asia Post Treatment (APT) plant at its Patalganga unit in Maharashtra, India, to serve demand for higher-performance carbon black grades. Adding post-treatment capability improves product consistency and dispersion characteristics, helping producers target specialty applications and premium tire compounds beyond standard reinforcing grades.
Asia-Pacific Carbon Black Market Report Scope and Research Methodology
Market Definition and Coverage
This market is defined as revenues earned from selling carbon black in Asia-Pacific, counted at the point of first sale by producers or authorized channels, and reported in USD for industrial and commercial consumption.
Scope exclusions: Excludes downstream rubber goods, tires, plastics, inks, and coatings revenues where carbon black is only an input.
Segments Covered in This Report
- By Process Type
- Furnace Black
- Gas Black
- Lamp Black
- Thermal Black
- By Application
- Tires and Industrial Rubber Products
- Plastics
- Toners and Printing Inks
- Paints and Coatings
- Textile Fibers
- Other Applications
- By Geography
- China
- India
- Japan
- South Korea
- ASEAN Countries
- Rest of Asia-Pacific
Data Sources, Market Sizing, and Validation
Desk Research
Desk work was used to build the starting structure for the model and to set realistic ranges for demand and pricing in the Asia-Pacific region. Public sources such as UN Comtrade trade statistics, national statistical offices in major producing and consuming countries, and energy and feedstock references such as the International Energy Agency for oil and refinery-linked indicators were reviewed.
To ground end-use demand, inputs were also taken from automotive production releases (for tire-linked consumption), customs and port updates, peer-reviewed polymer and materials journals, and industry association publications that cover rubber, plastics, inks, and coatings. Company annual reports, investor presentations, and credible press were used to cross-check capacity expansions, utilization commentary, and mix shifts. We also used paid subscriptions for company financials and patent databases when they helped clarify product positioning. The sources named here are illustrative only, and many other public and paid references were also used to collect data, validate assumptions, and clarify open questions.
Primary Interviews and Surveys
Primary discussions were used to convert desk signals into a practical market model, especially where published data is not reported consistently by country. We spoke with producers, distributors, and large buyers across tires and industrial rubber, plastics, and inks, and we kept coverage across major Asia-Pacific demand centers so run rates, pricing, and grade mix assumptions could be checked and tightened.
Distribution of primary research fieldwork respondents
| Company type | Respondent position |
|---|---|
| Top tier: 25% | CXOs: 16% |
| Mid tier: 59% | Functional/Unit leaders: 28% |
| Smaller Players: 16% | Managers: 56% |
Market-Sizing & Forecasting
Sizing was built using a top-down and bottom-up mix. We reconstructed production and trade signals for Asia-Pacific, then translated them into value using blended price assumptions by grade and application. To keep totals realistic, we corroborated them with selective bottom-up approximations such as sampled supplier revenues, channel checks on typical contract pricing, and volume-to-value conversions for key end uses.
Inputs treated as key fingerprints included tire production trends (as the largest pull-through), industrial rubber and plastic compounding activity, regional import and export flows of carbon black, announced capacity additions and ramp-up timelines, and typical feedstock-linked price movement patterns. Forecasting relied on scenario analysis shaped by expert views on tire demand, regional manufacturing output, and the pace of specialty grade adoption, and the scenario paths were blended into a single base case. Where bottom-up data was missing for smaller countries, proxy ratios were applied using trade and production intensity, followed by a second pass with interview feedback to avoid overstating demand.
Data Validation & Update Cycle
Outputs were checked through multiple steps so the final numbers stay consistent with real-world signals. We compared modeled consumption and pricing against independent indicators such as trade balances, utilization commentary, and downstream production trends, and then investigated large variances before sign-off.
If unusual moves were seen, such as a sudden shift in imports, a sharp feedstock swing, or a capacity shutdown, the relevant assumptions were revisited and experts were re-contacted for confirmation. Reports refresh annually, with interim updates when material events change supply, demand, or pricing, and a final pre-delivery review is completed so clients receive the most current view.
Mordor Intelligence's Asia Pacific Carbon Black Market Sizing Compared With Other Published Estimates
Published market sizes for Asia-Pacific carbon black do not always line up, because studies often use different years, different country coverage, and different methods for translating volume into USD value. Gaps also come from how each source treats pricing, especially when contract prices, spot prices, and currency timing are blended differently.
Downstream tire and rubber product revenues sit outside Mordor Intelligence's scope, and that tends to widen the spread versus estimates that partially mix carbon black with finished-goods value. Differences can also show up when some sources do not reconcile totals against visible checks such as trade flows and capacity utilization, or when they apply a single price curve across grades despite mix changes in tires, plastics, and inks.
Benchmark comparison
| Source | Market Size | Gaps in Research Methodology |
|---|---|---|
| Mordor Intelligence | USD 16.17 B (2026) | |
| Industry Publisher A | USD 8.06 B (2024) | Uses an earlier base year and a narrower country list on the page, and the value build appears to rely on a single revenue baseline with limited reconciliation to trade flows and capacity run rates. |
| Regional Consultancy B | USD 5.14 B (2024) | Reports a smaller 2024 total that can occur when specialty grades and non-tire applications are under-counted, and when USD conversion timing and pricing assumptions are applied conservatively across countries. |
Taken together, the spread is mainly explained by year alignment and what gets counted as market value, followed by how prices are blended across grades and countries. When scope and pricing are made explicit, and the totals are cross-checked against demand and supply signals that can be independently tracked, the outcome is easier to reproduce and defend in planning discussions.
Key Questions Answered in the Report
How large is the Asia-Pacific carbon black market in 2026?
The Asia-Pacific carbon black market size reached USD 16.17 billion in 2026 and is forecast to rise to USD 20.56 billion by 2031.
Which process segment leads regional volume?
Furnace Black dominates with a 77.74% share in 2025, reflecting its cost advantage and suitability for tire reinforcement.
What is the fastest-growing application through 2031?
Toners and Printing Inks are expanding at a 6.26% CAGR as digital printing scales across packaging and commercial print.
Why is India outpacing China in growth?
India’s commercial-vehicle and two-wheeler replacement cycles are earlier in maturity, delivering a 5.10% CAGR versus China’s mature market.
How are regulations impacting smaller producers?
Energy-efficiency and emission caps in China and circular-carbon mandates in Japan and South Korea are raising compliance costs, pressuring sub-scale plants to modernize or exit.
What opportunity does recovered carbon black provide?
Policy targets in Japan and South Korea aim for 10-15% substitution by 2030, opening premium niches for producers that master pyrolysis material processing.