Market Overview
| Study Period | 2019 - 2030 |
|---|---|
| Base Year For Estimation | 2024 |
| Forecast Data Period | 2025 - 2030 |
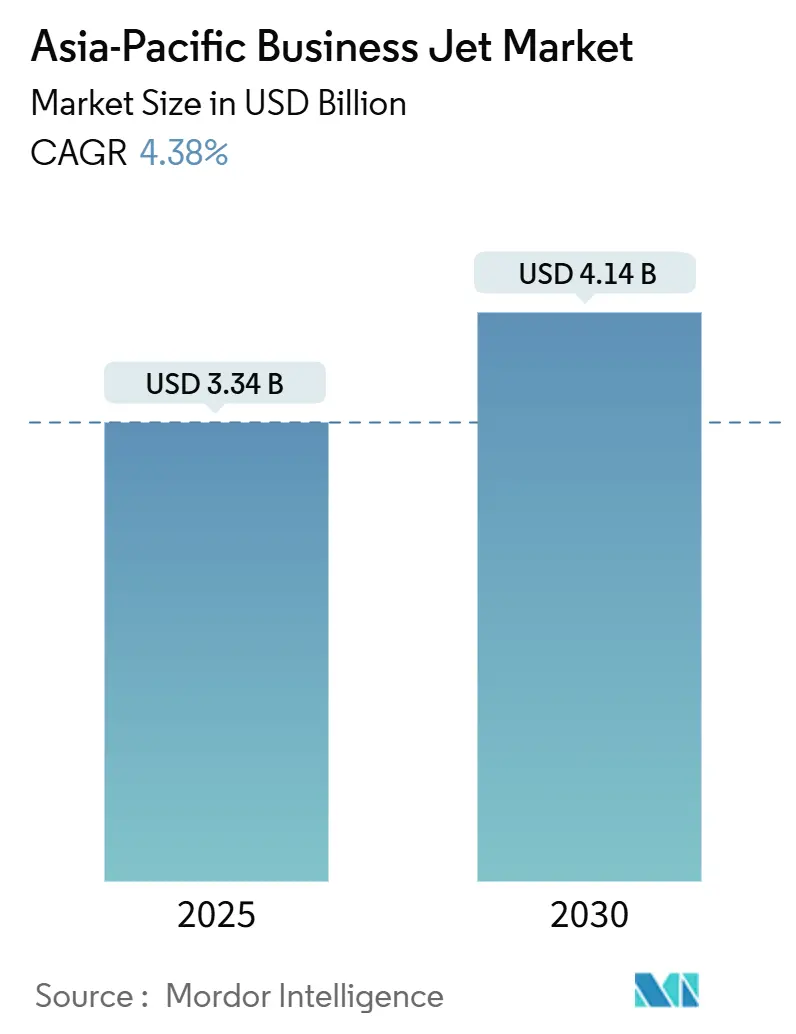
| Market Size (2025) | USD 3.34 Billion |
| Market Size (2030) | USD 4.14 Billion |
| Growth Rate (2025 - 2030) | 4.38% CAGR |
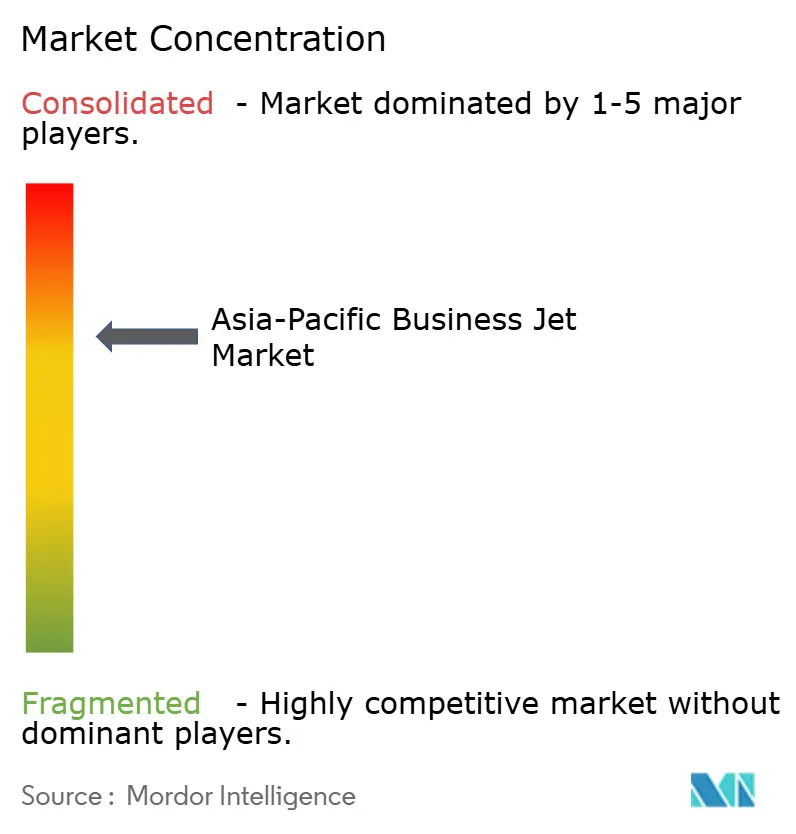
| Market Concentration | Medium |
Major Players *Disclaimer: Major Players sorted in no particular order Image © Mordor Intelligence. Reuse requires attribution under CC BY 4.0. | |
Asia-Pacific Business Jet Market Analysis by Mordor Intelligence
The Asia-Pacific business jet market size stands at USD 3.34 billion in 2025 and is projected to reach USD 4.14 billion by 2030, reflecting a 4.38% CAGR during the forecast period. This pace is sustained by surging high-net-worth individual (HNWI) populations, growing corporate cross-border activity, and continuing adoption of point-to-point charter services. Large-jet fleet preferences for long-range missions reinforce demand, while democratization trends spur rapid uptake of light and very-light jets. Fresh capital continues to flow into fixed-base operator (FBO) and maintenance, repair, and overhaul (MRO) infrastructure, lowering operating frictions. Tight new-aircraft supply supports residual values and encourages fractional, jet-card, and membership models that widen access to the Asia-Pacific business jet market.
Key Report Takeaways
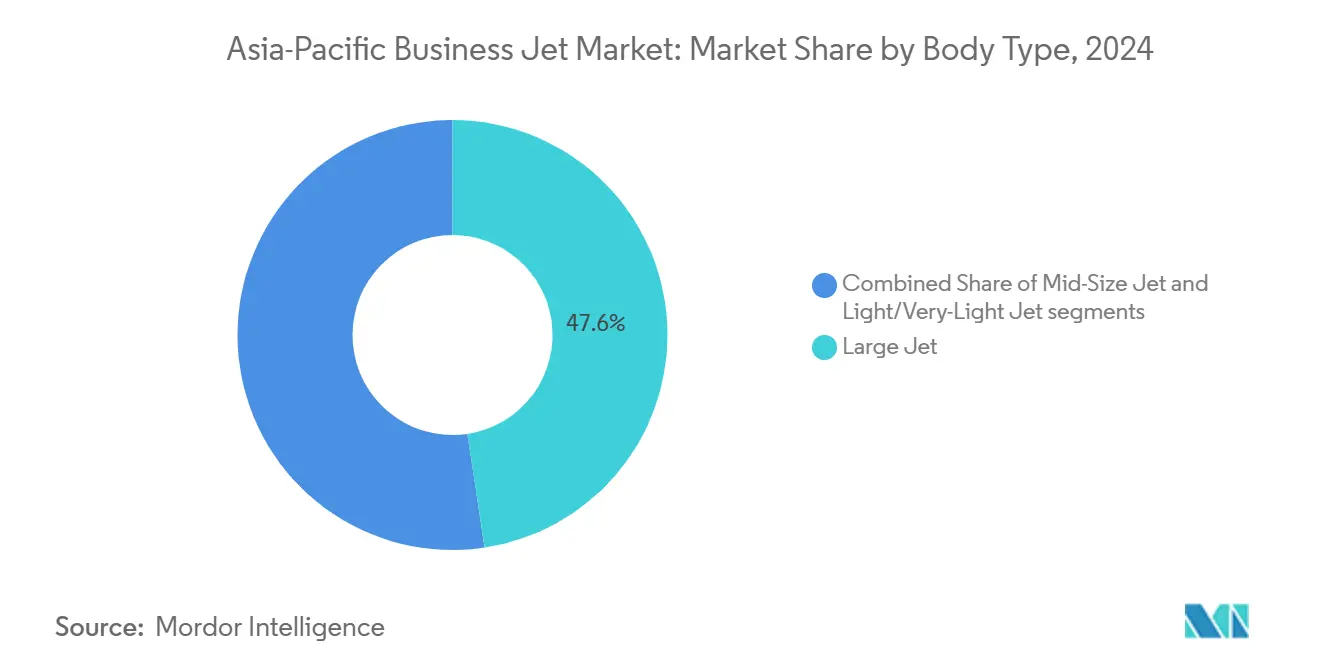
- By body type, large jets held 47.62% of the Asia-Pacific business jet market share in 2024, while light and very-light jets are projected to expand at a 6.12% CAGR through 2030.
- By end user, businesses and corporate entities commanded a 50.31% share of the Asia-Pacific business jet market size in 2024; charter and air-taxi operators are expected to advance at a 6.35% CAGR through 2030.
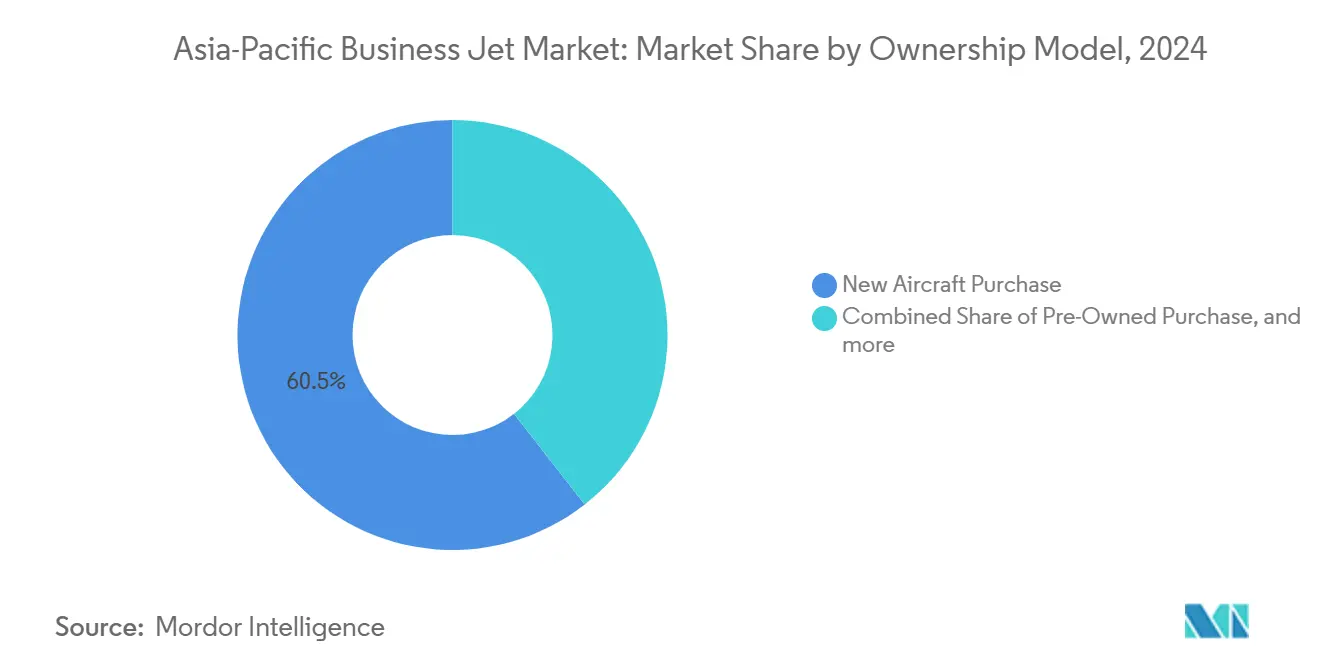
- By ownership model, new-aircraft purchases accounted for 60.54% of the Asia-Pacific business jet market size in 2024. In contrast, jet card and membership programs are expected to expand at a 8.37% CAGR through 2030.
- By geography, China led the Asia-Pacific business jet market with a 33.67% share in 2024, and India is forecast to record the highest CAGR of 7.18% between 2025 and 2030.
- Sino Jet, Deer Jet, Jet Aviation, TAG Aviation, and ExecuJet collectively controlled 17% of the managed fleet count in 2024, confirming a moderately fragmented landscape.
Note: Market size and forecast figures in this report are generated using Mordor Intelligence’s proprietary estimation framework, updated with the latest available data and insights as of January 2026.
Asia-Pacific Business Jet Market Trends and Insights
Driver Impact Analysis
| Driver | (%) Impact on CAGR Forecast | Geographic Relevance | Impact Timeline | |
|---|---|---|---|---|
| Rising HNWI and corporate wealth in Asia-Pacific | +1.20% | China, India, Singapore, Australia | Long term (≥ 4 years) | |
| Post-COVID surge in point-to-point charter demand | +0.80% | Global Asia-Pacific, concentrated in China, Japan | Medium term (2-4 years) | |
| Expansion of FBO and MRO infrastructure | +0.60% | China, Malaysia, Singapore, Australia | Medium term (2-4 years) | |
| Fleet-modernisation programmes of charter operators | +0.50% | China, Japan, Australia, Singapore | Long term (≥ 4 years) | |
| Liberalisation of secondary-airport night slots (ASEAN) | +0.40% | ASEAN-5 nations, spillover to broader Asia-Pacific | Short term (≤ 2 years) | |
| Time-critical cross-border e-commerce executive travel | +0.30% | China-ASEAN corridors, India-Southeast Asia | Medium term (2-4 years) | |
| Source: Mordor Intelligence | ||||
Understand The Key Trends Shaping This Market
Download PDF
Rising HNWI and Corporate Wealth
Asia-Pacific millionaires continue to proliferate at a faster rate than any other region, with HNWI ranks climbing 4.2% annually in 2024, and India leading the way with 6.1% growth. Newfound wealth attracts first-time private-jet users seeking the time, privacy, and health security advantages unavailable on commercial flights. Corporate treasuries also expand, and Asian conglomerates increasingly view business aviation as an operating asset central to supply-chain control and deal execution. Cross-border capital deployment between China, India, and Southeast Asia intensifies executive travel frequency, while the convenience gap between private and scheduled airlines grows wider on intra-Asia-Pacific itineraries. Together, these wealth trends lay a durable demand floor under the Asia-Pacific business jet market.
Post-COVID Surge in Point-to-Point Charter Demand
Health-risk sensitivity and hybrid meetings have reshaped corporate travel norms, prompting executives to opt for nonstop itineraries that bypass crowded hubs. VistaJet recorded a 400% year-over-year growth in membership in Japan during 2024, with regional flight hours increasing by 14%.[1]VistaJet, “APAC Market Performance Report 2024,” vistajet.com Charter providers report sustained double-digit gains in flight activity as companies lock in jet-card deposits to ensure guaranteed access. Direct routing reduces overnight stays, allowing management to compress multi-city trips into single-day cycles, resulting in a productivity uplift that narrows cost differentials with premium commercial tickets. As a result, charter activity now anchors recurring utilization of the Asia-Pacific business jet market rather than serving as a cyclical overflow valve.
Expansion of FBO and MRO Infrastructure
Capital inflows into ground infrastructure reduce operational friction and widen the addressable customer base. ExecuJet opened a USD 50 million MRO complex at Beijing Daxing in 2024, adding state-of-the-art hangars and line-maintenance bays.[2]ExecuJet, “Beijing Daxing MRO Facility Expansion 2024,” execujet.com Malaysia’s Subang Airport expansion delivered 15,000 square meters of new hangarage, positioning Kuala Lumpur as a maintenance and charter gateway for Southeast Asia. Enhanced FBO amenities—crew lounges, customs-in-facility, and on-site immigration—shrink turnaround times and improve passenger experience. Operators reroute aircraft to these hubs, eliminating costly ferry legs to distant service sites and enhancing the operational reliability of the Asia-Pacific business jet market.
Fleet-Modernization Programs of Charter Operators
Regional charter fleets are aging relative to Western peers, so operators are fast-tracking replacements to secure fuel efficiency and cabin-experience premiums. MJets Thailand injected SGD 17 million into WingsOverAsia in 2024 to co-finance next-generation aircraft acquisitions.[3]MJets, “WingsOverAsia Strategic Investment,” mjets.com Newer jets offer longer stage lengths and lower cabin decibel levels, allowing providers to charge higher hourly rates while reducing maintenance costs. Modern cabins equipped with Ka-band connectivity cater to digitally native executives, while lower CO₂ footprints help operators preempt tightening environmental regulations. Secondary-market aircraft freed by refresh cycles migrate to nascent markets, further deepening fleet penetration across the Asia-Pacific business jet market.
Liberalization of Secondary-Airport Night Slots
Regulators in ASEAN-5 nations approved harmonized night-slot rules in 2024, which opened up capacity at 68 secondary airports. Operators can now schedule post-business-day departures and dawn arrivals, enhancing aircraft utilization and smoothing customer itineraries. Slot flexibility reduces congestion-related delays at primary gateways while unlocking underserved city pairs. Charter firms promptly introduced new overnight routing options, and corporate users appreciated the reduced layover costs. The regulatory alignment also supports tourism flows into secondary cities without requiring significant infrastructure spending, thereby indirectly expanding the Asia-Pacific business jet market’s user base.
Time-Critical Cross-Border E-Commerce Executive Travel
Cross-border e-commerce surpassed USD 130 billion on the China-ASEAN axis in 2024, demanding relentless vendor audits, distribution checks, and partnership negotiations. Marketplace operators and third-party logistics leaders rely on private aviation to complete multi-country site reviews within 24 hours, a task that is impossible via scheduled carriers. For executives overseeing inventory pivots or flash-sale campaigns, the real cost lies in potential lost revenue from delayed decisions, not in charter fees. This calculus embeds business aviation as a strategic logistics tool, adding a structural layer of demand for the Asia-Pacific business jet market.
Restraints Impact Analysis
| Restraint | (%) Impact on CAGR Forecast | Geographic Relevance | Impact Timeline |
|---|---|---|---|
| High acquisition and operating costs plus FX volatility | -0.70% | Emerging Asia-Pacific markets, India, Indonesia, Thailand | Long term (≥ 4 years) |
| Import duties and luxury taxes in emerging Asia-Pacific markets | -0.50% | India, Indonesia, Malaysia, Thailand, Philippines | Medium term (2-4 years) |
| Asia-Pacific pilot-shortage bottleneck | -0.40% | Regional, concentrated in China, India, Southeast Asia | Long term (≥ 4 years) |
| Environmental opposition and potential slot curbs | -0.30% | Australia, Japan, Singapore, developed Asia-Pacific markets | Medium term (2-4 years) |
| Source: Mordor Intelligence | |||
High Acquisition and Operating Costs plus FX Volatility
Business jets are denominated in USD, exposing buyers to currency swings that erode purchasing power when local units weaken. Emerging-market operators face 2024-level exchange-rate volatility that can shift aircraft sticker prices by double-digit percentages within a quarter. Fuel, insurance, and OEM parts are pegged to global indices, limiting cost-localization strategies. Financing spreads remain wide in several Asia-Pacific banking systems, elevating total ownership cost and constraining uptake among smaller enterprises. Consequently, capital-intensive ownership hinders growth momentum in specific segments of the Asia-Pacific business jet market.
Import Duties and Luxury Taxes in Emerging Markets
India continues to levy an import duty of 28-30% and layered luxury taxes on business aircraft, thereby inflating delivered prices by up to 40% relative to the OEM list. Similar structures persist across Indonesia, Malaysia, Thailand, and the Philippines, entrenching the perception of private jets as extravagances rather than productivity assets. Operators often base aircraft offshore to mitigate taxes, but repositioning flights inflates costs and complicates scheduling. Tax uncertainty clouds residual-value projections, dampening fresh-order appetite in specific sub-regions of the Asia-Pacific business jet market.
Asia-Pacific Pilot-Shortage Bottleneck
Regional flight academies graduate fewer pilots than expanding fleets require, and foreign-pilot quota caps remain in place across China, India, and Indonesia. Charter operators, which require higher pilot-to-aircraft ratios, are particularly vulnerable and occasionally ground aircraft despite high demand. Compensation inflation lifts operating cost bases, and aggressive poaching by commercial airlines siphons experienced captains. Training lags, combined with regulatory hiring limits, shave utilization hours, curbing overall capacity, and tempering the upside for the Asia-Pacific business jet market.
Environmental Opposition and Potential Slot Curbs
Australia’s federal white paper on aviation, released in 2024, outlined carbon-reduction pathways that could place new levies on business aviation movement at primary airports. Japanese and Singaporean regulators are studying similar mechanisms, while environmental groups continue to frequently spotlight private-jet emissions. Noise-sensitive curfews already constrain late-night operations at Sydney and Narita. Future slot tightening or carbon pricing could raise operating costs and impair scheduling flexibility, weighing on demand in the most environmentally progressive nodes of the Asia-Pacific business jet market.
Segment Analysis
By Body Type: Large Jets Dominate Long-Range Connectivity
Large jets held 47.62% of the Asia-Pacific business jet market share in 2024, anchored by multinationals requiring nonstop Beijing-Sydney or Shanghai-London capabilities. They account for USD 1.59 billion of the Asia-Pacific business jet market size in 2025, and OEM backlogs remain tight, supporting residual values. Operators prize cabin volume and luggage capacity, and corporations allocate capital willingly due to the high value of executive time. Light and very-light jets, however, are projected to record a 6.12% CAGR, reflecting growing interest from first-time users and regional charter firms targeting two-hour stage lengths. Improved avionics and lower fuel burn cut per-mile costs, making short-hop private travel more attainable within the Asia-Pacific business jet market.
Demand stratification is evident: large-jet owners pursue brand prestige and nonstop reach, while cost-sensitive charters gravitate toward light jets for regional shuttles. Mid-size jets serve intermediate missions and benefit from cabin comfort upgrades brought by new models. Environmental scrutiny is nudging operators toward the latest generation across all categories, accelerating fleet refreshes and supporting the uptake of sustainable aviation fuel (SAF). Collectively, these trends diversify the Asia-Pacific business jet market, underpinning both premium and entry-level growth lanes.
Note: Segment shares of all individual segments available upon report purchase
Get Detailed Market Forecasts at the Most Granular Levels
Download PDF
By End User: Corporate Entities Drive Market Foundation
Businesses and corporate entities controlled 50.31% of the Asia-Pacific business jet market size in 2024, translating to roughly USD 1.68 billion in aircraft asset value. Industrial conglomerates and technology firms anchor recurring flight activity between manufacturing hubs, financial centers, and logistics nodes. Charter and air-taxi operators, growing at a forecast 6.35% CAGR, are democratizing access by offering guaranteed-availability jet-card models to small- and mid-cap companies. Individual owners still constitute a sizeable fleet slice, though their growth trails service models that avoid ownership complexity in the Asia-Pacific business jet market.
Corporate usage patterns are increasingly emphasizing team transport for project rollouts and plant visits, rather than solely C-suite travel. Training institutions and government special-mission fleets remain a niche yet stable market. The swing toward on-demand charters and fractional shares mirrors global asset-light trends, supporting wider utilization of the Asia-Pacific business jet market without proportionate capital outlay.
By Ownership Model: Traditional Purchase Models Face Service Competition
New aircraft purchases accounted for 60.54% of the Asia-Pacific business jet market size in 2024, equivalent to USD 2.02 billion in fleet asset value. Buyers cite warranty terms, latest safety features, and lower maintenance costs as justification for upfront capital. Still, jet-card memberships are expected to post the strongest 8.37% CAGR, signaling user preference for flexibility over ownership in a volatile macro environment. Fractional shares and pre-owned acquisitions help balance cost and availability pressures, redistributing capacity across the Asia-Pacific business jet market.
Currency risk and tax regimes push several companies toward time-based access programs rather than balance-sheet additions. Service providers respond with tiered card structures guaranteeing empty-leg credits and dynamic pricing. As OEM delivery slots remain constrained, leasing consortia and corporate flight departments tap into pre-owned inventory to bridge interim needs, ensuring the continuous expansion of the Asia-Pacific business jet market without exacerbating backlog strain.
Get Detailed Market Forecasts at the Most Granular Levels
Download PDF
Geography Analysis
China commanded a 33.67% share of the Asia-Pacific business jet market in 2024, operating 249 aircraft and generating USD 1.12 billion in annual revenue from flight services. A robust ultra-high-net-worth (HNW) ecosystem sustains demand for large cabins, while government relations remain vital for securing slot access at constrained airports. Japan and Australia follow with mature user bases and sophisticated FBO networks that streamline cross-Pacific operations. Singapore, despite limited domestic airspace, functions as a regulatory and maintenance hub, issuing region-wide charter certificates that buttress the Asia-Pacific business jet market.
India is forecast to deliver a 7.18% CAGR to 2030, fueled by rapid private-sector wealth creation and liberalized charter licensing. Tax hurdles persist, yet infrastructure upgrades at Mumbai, Delhi, and Hyderabad improve ground handling efficiency. Indonesia, Malaysia, Thailand, and the Philippines exhibit divergent trajectories, depending on their duty structures and tourism recovery. The ASEAN safety-data initiative simplifies multi-stop itineraries across five member states, fostering multijurisdiction charter loops within the Asia-Pacific business jet market.
The Rest of Asia-Pacific territories, including South Korea, New Zealand, and Pacific islands, register modest fleet counts, but resource exploration and high-end tourism sustain charter traffic. Foreign direct investment into ASEAN exceeded USD 200 billion in 2024, prompting project-site flights among executives in the construction, energy, and tech sectors. Operators with multilingual crews and local regulatory fluency capture a disproportionate share, underlining the geographic complexity that shapes the Asia-Pacific business jet market.
Get Analysis on Important Geographic Markets
Download PDF
Competitive Landscape
Fragmentation defines the Asia-Pacific business jet industry, with no single jet operator controlling more than 4% of the total fleet of aircraft. Sino Jet leads with 41 jets, while Deer Jet, TAG Aviation, Jet Aviation, and ExecuJet round out the top tier at 20-30 aircraft each. Manufacturers such as Bombardier, Gulfstream, Dassault, and Cessna balance factory-direct sales and dealer partnerships to penetrate diverse regulatory regimes. Charter specialists invest in real-time booking platforms, predictive maintenance analytics, and SAF sourcing to differentiate themselves within the Asia-Pacific business jet market.
Strategic moves signal infrastructure consolidation. ExecuJet expanded its Beijing Daxing MRO capacity by 10,000 square meters in September 2024, securing OEM authorizations for multiple airframes. This move, combined with MJets’ equity placement into WingsOverAsia's finances, will facilitate fleet modernization and geographic extension across ASEAN. VistaJet deepened fixed-hour subscription sales in Japan and Australia, pairing guaranteed capacity with carbon-offset bundles to align with corporate sustainability mandates. These tactics illustrate a shift toward service depth and environmental stewardship rather than fleet volume alone in the Asia-Pacific business jet market.
Technology adoption accelerates competitive edges. Providers deploy artificial-intelligence flight-planning tools to minimize fuel burn and circumvent slot bottlenecks. Blockchain-based maintenance logs and digital trip-request portals streamline regulatory approvals. Operators that pair tech with regional diplomacy secure route rights and client loyalty, enhancing resilience against macro headwinds in the Asia-Pacific business jet market.
Asia-Pacific Business Jet Industry Leaders
Bombardier Inc.
Gulfstream Aerospace Corporation (General Dynamics Corporation)
Dassault Aviation SA
Textron Inc.
Embraer S.A.
- *Disclaimer: Major Players sorted in no particular order
Need More Details on Market Players and Competitors?
Download PDF
Recent Industry Developments
- October 2025: Sojitz Corporation ordered two aircraft: the high-performance Global 6500 and the flagship Bombardier Global 8000, set to enter service. These newly acquired aircraft will be pivotal for Sojitz as it launches the Share Jet Program (SJP), marking Japan’s inaugural shared ownership initiative for large, ultra-long-range business jets, which are adept at trans-Pacific flights. The aircraft in SJP boasts bespoke interiors, meticulously crafted to embody the company's distinct vision and high standards. This vision was realized, thanks to Bombardier’s profound expertise in cabin design and craftsmanship.
- January 2024: Adani Group ordered six Pilatus PC-24 aircraft to enhance transportation efficiency for its business people. With this acquisition, Adani Group's fleet of business jets will expand to a total of 12. This strategic move underscores the company's commitment to ensuring seamless transportation for its top executives and business people on aircraft. Karnavati Aviation, the aviation division of Gautam Adani's conglomerate overseeing all business jets, spearheaded the acquisition of these new aircrafts, as reported by Livemint.
Asia-Pacific Business Jet Market Report Scope
By Body Type
| Large Jet |
| Mid-Size Jet |
| Light/Very-Light Jet |
By End User
| 500–1,000 kg |
| Individual Owners |
| Businesses and Corporate Entities |
| Charter/Air-Taxi Operators |
| Training and Academic Institutions |
| Government and Special-Mission Operators |
By Ownership Model
| New Aircraft Purchase |
| Pre-Owned Purchase |
| Fractional Ownership |
| Jet Cards/Membership |
By Country
| China |
| Japan |
| India |
| Australia |
| South Korea |
| Singapore |
| Indonesia |
| Malaysia |
| Thailand |
| Philippines |
| Rest of Asia-Pacific |
| By Body Type | Large Jet |
| Mid-Size Jet | |
| Light/Very-Light Jet | |
| By End User | 500–1,000 kg |
| Individual Owners | |
| Businesses and Corporate Entities | |
| Charter/Air-Taxi Operators | |
| Training and Academic Institutions | |
| Government and Special-Mission Operators | |
| By Ownership Model | New Aircraft Purchase |
| Pre-Owned Purchase | |
| Fractional Ownership | |
| Jet Cards/Membership | |
| By Country | China |
| Japan | |
| India | |
| Australia | |
| South Korea | |
| Singapore | |
| Indonesia | |
| Malaysia | |
| Thailand | |
| Philippines | |
| Rest of Asia-Pacific |
Need A Different Region or Segment?
Customize Now
Market Definition
- Aircraft Type - General Aviation includes aircraft used for corporate aviation, business aviation and other aerial works.
- Sub-Aircraft Type - Business Jets which are private jets and are designed to carry small groups of people and are used for various roles are included in this study.
- Body Type - Light Jets, Mid-Size Jets, and Large Jets according to their ability to carry passengers and flying distance ranges have been included under this study.
| Keyword | Definition |
|---|---|
| IATA | IATA stands for the International Air Transport Association, a trade organization composed of airlines around the world that has an influence over the commercial aspects of flight. |
| ICAO | ICAO stands for International Civil Aviation Organization, a specialized agency of the United Nations that supports aviation and navigation around the globe. |
| Air Operator Certificate (AOC) | A certificate granted by a National Aviation Authority permitting the conduct of commercial flying activities. |
| Certificate Of Airworthiness (CoA) | A Certificate Of Airworthiness (CoA) is issued for an aircraft by the civil aviation authority in the state in which the aircraft is registered. |
| Gross Domestic Product (GDP) | Gross domestic product (GDP) is a monetary measure of the market value of all the final goods and services produced in a specific time period by countries. |
| RPK (Revenue Passenger Kilometres) | The RPK of an airline is the sum of the products obtained by multiplying the number of revenue passengers carried on each flight stage by the stage distance - it is the total number of kilometers traveled by all revenue passengers. |
| Load Factor | The load factor is a metric used in the airline industry that measures the percentage of available seating capacity that has been filled with passengers. |
| Original Equipment Manufacturer (OEM) | An original equipment manufacturer (OEM) traditionally is defined as a company whose goods are used as components in the products of another company, which then sells the finished item to users. |
| International Transportation Safety Association (ITSA) | International Transportation Safety Association (ITSA) is an international network of heads of independent safety investigation authorities (SIA). |
| Available Seats Kilometre (ASK) | This metric is calculated by multiplying Available Seats (AS) in one flight, defined above, multiplied by the distance flown. |
| Gross Weight | The fully-loaded weight of an aircraft, also known as “takeoff weight,” which includes the combined weight of passengers, cargo, and fuel. |
| Airworthiness | The ability of an aircraft, or other airborne equipment or system, to operate in flight and on the ground without significant hazard to aircrew, ground crew, passengers or to other third parties. |
| Airworthiness Standards | Detailed and comprehensive design and safety criteria applicable to the category of aeronautical product (aircraft, engine or propeller). |
| Fixed Base Operator (FBO) | A business or organization that operates at an airport. An FBO provides aircraft operating services like maintenance, fueling, flight training, charter services, hangaring, and parking. |
| High Net worth Individuals (HNWIs) | High Net worth Individuals (HNWIs) are individuals with over USD 1 million in liquid financial assets. |
| Ultra High Net worth Individuals (UHNWIs) | Ultra High Net worth Individuals (UHNWIs) are individuals with over USD 30 million in liquid financial assets. |
| Federal Aviation Administration (FAA) | The division of the Department of Transportation is concerned with aviation. It operates Air Traffic Control and regulates everything from aircraft manufacturing to pilot training to airport operations in the United States. |
| EASA (European Aviation Safety Agency) | The European Aviation Safety Agency is a European Union agency established in 2002 with the task of overseeing civil aviation safety and regulation. |
| Airborne Warning and Control System (AW&C) aircraft | Airborne Warning and Control System (AEW&C) aircraft is equipped with a powerful radar and on-board command and control center to direct the armed forces. |
| The North Atlantic Treaty Organization (NATO) | The North Atlantic Treaty Organization (NATO), also called the North Atlantic Alliance, is an intergovernmental military alliance between 30 member states – 28 European and two North American. |
| Joint Strike Fighter (JSF) | Joint Strike Fighter (JSF) is a development and acquisition program intended to replace a wide range of existing fighter, strike, and ground attack aircraft for the United States, the United Kingdom, Italy, Canada, Australia, the Netherlands, Denmark, Norway, and formerly Turkey. |
| Light Combat Aircraft (LCA) | A light combat aircraft (LCA) is a light, multirole jet/turboprop military aircraft, commonly derived from advanced trainer designs, designed for engaging in light combat. |
| Stockholm International Peace Research Institute (SIPRI) | Stockholm International Peace Research Institute (SIPRI) is an international institute that provides data, analysis, and recommendations for armed conflict, military expenditure, and arms trade as well as disarmament and arms control. |
| Maritime Patrol Aircraft (MPA) | A maritime patrol aircraft (MPA), also known as maritime reconnaissance aircraft is a fixed-wing aircraft designed to operate for long durations over water in maritime patrol roles, in particular, anti-submarine warfare (ASW), anti-ship warfare (AShW), and search and rescue (SAR). |
| Mach Number | The Mach number is defined as the ratio of true airspeed to the speed of sound at the altitude of a given aircraft. |
| Stealth Aircraft | Stealth is a Common term applied to low observable (LO) technology and doctrine, that makes an aircraft near invisible to radar, infrared or visual detection. |
Need More Details on Market Definition?
Ask a Question
Research Methodology
Mordor Intelligence follows a four-step methodology in all our reports.
- Step-1: Identify Key Variables: In order to build a robust forecasting methodology, the variables and factors identified in Step-1 are tested against available historical market numbers. Through an iterative process, the variables required for market forecast are set and the model is built on the basis of these variables.
- Step-2: Build a Market Model: Market-size estimations for the historical and forecast years have been provided in revenue and volume terms. For sales conversion to volume, the average selling price (ASP) is kept constant throughout the forecast period for each country, and inflation is not a part of the pricing.
- Step-3: Validate and Finalize: In this important step, all market numbers, variables and analyst calls are validated through an extensive network of primary research experts from the market studied. The respondents are selected across levels and functions to generate a holistic picture of the market studied.
- Step-4: Research Outputs: Syndicated Reports, Custom Consulting Assignments, Databases & Subscription Platforms

Get More Details On Research Methodology
Download PDF


