
Asia Pacific Base Oil Market Size and Share
Market Overview
| Study Period | 2021 - 2031 |
|---|---|
| Forecast Data Period | 2026 - 2031 |
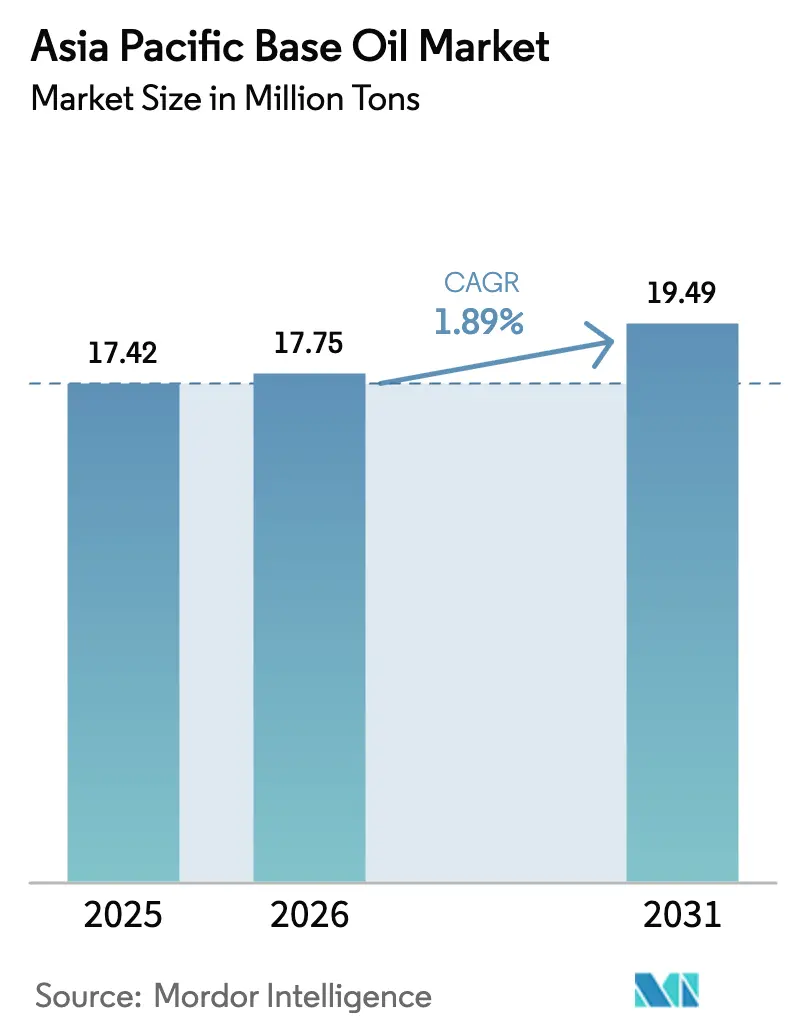
| Base Year Market Size (2025) | 17.42 Million tons |
| Market Volume (2026) | 17.75 Million tons |
| Market Volume (2031) | 19.49 Million tons |
| Growth Rate (2026 - 2031) | 1.89 % |
| Market Concentration | Medium |
Major Players *Disclaimer: Major Players sorted in no particular order Image © Mordor Intelligence. Reuse requires attribution under CC BY 4.0. | |
Asia Pacific Base Oil Market Analysis by Mordor Intelligence
The Asia Pacific Base Oil Market size was valued at 17.42 million tons in 2025 and is estimated to grow from 17.75 million tons in 2026 to reach 19.49 million tons by 2031, at a CAGR of 1.89% during the forecast period (2026-2031). Stricter emission regulations in China and India are accelerating the shift from Group I toward Group II and Group III grades, while electric-vehicle (EV) adoption is beginning to chip away at internal-combustion-engine lubricant demand. Integrated refiners with hydrocracking upgrades in Ningbo, Tahe, and Singapore are boosting Group II output faster than regional offtake, creating a heavy-grade surplus that pressures merchant blenders. Engine oil demand remains resilient thanks to longer drain intervals, two-wheeler delivery fleets, and low-SAPS formulations, yet the Asia Pacific Base Oil market faces a widening quality gap as low-sulfur premium stocks grow scarcer in inland areas. Consolidation among teapot refiners, API 1509 base-stock interchange rules, and emerging circular-economy mandates will shape supply dynamics through 2031.
Key Report Takeaways
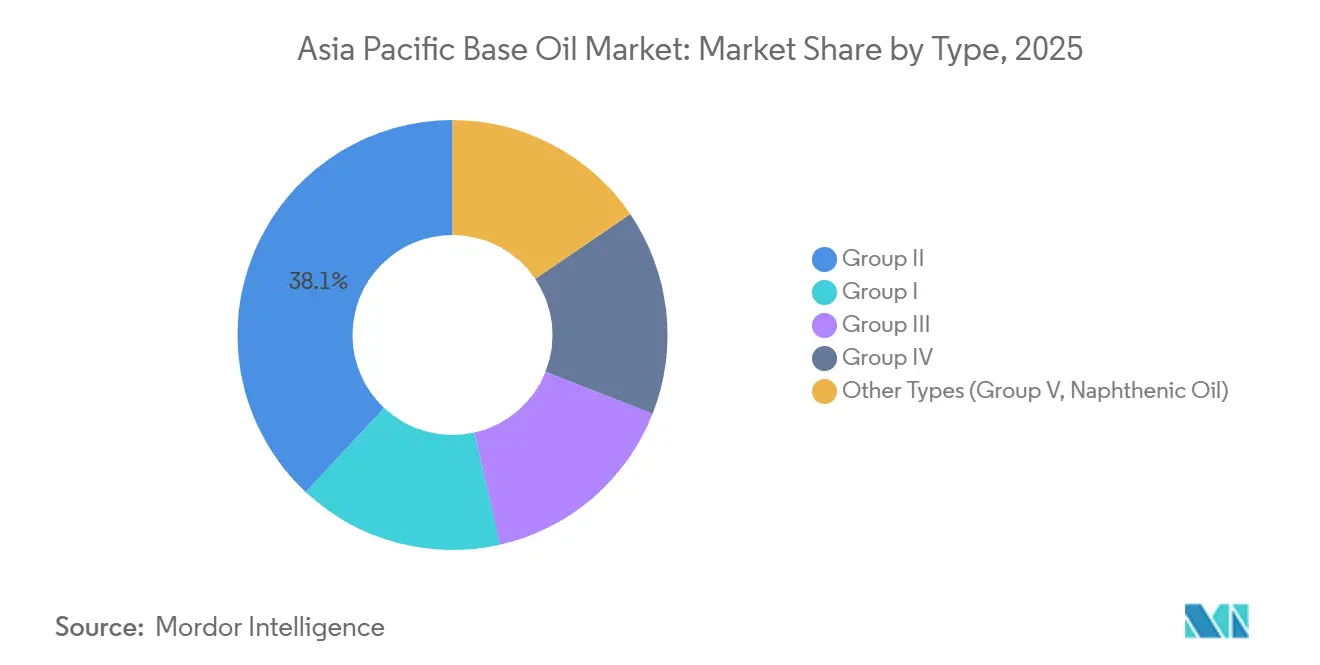
- By type, Group II captured 38.05% of the Asia Pacific base oil market share in 2025, while Group III is forecast to expand at a 3.30% CAGR to 2031.
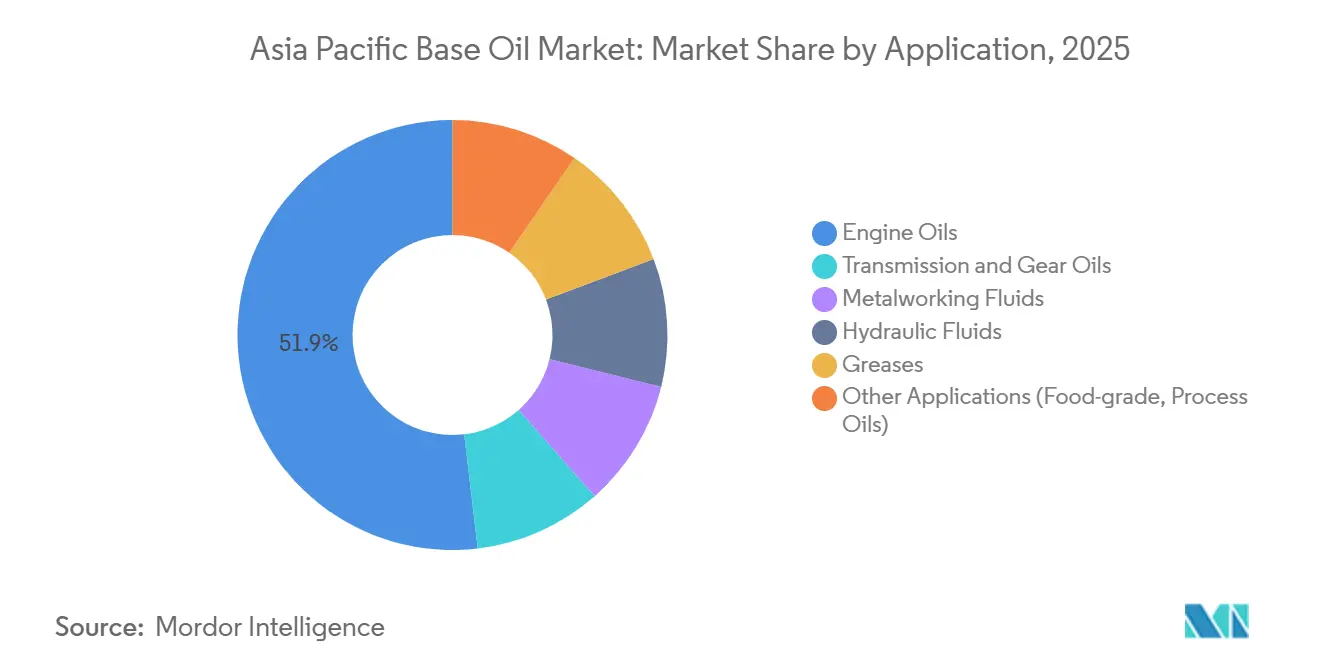
- By application, engine oils accounted for 51.87% of the Asia Pacific base oil market size in 2025 and are advancing at a 2.75% CAGR through 2031.
- By geography, China led with 46.02% volume in 2025; India is the fastest-growing market at a 2.98% CAGR through 2031.
Note: Market size and forecast figures in this report are generated using Mordor Intelligence’s proprietary estimation framework, updated with the latest available data and insights as of January 2026.
Worldwide, activity is shaped by contributions from multiple regions, with Asia representing one of the more structurally developed among them. The global report on base oil market by Mordor Intelligence reflects how these regional layers combine into a single system.
Market Trends and Insights
Drivers Impact Analysis of Asia Pacific Base Oil Market*
| Drivers | (~) % Impact on CAGR Forecast | Geographic Relevance | Impact Timeline |
|---|---|---|---|
| Growing shift from Group I to Group II base stocks due to tightening emission norms | +0.6% | China, India, ASEAN core (Thailand, Indonesia, Vietnam) | Medium term (2-4 years) |
| Rising demand for high-performance automotive lubricants in China and India | +0.5% | China, India | Short term (≤ 2 years) |
| OEM-driven drain-interval extensions favouring premium Group III/IV stocks | +0.4% | Global, with concentration in Japan, South Korea, China | Medium term (2-4 years) |
| Adoption of re-refined base oils under circular-economy policies | +0.2% | Singapore, China, India | Long term (≥ 4 years) |
| Surge in two-wheeler delivery fleets accelerating low-viscosity engine-oil uptake | +0.3% | India, Indonesia, Vietnam, Thailand | Short term (≤ 2 years) |
| Source: Mordor Intelligence | |||
Growing Shift from Group I to Group II Base Stocks Due to Tightening Emission Norms
India’s BS VI and China 6 standards limit sulfur to 10 ppm, forcing blenders to abandon Group I stocks for cleaner Group II alternatives. ExxonMobil’s Singapore Resid Upgrade Project added 20,000 barrels per day of Group II capacity in September 2025 to serve this demand[1]. Japan’s JASO GLV-2 spec for ultra-high-viscosity-index oils is pushing Group III adoption in hybrids. Rural India and inland China still rely on Group I for price-sensitive segments, creating a parallel supply chain that will persist until 2028. Mid-tier refiners are fast-tracking hydrocracker revamps to stay relevant, yet cash-flow constraints limit upgrades to coastal assets.
Rising Demand for High-Performance Automotive Lubricants in China and India
China produced 30.2 million vehicles in 2024, with turbocharged engines exceeding 60% of output, up from 45% in 2020. Turbocharged units run hotter, so OEMs specify Group II or Group III oils to prevent oxidation. India’s passenger-vehicle sales reached 4.2 million units in fiscal 2025, with SUVs claiming 48% of registrations. Carmakers such as Maruti Suzuki pre-fill engines with API SP oils, locking the aftermarket into premium grades. This preference compresses the addressable pool for Group I stocks, which now serve mostly heavy-duty diesel fleets.
OEM-Driven Drain-Interval Extensions Favouring Premium Group III/IV Stocks
Toyota’s 2025 hybrid service schedules stretch oil changes to 15,000 kilometers when 0W-16 or 0W-20 Group III formulations are used. Hyundai and Kia apply similar regimes for GDI engines to avoid low-speed pre-ignition. GS Caltex, with 275,000 barrels per day of heavy-oil upgrading, supplies Group III stocks that underpin these longer drains. Premium SKUs enjoy USD 200–300 per-ton pricing spreads over commodity grades, yet additive packages cost USD 150–200 per ton, squeezing blenders that lack scale.
Adoption of Re-Refined Base Oils Under Circular-Economy Policies
China’s Ministry of Ecology and Environment requires collectors to divert 30% of used lubricants to licensed re-refiners by 2026[2]. Neste’s USD 2.1 billion Singapore expansion can transform waste fats into Group II-equivalent stocks, opening a renewable feedstock pool. India’s Extended Producer Responsibility framework imposes collection targets, but patchy enforcement outside tier-1 cities limits feed quality. Re-refined oils sell at a USD 50–100 per-ton discount to virgin Group II, yet concerns over batch consistency deter mainstream adoption.
Restraints Impact Analysis of Asia Pacific Base Oil Market*
| Restraints | (~) % Impact on CAGR Forecast | Geographic Relevance | Impact Timeline |
|---|---|---|---|
| Accelerating EV penetration curbing long-term ICE-lubricant demand | -0.5% | China, Thailand, India | Medium term (2-4 years) |
| Persistent oversupply in heavy grades (SN 500/BS) depressing prices | -0.3% | China, Singapore, South Korea | Short term (≤ 2 years) |
| Quality-perception barriers limiting re-refined base-oil adoption | -0.1% | India, ASEAN (Indonesia, Vietnam) | Long term (≥ 4 years) |
| Source: Mordor Intelligence | |||
Accelerating EV Penetration Curbing Long-Term ICE-Lubricant Demand
Battery-electric vehicles need 70% less lubricant than gasoline cars, a reality most visible in China, where EV sales reached 9.5 million units in 2024, equal to 35% of passenger-car volume. Thailand hit EV price parity in 2024, and India’s two-wheeler electrification rate is scaling fast. Commercial trucks and off-highway gear remain ICE-dominated, but passenger-car lubricant pools will continue shrinking, setting a ceiling on long-term Asia Pacific Base Oil market growth.
Persistent Oversupply in Heavy Grades (SN 500/Bright Stock) Depressing Prices
Sinopec’s Tahe upgrade and CNOOC’s Daxie expansion have injected unplanned heavy barrels into a saturated market, pushing SN 500 spot prices in Singapore down 15% year-on-year in H1 2025. Teapot refiners that survived the 2023–24 consolidation wave are exporting surplus volumes, eroding margins for merchant suppliers. Integrated majors hedge by channeling bright-stock output into marine and industrial lubes, but smaller blenders face shrinking spreads that may trigger further consolidation.
*Our forecasts treat driver/restraint impacts as directional, not additive. The impact forecasts reflect baseline growth, mix effects, and variable interactions.
Asia Pacific Base Oil Market Segment Analysis
By Type:
Group II Dominance Meets Group III MomentumGroup II held 38.05% of the Asia Pacific base oil market in 2025, owing to emission-driven demand for low-sulfur stocks. The Asia Pacific Base Oil market size for Group III is forecast to expand at a 3.30% CAGR, the fastest among all grades, propelled by turbocharged and hybrid powertrain requirements. ExxonMobil’s new EHC 340 MAX extra-heavy Group II grade targets sectors that once relied on bright stock. Petronas and Pertamina’s planned 800-tons-per-day Group III plant in Indonesia will deepen regional supply diversity. Margin gaps between Group II and Group III have narrowed to USD 150–200 per ton, encouraging blenders to switch applications without prohibitive cost penalties.
Legacy Group I capacity now supports niche heavy-duty diesel and industrial fluids, but continues to lose share. Indian Oil Corporation’s Panipat revamp and HPCL’s LOBS upgrades will convert significant Group I throughput into Group II and Group III by 2026, accelerating the trend. Group IV PAO remains below 5% of regional volume yet commands premium pricing in aerospace, while Group V naphthenics serve stable specialty segments. Overcapacity risks persist if new hydrofinish units outpace high-grade demand, but refinery rationalization in inland China may remove marginal Group I assets by 2029.

By Application:
Engine Oils Lead, Metalworking Fluids TrailEngine oils absorbed 51.87% of demand in 2025, and the segment is advancing at a 2.75% CAGR through 2031, the swiftest among applications. OEM-mandated low-viscosity grades such as 0W-20 and 5W-30 require Group II or Group III stocks that resist oxidation and support fuel-economy gains. API’s SP and ILSAC’s GF-6 specs embed these requirements, effectively steering volume toward premium bases. Transmission-fluid demand faces long-run headwinds as EVs use simple reducers, but manual and CVT fluids remain relevant for legacy fleets.
Metalworking fluids track manufacturing activity, which stayed robust in China, India, and Vietnam, sustaining demand despite automation headwinds. Hydraulic fluids benefit from infrastructure megaprojects such as India’s Bharatmala and metro expansions, which use equipment that is slow to electrify. Among the greases, lithium-complex and polyurea formulations are gaining ground as EV motor bearings demand higher thermal stability. Food-grade, transformer, and process-oil niches remain small yet profitable, with demand tied to regulatory compliance rather than macro cycles.
Geography Analysis
APAC Base Oil Market
China contributed 46.02% of regional volume in 2025, anchored by Sinopec and CNOOC’s refining scale. However, oversupply in heavy grades and peaking gasoline demand are eroding margins. The base oil market in India is growing fastest at a 2.98% CAGR, supported by Indian Oil Corporation’s USD 20 billion refinery expansion plan and HPCL’s Barmer greenfield project, which will cut import dependency from 36% in 2024 to an estimated 22% in 2028. Japan and South Korea exhibit stable demand but act as export hubs for specialty grades; GS Caltex alone ships significant Group III tonnage to Southeast Asia.
ASEAN economies are emerging growth pockets. Thailand’s USD 1.44 billion EV investment program has yet to dent ICE production, keeping lubricant demand buoyant. Indonesia and Vietnam attract foreign investment in manufacturing, feeding demand for metalworking and hydraulic fluids. Petronas Lubricants’ 220,000-tons-per-year Group III plant in Malaysia and the planned Indonesia JV position ASEAN as a future premium-base-oil hub. Australia and New Zealand, while small, provide steady marine and mining lubricant demand that values high-viscosity stocks.
Regulatory Landscape
Regulatory pressure across Asia-Pacific continues to push lubricant formulations toward lower-sulfur, higher-performance base stocks and to formalize circular-economy pathways for used oil. In China, tighter fuel and emissions compliance frameworks, alongside Ministry of Ecology and Environment guidance that requires used-lubricant collectors to divert 30% of volumes to licensed re-refiners by 2026, supports greater acceptance of re-refined base oils and raises documentation and traceability requirements across the supply chain. India has also tightened the quality and procurement framework around re-refined content, with a Bureau of Indian Standards specification (IS 18722) and an April 2025 Ministry of Petroleum and Natural Gas directive for public sector oil companies to increase procurement of re-refined stocks, which increases downstream qualification work for blenders and marketers.
Policy developments affecting liquid fuels also influence base-oil and additive demand patterns in the region. Indonesia is implementing a nationwide B50 biodiesel mandate on July 1, 2026, lifting fatty-acid methyl ester content requirements in diesel and increasing the need for oxidation stability and cold-flow management in fuel additive packages, with indirect implications for refinery blending economics and distillate pool management. Across ASEAN, the emergence of REACH-like chemical registration frameworks adds compliance steps for lubricant additives and specialty components traded cross-border, while Vietnam has introduced extended producer responsibility recovery targets (15-20% by 2026) that reinforce collection and recycling infrastructure relevant to used-lubricant streams.
Value Chain Analysis
The Asia-Pacific base-oil value chain runs from crude and vacuum gasoil supply into integrated refining and upgrading (solvent refining for Group I, hydrocracking/hydroisomerization for Group II/III), followed by storage and trading hubs, and then blending, packaging, and distribution into automotive and industrial lubricant channels. Singapore remains a key regional nexus for merchant base-oil trading and redistribution, reinforced by investments such as ExxonMobil commissioning its Singapore resid upgrade project in September 2025, adding 20,000 bpd of Group II capacity and shifting more feed from low-value fuel oil into premium base stocks. China anchors large-scale production and internal consumption, with technology licensing and unit additions supporting higher-purity specialty streams, illustrated by Chevron Lummus Global commissioning a white oil hydroprocessing unit at Hongrun Petrochemical in February 2025.
Downstream, large lubricant marketers and additive suppliers influence grade shifts through OEM approvals and drain-interval regimes, while smaller blenders remain more exposed to spot price swings and heavy-grade surpluses. Ownership and integration changes can reshape feedstock access and export optionality. For example, Petronas assuming full ownership of the Pengerang Refining and Petrochemical (PRefChem) complex in Malaysia in May 2026 consolidates control over a major regional refining and petrochemical asset, which can streamline molecule-focused upgrading decisions and commercial alignment for base-oil and related streams. Circularity is an expanding parallel channel, with used-oil collection, aggregation, and licensed re-refining becoming more structured under China and India policy actions, but scaling beyond niche applications still depends on consistent feed quality, product testing, and interchange governance.
Competitive Landscape
The Asia-Pacific Base Oil market is moderately fragmented. State-owned refiners such as Sinopec, CNOOC, and Indian Oil Corporation leverage integration to buffer base-oil price swings. ExxonMobil’s 20,000-barrel-per-day Group II expansion in Singapore folds into a fuels-plus-chemicals complex that maximizes margins. Shell and CNOOC’s Huizhou Phase 3 project, approved in January 2025, includes linear alpha olefin capacity that feeds synthetic PAO production, signaling a strategic pivot toward premium Group IV grades.
Re-refiners and specialty blenders occupy circular-economy niches. Neste’s USD 2.1 billion project in Singapore demonstrates the capital intensity required to scale renewable feedstock conversion. Chennai Petroleum invests INR 700–800 million annually to upgrade LOBS units for Group II/III output, highlighting regional ambition. Smaller blenders partner with additive majors to match performance without refining assets, yet margin compression in commodity grades hastens consolidation. API 1509 interchange rules lower technical barriers for re-refiners, but lingering quality perceptions limit their share below 5%.
Asia Pacific Base Oil Industry Leaders
-
SK On Co., Ltd.
-
Exxon Mobil Corporation.
-
Saudi Arabian Oil Co.
-
Chevron Corporation
-
GS Caltex Corporation
- *Disclaimer: Major Players sorted in no particular order

Asia Pacific Base Oil Market Companies Covered in this Report
- Chevron Corporation
- CNOOC
- Ergon, Inc.
- Exxon Mobil Corporation.
- GS Caltex Corporation
- HP Lubricants
- Indian Oil Corporation Ltd.
- Neste
- Petronas Lubricants International
- Phillips 66 Company
- Repsol
- Saudi Arabian Oil Co.
- Sinopec Corp
- SK On Co., Ltd.
Market Opportunities and Future Outlook
A primary whitespace area is the build-out of re-refined base oil (RRBO) ecosystems that can meet premium performance and consistency needs under tighter circular-economy requirements. China is moving used-oil volumes toward licensed re-refiners through a 2026 diversion requirement for collectors (30%), and India has formalized RRBO quality and procurement signals through BIS IS 18722 and an April 2025 directive for public sector oil companies to increase procurement of re-refined stocks. These measures create opportunity for licensed re-refiners and for blenders that can qualify RRBO streams under API 1509 base-stock interchange rules, particularly where inland markets face constraints in access to low-sulfur premium virgin stocks.
A second opportunity sits at the interface of fuels policy and formulation complexity, where higher bio-content mandates and emissions-aligned specifications increase demand for specialized additive packages and technical fluids. Indonesia’s B50 mandate effective July 1, 2026 raises the need for oxidation stability and cold-flow performance management in diesel, supporting demand for higher-value additive solutions and related blending services. On the base-oil side, the shift from Group I toward Group II and Group III is reinforced by the region’s tighter emissions regimes and OEM-driven low-viscosity engine-oil requirements, and it is being matched by capacity and molecule-upgrading investments such as ExxonMobil’s Singapore resid upgrade startup in September 2025. At the same time, EV adoption reduces conventional engine-oil intensity, which increases emphasis on premium technical fluids and differentiated lubricant formulations, where suppliers with high-VI base stocks and strong qualification capabilities can defend margins.
Recent Industry Developments in Asia Pacific Base Oil Market
- June 2026: ExxonMobil addressed premium base oil supply disruptions originating from the Middle East by adjusting its finished lubricant production mix and procuring alternative crude and feedstocks through its global trading network. The company also collaborated with automakers on alternative product formulations to sustain supply quality. The action strengthens downstream competitiveness through enhanced sourcing agility and flexible product development.
- June 2026: ExxonMobil identified its Baytown refinery reconfiguration project as a strategic long-term initiative to improve base oil production flexibility. The initiative aims to boost capacity and process adaptability to varying feedstocks. This enhances resilience to feedstock volatility and supports premium-base-oil output.
- May 2026: Total US base oil imports dropped to below 575,000 barrels, down from over 1.20 million barrels in April 2026, as shipments from the Middle East declined following a supply disruption. The shift signals a tighter regional balance and potential shift to domestic or alternative sources in APAC-led supply considerations.
Asia Pacific Base Oil Market Report Scope and Research Methodology
Market Definition and Coverage
For this study, the Asia Pacific base oil market covers the supply and consumption of base stocks used to formulate lubricants across key end uses in the region, tracked as annual volume in tons and converted consistently across grades.
Scope exclusions: Finished lubricants, additive packages, and specialty process oils not sold as base stocks are excluded from the market totals.
Segments Covered in This Report
- ByType
- Group I
- Group II
- Group III
- Group IV
- Other Types (Grouo V, Naphthenic Oil)
- By Application
- Engine Oils
- Transmission and Gear Oils
- Metalworking Fluids
- Hydraulic Fluids
- Greases
- Other Applications (Food-grade, Process Oils)
- By Geography
- China
- India
- Japan
- South Korea
- ASEAN Countries
- Rest of Asia-Pacific
Data Sources, Market Sizing, and Validation
Desk Research
Desk work started with mapping the region's base oil supply chain and the "rules of the road" for reporting, so definitions stay consistent across countries. Public sources were used to anchor the model, such as UN Comtrade trade statistics, national refinery and fuels statistics from energy ministries, customs and port authority releases, and publications from lubricant and petroleum industry associations.
To sharpen the inputs, we also reviewed company annual reports, investor presentations, and refinery project announcements to track capacity changes and operating trends. In a few places, subscribed datasets were used for company financials and intelligence, import and export shipment visibility, and patent lookups to support validation of supply additions and grade transitions. The desk sources listed here are illustrative only, and many other public documents were used to collect, cross-check, and clarify specific data points.
Primary Interviews and Surveys
Primary conversations were used to pressure-test the supply-demand picture, especially where public data is delayed or reported in mixed units. We spoke with a balanced set of stakeholders (refiners, distributors, blenders, and large lubricant buyers) across APAC, so assumptions on grade mix, trade flows, and utilization could be adjusted to what is seen in day-to-day transactions.
Distribution of primary research fieldwork respondents
| Company type | Respondent position |
|---|---|
| Top tier: 35% | CXOs: 14% |
| Mid tier: 47% | Functional/Unit leaders: 26% |
| Smaller Players: 18% | Managers: 60% |
Market-Sizing & Forecasting
Sizing was built using a top-down method where production, trade, and apparent consumption signals are reconstructed for the region, and then converted into a single ton-based view. The totals were subsequently checked with selective bottom-up approximations, such as rolling up a sample of supplier sales ranges, distributor channel checks, and typical contract volumes for major lubricant applications.
Key inputs included regional refinery base oil capacity and announced upgrades, estimated operating rates, net imports and exports by base stock related codes, and the shifting mix from Group I toward higher quality grades driven by emissions and lubricant specifications. We also tracked lubricant demand proxies like vehicle parc growth, industrial output trends, and drain interval changes, since these determine how much base oil is needed even when end-use volumes grow slowly.
Forecasts were developed using scenario analysis, where the supply side (capacity and utilization) and demand side (lubricant activity and quality shifts) were stressed under realistic cases agreed during expert calls. When bottom-up checks had gaps, we used conservative ranges and applied consistency rules on trade balance and grade yield so the final path stayed repeatable and was not over-fitted.
Data Validation & Update Cycle
Outputs were validated through triangulation across independent signals, including capacity additions, trade direction changes, and known lubricant activity indicators in large economies. Any sharp jumps were flagged, and the underlying drivers were rechecked before sign-off, including unit conversions, currency timing (where used for context), and double counting risks between domestic output and imports.
Each report is refreshed annually, and we also revisit the model when material events occur, such as major refinery turnarounds, new hydrocracker start-ups, or policy shifts that change grade demand. Before delivery, a final review pass is completed so clients receive the latest updated view aligned to the same definitions and checks.
Mordor Intelligence's Asia Pacific Base Oil Market Size Compared With Other Published Estimates
Published market sizes for Asia Pacific base oil can look far apart because the same topic is often measured in different units and with different product boundaries. Some studies report value in USD using price assumptions, and others report volume in tons, which naturally changes what "growth" means.
A common scope expansion is to fold in finished lubricants, additive value, or broader petroleum product baskets to reach a revenue figure that is easier to headline. The split is simple: those broader estimates lean on blended pricing and wider product inclusion, then our volume model stays limited to base stocks only and is refreshed using capacity, utilization, and trade checks that keep the tonnage consistent, as done by Mordor Intelligence.
Benchmark comparison
| Source | Market Size | Gaps in Research Methodology |
|---|---|---|
| Mordor Intelligence | USD 17.42 M (2025) | |
| Regional Consultancy A | USD 24.45 B (2026) | Reported in USD and likely includes broader lubricant value pools and blended pricing assumptions, which makes it hard to reconcile to base oil tonnage and grade mix. |
| Trade Journal B | USD 44.20 B (2025) | Uses a high level revenue view with limited disclosure on included product types and price decks, so adjacent categories and aggressive ASP progression can inflate totals versus base-stock only sizing. |
The spread across the table mainly comes down to unit choice and what is counted inside the market. When the definition is kept to base stocks and the checks are tied to production capacity, utilization, and net trade, the final market size becomes easier to trace and repeat year after year.
Key Questions Answered in the Report
What is the projected volume of the Asia Pacific Base Oil market in 2031?
The market is forecast to reach 19.49 million tons by 2031, growing at a 1.89% CAGR from 2026.
Which base-oil type is expanding fastest in the Asia-Pacific?
Group III leads growth at a 3.30% CAGR through 2031, boosted by OEM demand for high-viscosity-index stocks.
Why are Group I stocks losing share in the region?
Tightening emission norms in China and India mandate low-sulfur formulations that Group I cannot meet, pushing demand toward Group II and Group III grades.
How is EV adoption affecting lubricant demand?
Battery-electric vehicles need 70% less lubricant than ICE models, cutting long-term engine-oil volumes, especially in China, where EV penetration hit 35% of sales in 2024.
Which country shows the fastest base-oil demand growth?
India leads with a projected 2.98% CAGR through 2031, supported by refinery upgrades and vehicle-fleet expansion.
What role do re-refined base oils play in the Asia-Pacific?
Re-refined oils remain below 5% of supply but are gaining traction under circular-economy mandates in China, Singapore, and India, despite quality-perception challenges.