
Market Overview
| Study Period | 2020 - 2031 |
|---|---|
| Forecast Data Period | 2026 - 2031 |
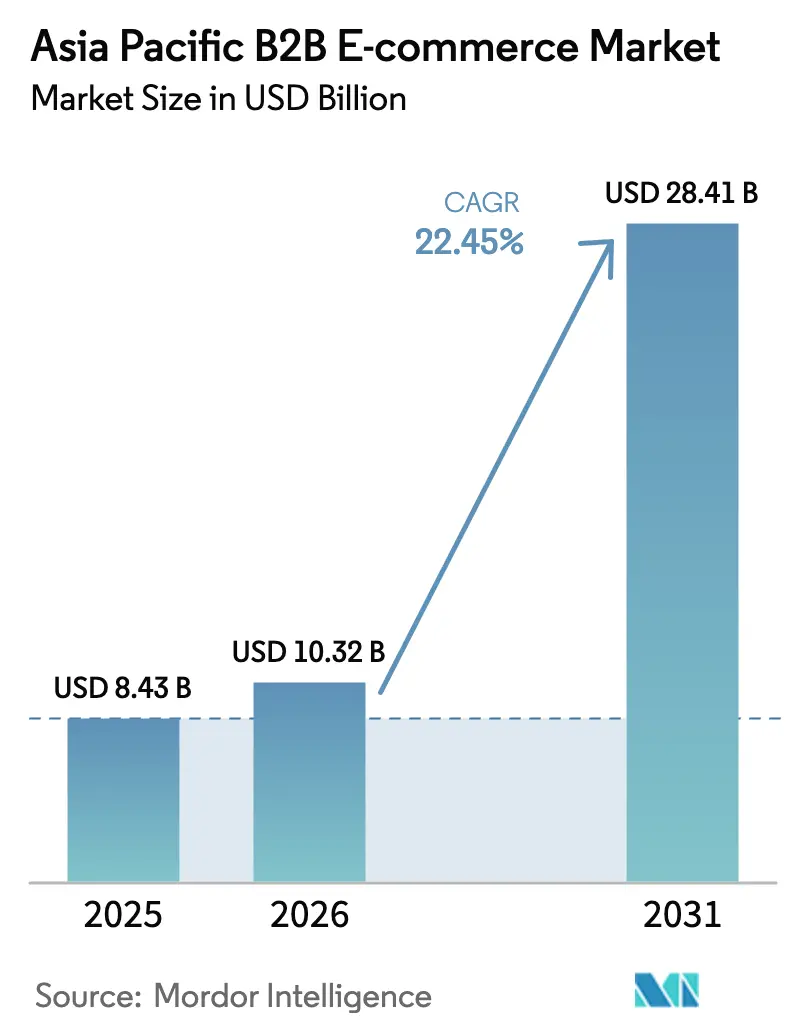
| Base Year Market Size (2025) | USD 8.43 Billion |
| Market Size (2026) | USD 10.32 Billion |
| Market Size (2031) | USD 28.41 Billion |
| Growth Rate (2026 - 2031) | 22.45 % |
| Market Concentration | Medium |
Major Players *Disclaimer: Major Players sorted in no particular order Image © Mordor Intelligence. Reuse requires attribution under CC BY 4.0. | |
Asia Pacific B2B E-commerce Market Analysis by Mordor Intelligence
Asia-Pacific B2B e-commerce market size in 2026 is estimated at USD 10.32 billion, growing from 2025 value of USD 8.43 billion with 2031 projections showing USD 28.41 billion, growing at 22.45% CAGR over 2026-2031. This rapid expansion reflects an irreversible pivot by enterprise buyers toward digital procurement and payment flows, supported by embedded-finance rails that unlock USD 242 billion of fresh working-capital capacity for small and medium enterprises (SMEs). Digitization momentum is further amplified by mandatory e-invoicing regimes across several economies, fiber-to-factory connectivity breakthroughs, and rising pressures to de-risk supply chains after pandemic-era disruptions. As corporations chase cost savings and cycle-time reductions, digital marketplaces are evolving into platforms that meld procurement, financing, and logistics-all in real time. Nevertheless, structural frictions around tax compliance, cross-border documentation, and payment-trust gaps in Tier-2/3 cities temper the market’s otherwise steep growth curve.
Key Report Takeaways
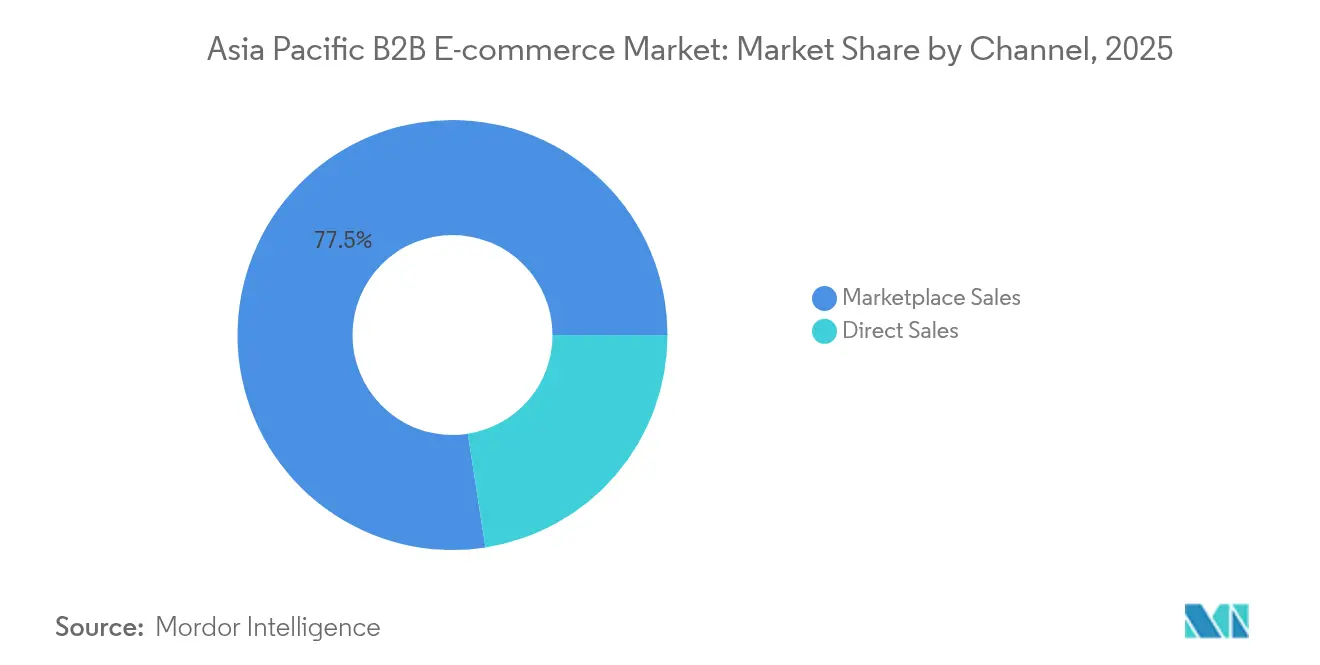
- By channel, marketplace sales accounted for 77.45% of the Asia-Pacific B2B e-commerce market share in 2025, while direct sales channels are advancing at a 24.8% CAGR through 2031.
- By transaction model, domestic orders controlled 69.20% of the Asia-Pacific B2B e-commerce market size in 2025; cross-border flows are expanding at 26.1% CAGR to 2031.
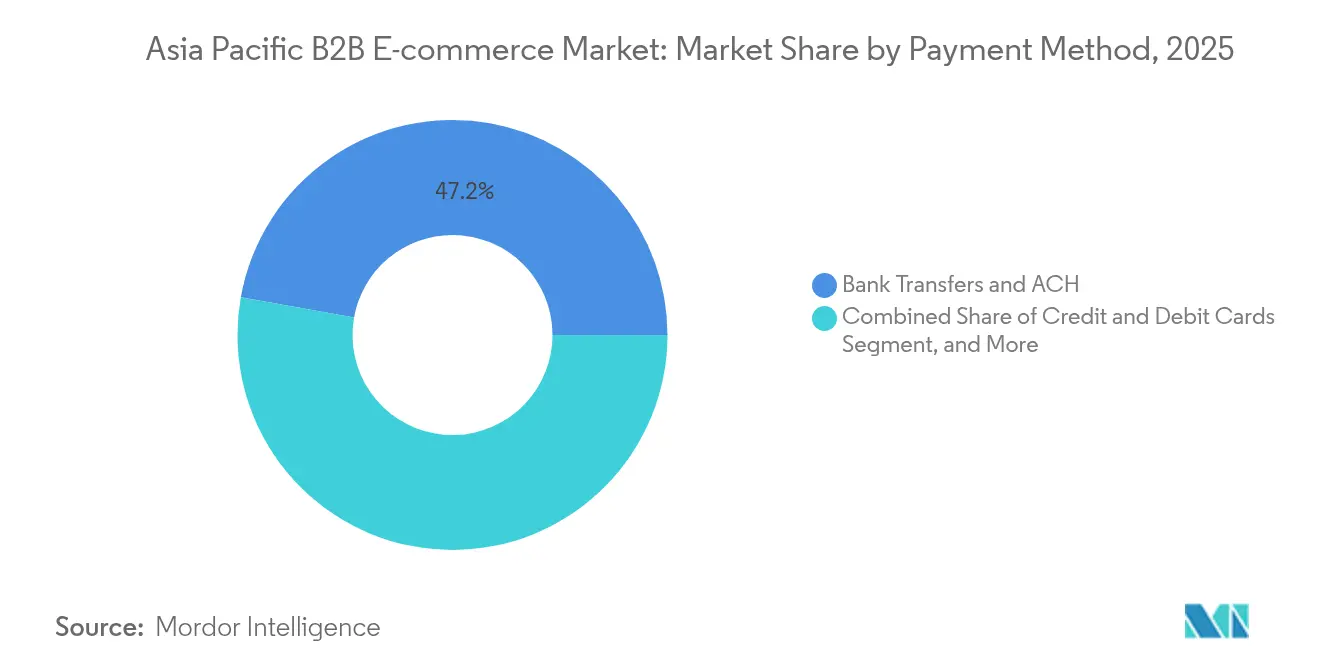
- By payment method, bank transfers held 47.20% of the Asia-Pacific B2B e-commerce market size in 2025; e-wallets, BNPL, and embedded-finance options are the fastest-rising cluster at 23.9% CAGR.
- By industry vertical, manufacturing led with 27.40% Asia-Pacific B2B e-commerce market share in 2025, whereas healthcare and life sciences will post the strongest 26.9% CAGR to 2031.
- By country, China dominated with 61.10% Asia-Pacific B2B e-commerce market share in 2025; India is forecast to post a 24.7% CAGR and emerge as the principal share-gainer by 2031.
Note: Market size and forecast figures in this report are generated using Mordor Intelligence’s proprietary estimation framework, updated with the latest available data and insights as of 2026.
Asia Pacific B2B E-commerce Market Trends and Insights
Drivers Impact Analysis*
| Driver | (~) % Impact on CAGR Forecast | Geographic Relevance | Impact Timeline |
|---|---|---|---|
| Digital procurement adoption among APAC manufacturing SMEs | +3.8% | China, India, Southeast Asia manufacturing hubs | Medium term (2-4 years) |
| Government-led e-invoicing mandates (PEPPOL, GST) | +2.9% | Singapore, Australia, Japan, India | Short term (≤ 2 years) |
| 5G & fiber roll-out enabling real-time marketplaces | +2.4% | South Korea, Japan, urban China, Singapore | Medium term (2-4 years) |
| Embedded finance APIs de-risking B2B credit | +3.1% | India, Southeast Asia, emerging APAC markets | Long term (≥ 4 years) |
| Sustainability-driven paperless procurement targets | +1.6% | Japan, Australia, multinational corporations | Long term (≥ 4 years) |
| Source: Mordor Intelligence | |||
Digital procurement adoption among APAC manufacturing SMEs
Manufacturing SMEs are abandoning manual requisition and phone-based ordering workflows as raw-material price volatility averaged 15-20% during 2024, forcing tighter spend controls. Vendors such as ProcMart lifted revenue from INR 2.2 billion (USD 0.026 billion) to INR 6.2 billion (USD 0.072 billion) in FY 2024 by delivering catalog search, spend analytics, and dynamic contract updates that trim purchase-order cycle times by up to 60%. While Tier-1 industrial corridors digitize at speed, penetration lags in Tier-2/3 districts where relationship-based buying remains entrenched.
Government-led e-invoicing mandates drive market acceleration
Singapore’s nationwide PEPPOL network processed 1.2 million invoices from 50,000 firms by 2024, turning compliance into a catalyst for platform onboarding. India’s GST e-invoicing clauses create a similar domino effect, pushing even micro-enterprises onto digital rails to remain eligible suppliers. Interoperable frameworks under the coming ASEAN.[1]Asia-Pacific Economic Cooperation, “Paperless Trade Platforms in the Post-COVID-19 Era,” apec.org Digital Economy Framework Agreement aim at USD 1 trillion digital-economy value by 2030, with e-invoicing interoperability as a pillar. Network externalities will intensify as large buyers refuse non-compliant paper invoices.
5G infrastructure enables real-time marketplace dynamics
Ultra-low latency 5G networks are transforming B2B marketplaces from static catalog platforms into dynamic pricing environments that mirror financial trading systems. South Korea's advanced 5G deployment enables real-time inventory visibility across supply chains, allowing manufacturers to adjust procurement strategies based on live supplier capacity data.[2]GSMA, “Mobile Economy Asia-Pacific 2023,” gsma.com This technological capability is particularly valuable for just-in-time manufacturing models where procurement timing directly impacts production efficiency. Real-time marketplaces also enable sophisticated auction mechanisms for commodity procurement, where suppliers can bid dynamically based on current capacity and input costs. The infrastructure investment is substantial, with mobile operators across APAC investing heavily to support 5G coverage that will account for 41% of total mobile connections by 2030. However, the B2B applications extend beyond connectivity to encompass IoT-enabled supply chain monitoring and automated procurement triggers based on inventory sensors.
Embedded finance APIs democratize B2B credit access
Real-time transaction scoring allows marketplaces to extend instant net-30 or net-60 terms without bearing direct credit exposure. HSBC’s API ties into platform checkout flows so that trade-finance limits auto-populate at cart confirmation, shrinking paperwork from weeks to minutes. The democratization is most visible in Southeast Asia, where mobile-first fintech uptake is projected to pass 60% by 2030.
Restraints Impact Analysis*
| Restraint | (~) % Impact on CAGR Forecast | Geographic Relevance | Impact Timeline |
|---|---|---|---|
| Fragmented ASEAN tax & import compliance | -2.1% | ASEAN member states, cross-border operations | Medium term (2-4 years) |
| Low digital-payment trust in Tier-2/3 markets | -1.7% | Rural India, Indonesia, Philippines, Vietnam | Short term (≤ 2 years) |
| High logistics cost for bulky MRO goods | -1.4% | Industrial manufacturing regions, remote areas | Medium term (2-4 years) |
| Vendor lock-in concerns among Japanese conglomerates | -0.9% | Japan, South Korea enterprise markets | Long term (≥ 4 years) |
| Source: Mordor Intelligence | |||
Fragmented ASEAN tax and import compliance creates operational friction
Each ASEAN jurisdiction runs independent VAT rules, e-services levies, and invoice-clearance models. Marketplaces must embed jurisdiction-specific logic, inflating overheads and delaying vendor onboarding. Indonesia insists on real-time tax clearance for every invoice, whereas Singapore’s PEPPOL flow stays voluntary, forcing platforms to juggle two integration tracks. These disparities blunt the scale economies that typically accelerate network-effect growth.
Digital-payment trust deficits constrain Tier-2/3 market penetration
Procurement officers in rural districts still regard online escrow or wallet mechanisms as risky, preferring bank transfers or cash-on-delivery even for high-value B2B orders. Limited recourse options if disputes arise reinforce this caution. Research on Southeast Asian SMEs reveals that such trust gaps curb marketplace usage despite smartphone penetration approaching 80%. Platforms respond with localized field-sales teams and deferred-payment guarantees, but uptake remains slower outside metro areas.
*Our forecasts treat driver/restraint impacts as directional, not additive. The impact forecasts reflect baseline growth, mix effects, and variable interactions.
Segment Analysis
By Channel: Marketplace Dominance Faces Direct-Sales Disruption
Marketplace sales controlled 77.45% of the Asia-Pacific B2B e-commerce market in 2025, a legacy of buyer dependence on aggregated supplier directories. Direct-sales portals, however, are accelerating at 24.8% CAGR as procurement leaders pursue deeper integration with ERP and logistics systems. Large manufacturers launch private portals that permit granular price negotiations, minimizing marketplace fees and data leakage.
The shift also reflects embedded-finance adoption within supplier-managed storefronts, enabling flexible settlement terms identical to marketplace offerings without ceding margin. While discovery remains easier on horizontal marketplaces, strategic items with recurring volumes increasingly migrate to direct rails for tighter quality control. Over the forecast horizon, marketplaces will likely pivot toward value-added financing and fulfillment services to defend relevance.


By Transaction Model: Cross-Border Growth Outpaces Domestic Expansion
Domestic orders still account for 69.20% of the Asia-Pacific B2B e-commerce market size in 2025, but cross-border flows will rise faster at 26.1% CAGR, encouraged by tariff concessions under the Regional Comprehensive Economic Partnership. Paperless trade protocols now shave 3.8% off administrative costs per shipment and cut border-clearance time by 6.7%.
Currency-hedging tools and automated duty calculators embedded within platforms lower the operational barrier for SMEs to sell regionally. Nevertheless, multidimensional compliance across VAT, import licensing, and data-localization laws remains burdensome, particularly for micro-exporters lacking legal resources. Thus, service providers offering bundled customs brokerage and tax-filing APIs stand to capture incremental revenue.
By Payment Method: Digital Wallets Reshape B2B Transaction
Traditional bank transfers and automated clearing house rails preserved a 47.20% share of the Asia-Pacific B2B e-commerce market in 2025 thanks to audit-trail familiarity and bank-ledger integration. Yet e-wallets, BNPL, and invoice-financing options will compound at 23.9% CAGR through 2031, mirroring consumer-grade expectations among millennial procurement managers. Real-time fraud engines and ISO 20022 messaging improve reconciliation accuracy, nudging CFOs to embrace wallet-based flows for mid-ticket purchases.
Bank-sponsored virtual-account solutions bridge the trust gap by combining wallet UX with traditional bank safeguards. Regulatory ambiguity over cross-border e-money passports still limits volume in conservative sectors such as defense or public procurement, but fintech sandboxes across Hong Kong, Singapore, and Australia are progressively clarifying licensing paths.
By Industry Vertical: Manufacturing Leadership Challenged by Healthcare Acceleration
Manufacturing maintained 27.40% Asia-Pacific B2B e-commerce market share in 2025 on the back of electronics, machinery, and automotive procurement complexity. Multi-tier BOM structures and frequent engineering changes make digital cataloging a necessity, which platforms like Zetwerk address through CAD-file matching and supplier qualification engines.
Healthcare and life sciences, however, will expand at 26.9% CAGR as regulators demand end-to-end traceability for devices, reagents, and pharmaceuticals. Digital platforms provide serialized tracking, temperature-controlled logistics visibility, and compliance documentation that manual workflows cannot match. Investment flows into med-tech hubs in Singapore and South Korea are catalyzing specialized B2B portals focusing on lab consumables and clinical-trial supplies.
Geography Analysis
China’s leadership stems from policy-driven digitization that integrated industrial parks with cross-border e-commerce channels and customs fast lanes. The Belt and Road Initiative broadens its supplier reach across Central and South Asia, reinforcing platform scale advantages. Heightened geopolitical scrutiny triggers supply-chain diversification, yet domestic consumption upgrades and enterprise procurement automation preserve double-digit growth.
India’s trajectory is propelled by policy nudges like compulsory GST e-invoicing, statewide fiber penetration, and the open-network movement that encourages interoperable digital commerce. SME onboarding accelerates as low-cost smartphones and vernacular interfaces lower entry barriers. The confluence of demographic dividend and manufacturing formalization will shift regional share to India by the end of the decade.
Japan, South Korea, Australia, and New Zealand represent mature nodes where penetration already hovers around 40-50%. Here, incremental growth derives from AI-driven demand forecasting, IoT-sourced automatic replenishment, and ESG-linked procurement scorecards. Meanwhile, the Rest of Asia–Pacific, particularly Indonesia, Vietnam, and the Philippines, provides the next wave of volume as regulatory frameworks approach convergence under the ASEAN Digital Economy Framework Agreement.
Regulatory Landscape
Asia-Pacific B2B e-commerce regulation is being shaped by digital-trade compliance, invoicing mandates, and platform-accountability rules that influence onboarding and cross-border selling. A notable recent anchor is Indonesia's Ministry of Trade Regulation No. 19 of 2026, effective June 8, 2026, which replaced Regulation No. 31/2023 and broadened obligations for trade through electronic systems, raising expectations around platform accountability and governance.
On cross-border enablement, the RCEP Digital Trade Working Group adopted a B2B Official Website Trustmark Certification Framework on May 12, 2026, adding a formal compliance signal that can affect exporter visibility on procurement platforms. Across ASEAN, uneven implementation of data protection, AML/CFT, and data-localization requirements continues to increase compliance costs and fragment go-to-market approaches for regional marketplace operators and direct-sales portals.
Value Chain Analysis
The B2B e-commerce value chain in Asia-Pacific spans supplier digitization (catalog and compliance data), marketplace or direct portal enablement (search, procurement workflow, and ERP integrations), payment and credit rails (bank transfers, e-wallets, and embedded finance), and fulfillment or logistics, with after-sales workflows (returns, warranty, and dispute management) increasingly integrated into the same platforms. Mandatory and voluntary e-invoicing networks, including PEPPOL-aligned ecosystems highlighted in the report context, act as a data layer that standardizes invoices and accelerates supplier onboarding into platform-based procurement.
Value capture is shifting toward orchestration layers that unify compliance, financing, and workflow automation. The RCEP B2B trustmark framework adds an external certification step that feeds into discovery and ranking logic on procurement platforms, making third-party verification and audit-readiness a new service line for ecosystem partners. In parallel, large platforms are embedding AI-native agents into sourcing and post-purchase operations, and integrating invoicing and tax-exemption workflows (including GST-linked flows in India) to reduce procurement friction for enterprise buyers and SMEs.
Competitive Landscape
Regional fragmentation characterizes the Asia-Pacific B2B e-commerce market. Alibaba’s 1688.com and Made-in-China.com dominate mainland flows, leveraging vertically integrated logistics and domestic financing instruments. IndiaMART and Zetwerk anchor the Indian sphere with deep roots in manufacturing clusters and localized compliance know-how. In Japan and South Korea, incumbents differentiate via high-fidelity data exchange and integration toolkits demanded by keiretsu and chaebol procurement teams.
Strategic competition is shifting from simple catalog breadth toward end-to-end workflow orchestration. Players invest in embedded-finance APIs, cross-border duty calculators, and AI-driven sourcing engines that suggest optimal suppliers based on lead-time volatility. Platform-native logistics capacity and ESG score-tracking modules are emerging as new battlegrounds.
Market-wide consolidation remains moderate because ASEAN tax heterogeneity erects natural borders. Yet capital-rich platforms pursue bolt-on acquisitions in niche verticals such as healthcare consumables or construction materials to gain specialized compliance capabilities. Successful acquirers are expected to merge disparate data silos, unlocking unified dashboards that underpin regional procurement centers of excellence.
Asia Pacific B2B E-commerce Industry Leaders
Alibaba Group Holding Ltd
Amazon.com, Inc.
Flipkart Online Services Pvt. Ltd.
IndiaMart InterMesh Ltd
eBay Inc.
- *Disclaimer: Major Players sorted in no particular order


Market Opportunities and Future Outlook
A key whitespace is enterprise-grade automation that turns marketplaces and direct portals into workflow systems of record, covering sourcing, negotiation support, content creation, and post-order service. Alibaba has been commercializing AI-led infrastructure and tools that support this shift, with Alibaba Cloud reporting 40% external revenue growth in Q4 fiscal 2026 and AI products accounting for 30% of that external revenue in the same period, alongside launches such as the Wukong AI-native enterprise agent platform and Accio Work for SMEs.
Seller-side productivity and embedded value (financing, compliance, and catalog normalization) also offer a near-term lever to lower the cost-to-serve for fragmented SMEs across India and Southeast Asia. Amazon Business reported reaching USD 60 billion in annualized gross sales by Q2 2026 with more than 11 million global organizational customers, and it also cited over INR 2,000 crore in financial value enabled for Indian businesses in 2025, pointing to monetizable demand for procurement controls, credit facilitation, and compliant buying experiences. Infrastructure investment aimed at cloud and AI capacity, including Amazon's planned investments in Southeast Asia cloud and AI infrastructure totaling over USD 33 billion by 2039, supports higher-frequency, API-driven procurement experiences and tighter integration with ERP and payments ecosystems.
Recent Industry Developments
- July 2026: Expanded Zero Commission across the entire fashion category for approximately 90,000 transacting sellers, including MSMEs and D2C brands. The expansion strengthens marketplace appeal for sellers and broadens the addressable GMV in a high velocity category. This move enhances APAC B2B e-commerce dynamics by reducing costs for sellers.
- June 2026: Amazon India launched a free AI-powered Seller Assistant tool built on Amazon Bedrock for MSMEs. The tool improves seller productivity and listing quality, potentially increasing self-serve onboarding and transaction velocity. The initiative signals a deeper integration of AI into the APAC B2B ecosystem.
- June 2026: IndiaMART InterMESH Limited approved the incorporation of a new wholly-owned subsidiary, IndiaMART Finance Limited, to provide financial and credit facilitation solutions to MSMEs. Deepens MSME financing options within the ecosystem, enhancing seller liquidity and platform stickiness. The move expands the financial services layer within APAC B2B e-commerce.


Research Methodology Framework and Report Scope
Market Definition and Coverage
This market covers the value of business-to-business trade that is completed through digital commerce channels across Asia-Pacific, including direct supplier portals and marketplace-led transactions, and it reflects the value of transactions executed online.
Scope exclusions: We exclude consumer-facing (B2C) online retail, plus non-commerce enablement revenues such as standalone software subscriptions, advertising, and logistics services billed outside the transaction value.
Segmentation Overview
- By Channel
- Direct Sales
- Marketplace Sales
- By Transaction Model
- Domestic
- Cross-border
- By Payment Method
- Bank Transfers and ACH
- Credit and Debit Cards
- Other Payment Methods
- By Industry Vertical
- Manufacturing
- Retail and Wholesale
- Healthcare and Life Sciences
- Automotive
- Construction and Building Materials
- Other Industry Verticals
- By Country
- China
- Japan
- India
- South Korea
- Australia and New Zealand
- Rest of Asia-Pacific
Data Sources, Market Sizing, and Validation
Desk Research
Desk work starts by grounding the model in trusted, public indicators that reflect digital trade readiness and enterprise buying behavior across Asia-Pacific. We typically review materials such as UN Comtrade trade statistics, World Bank and IMF macro series, OECD and APEC digital trade publications, and WTO notes on cross-border commerce rules, which help us keep country coverage consistent.
After that, we layer in directional signals from sources like national statistics offices, central bank payments reports, customs portals, and public procurement and e-invoicing guidance where available. Company annual reports, exchange filings, investor decks, and reputable press are also read to understand shifts in channel mix (direct vs marketplace) and cross-border expansion patterns. In some cases, paid subscriptions for company financials, patent lookups, and shipment-level trade checks are used to validate inputs that are not fully visible in public data. These desk sources are illustrative, and many other references are consulted for data collection, validation, and clarification.
Primary Interviews and Surveys
We use expert interviews and surveys with marketplace operators, procurement leaders, payment specialists, logistics providers, and business buyers across Asia-Pacific. Respondents help clarify online order value, channel use, payment choice, supplier onboarding, and country-level assumptions. We compare unusual responses with desk evidence before adjusting the model.
Distribution of primary research fieldwork respondents
| Company type | Respondent position |
|---|---|
| Top tier: 30% | CXOs: 15% |
| Mid tier: 50% | Functional/Unit leaders: 35% |
| Smaller Players: 20% | Managers: 50% |
Market-Sizing & Forecasting
Sizing begins with a top-down build that reconstructs the addressable online B2B trade pool by country using macro and trade anchors, and then it is filtered through digital adoption and channel participation rates. To keep the numbers realistic, we corroborate the outcome with selective bottom-up approximations, such as sampled GMV-per-active-buyer ranges, order-frequency checks, and channel mix splits for direct portals versus marketplaces.
Inputs that commonly move the model include cross-border trade intensity, e-invoicing and e-documentation rollout, digital payments penetration for businesses, broadband and mobile internet reliability, and procurement digitization by key verticals. Where a data series is missing for a country, the gap is handled by using proxy indicators from similar economies and then refining them through interview-based ranges, before the totals are re-checked for plausibility.
Forecasting is primarily done through scenario analysis supported by variable-level expectations gathered in interviews, since policy changes and platform adoption can shift faster than long-run averages. We run a base case plus tighter and faster adoption cases, and then reconcile the final path with observed trade and digital commerce signals so the forecast does not drift from real demand drivers.
Data Validation & Update Cycle
Validation is done through a multi-step review where outputs are checked against independent signals, and abnormal jumps are investigated before sign-off. We compare implied online trade shares, country totals, and growth paths against macro constraints, trade flows, and adoption markers, and we also re-check large variances that show up at the country or channel level.
If interview feedback conflicts with the desk model, we re-contact sources to confirm what changed, such as policy timing, cross-border documentation friction, or buyer onboarding pace. Reports are refreshed annually, and interim updates are triggered when material events occur that can change adoption or transaction flow assumptions. Before delivery, a final pass is completed so clients receive the latest updated view.
Mordor Intelligence's Asia Pacific B2b Ecommerce Market Estimate Compared With Other Published Estimates
Published market sizes for Asia-Pacific B2B e-commerce can look far apart because the measurement unit is not always the same, and the border between GMV, platform revenue, and enabled trade is often handled differently. Currency timing, country coverage, and whether cross-border trades are counted at buyer location or seller location also create visible gaps.
The table highlights that the spread mostly comes from scope and what is treated as a completed online transaction, along with how fast adoption is assumed to rise in manufacturing-heavy economies. Some estimates blend in broader digital trade and services, or they apply aggressive penetration curves without checking them against trade intensity and procurement behavior by industry.
Benchmark comparison
| Source | Market Size | Gaps in Research Methodology |
|---|---|---|
| Mordor Intelligence | USD 8.43 B (2025) | |
| Trade Journal A | USD 12.10 B (2025) | Often presented as broader digital trade value, where adjacent services and partially online orders can be included, which lifts the counted pool versus completed online B2B transactions. |
| Regional Consultancy B | USD 9.60 B (2025) | Typically uses a narrower country set and applies conservative adoption rates for cross-border workflows, which can reduce the estimate when smaller APAC markets are underweighted. |
The table shows a wide range, and in Mordor Intelligence's model the value is counted only when the transaction is executed through a B2B e-commerce channel, rather than including offline-settled trade that was only influenced by digital tools. With clear scope rules, practical proxies for missing data, and interview-led checks on adoption and order behavior, the outcome stays traceable to inputs that can be repeated and reviewed.


Key Questions Answered in the Report
How large is the Asia-Pacific B2B e-commerce market today?
The market is valued at USD 10.32 billion in 2026 and is tracking toward USD 28.41 billion by 2031, implying a 22.45% CAGR.
Which country contributes most to regional B2B e-commerce revenue?
China holds 61.10% of regional revenue owing to government-backed digitization and well-developed logistics corridors.
What is the fastest-growing segment within the market?
Cross-border transactions show the highest momentum at a 26.1% CAGR as RCEP tariff reductions and paperless trade standards take hold.
Why are embedded-finance tools critical to B2B platforms?
They enable real-time credit decisions, extend supplier payment terms, and unlock an estimated USD 242 billion in SME working-capital opportunity.
What are the key regulatory accelerators for adoption?
Mandatory e-invoicing frameworks such as PEPPOL and India’s GST network push suppliers to digitize invoices, driving broader platform onboarding.
Where do trust gaps still limit digital B2B payments?
Tier-2 and Tier-3 cities in India, Indonesia, and the Philippines show persistent skepticism of wallet-based payments, slowing adoption relative to metro areas.
Page last updated on:


 Your data is secure and never sold or shared.


