
Market Overview
| Study Period | 2019 - 2031 |
|---|---|
| Forecast Data Period | 2026 - 2031 |
| Historical Data Period | 2019 - 2024 |
| Market Size (2026) | USD 4.85 Billion |
| Market Size (2031) | USD 5.93 Billion |
| Growth Rate (2026 - 2031) | 4.08 % |
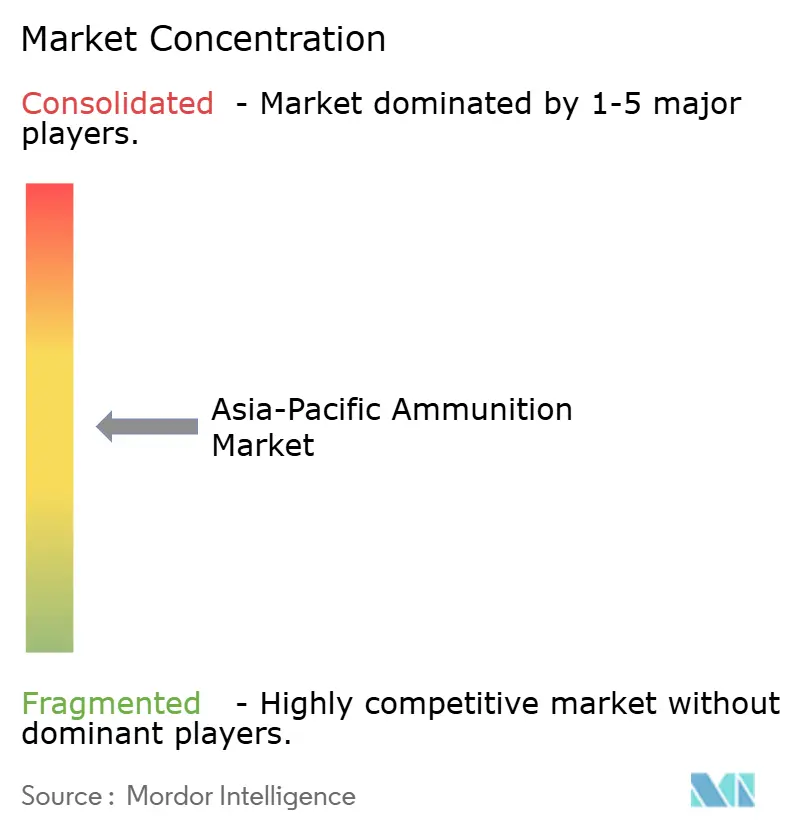
| Market Concentration | Medium |
Major Players *Disclaimer: Major Players sorted in no particular order Image © Mordor Intelligence. Reuse requires attribution under CC BY 4.0. | |
Asia-Pacific Ammunition Market Analysis by Mordor Intelligence
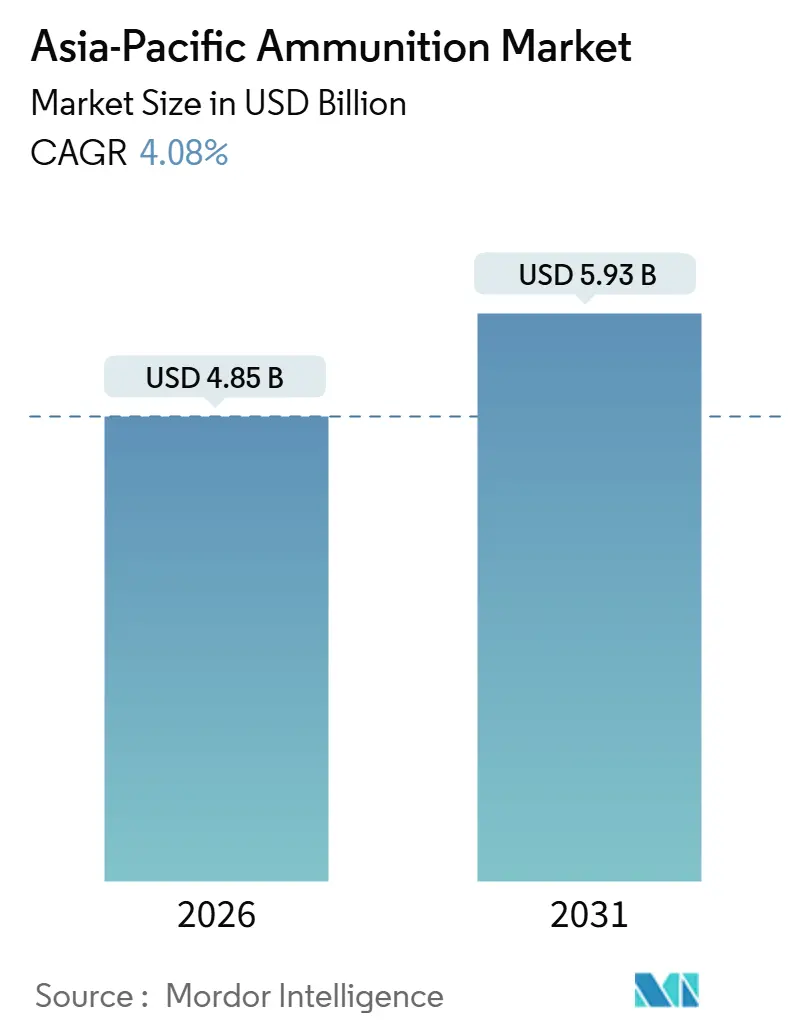
The Asia-Pacific ammunition market size reached USD 4.85 billion in 2026 and is projected to climb to USD 5.93 billion by 2031, advancing at a 4.08% CAGR over the forecast period. Growth is anchored in steady defense-budget expansion, widening indigenous production, and the gradual shift toward precision-guided rounds that lift unit values while tempering overall volume growth. China still commands half of regional demand, but India’s self-reliance drive and rising private-sector output are beginning to redistribute orders toward South and Southeast Asia. Program spending in Japan, South Korea, and Australia is focusing on long-range strike and lethality upgrades, underpinning demand for larger caliber and smart munitions. Meanwhile, the civilian, law enforcement, and private security segments create supplemental demand for small-caliber cartridges, although regulatory fragmentation keeps this channel fragmented.
Key Report Takeaways
- By caliber, small caliber ammunition accounted for 57.74% in 2025, while large caliber rounds are forecasted to record the fastest 5.16% CAGR through 2031.
- By product, bullets and cartridges led the category with a 62.67% share in 2025 and are projected to advance at a 4.98% CAGR through 2031.
- By guidance, unguided munitions retained a 90.38% share in 2025; guided variants are expanding at a 5.62% CAGR as precision-strike doctrines mature.
- By end-user, the military segment accounted for 72.26% of shipments in 2025, and this segment also posted the strongest growth rate of 5.78% from 2026 to 2031.
- By platform, land platforms accounted for 64.89% of 2025 demand and are growing at a 6.04% CAGR, outpacing the naval and airborne categories.
- By geography, China captured 50.35% of the Asia-Pacific ammunition market share in 2025, whereas India is the fastest-growing geography, with a 5.28% CAGR from 2026 to 2031.
Note: Market size and forecast figures in this report are generated using Mordor Intelligence’s proprietary estimation framework, updated with the latest available data and insights as of January 2026.
Asia-Pacific Ammunition Market Trends and Insights
Drivers Impact Analysis*
| Driver | (~) % Impact on CAGR Forecast | Geographic Relevance | Impact Timeline |
|---|---|---|---|
| Rising defense budgets across Asia-Pacific region | +1.2% | Japan, South Korea, Australia | Medium term (2-4 years) |
| Modernization programs demanding advanced calibers and smart munitions | +0.9% | India, China, South Korea, Australia | Long term (≥ 4 years) |
| Expansion of regional manufacturing capacity and self-reliance initiatives | +0.7% | India, Indonesia, Thailand, Philippines | Medium term (2-4 years) |
| Civilian and law-enforcement surge in sporting/self-defense ammo | +0.4% | Core APAC, Southeast Asia | Short term (≤ 2 years) |
| Growth in private military/security companies needing tailored logistics | +0.3% | Singapore hubs, Gulf-linked Asia-Pacific operations | Medium term (2-4 years) |
| Shift to green/lead-free rounds under stricter environmental rules | +0.2% | Australia, Japan, South Korea | Long term (≥ 4 years) |
| Source: Mordor Intelligence | |||
Rising Defense Budgets Across Asia-Pacific Nations
China increased its 2024 defense allocation by 7.2%, allocating fresh funds to replenish Rocket Force stockpiles and extend-range artillery ammunition. Japan set a record budget of JPY 8.9 trillion for fiscal 2024, prioritizing counter-strike inventories, such as 155 mm shells and Type 12 missile warheads. South Korea maintained a 4-5% annual growth rate and relied on K2 tank and K9 howitzer ammunition to fuel export-scale production, which reduced unit costs for domestic forces. India earmarked USD 130 billion over five years to lift ammunition war reserves from 10 to 30 combat days, a target that is already reshaping supplier rosters. Australia allocated AUD 4 billion (USD 2.67 billion) to the Guided Weapons and Explosive Ordnance Enterprise, securing sovereign production and reducing reliance on trans-Pacific supply chains.
Modernization Programs Demanding Advanced Calibers and Smart Munitions
India’s 155 mm overhaul is replacing 105 mm and 130 mm guns, creating recurring demand for 40,000 rounds a month and pulling private newcomers into a traditionally state-run niche. South Korea’s Cheongeom fire-and-forget missile underscores the region’s pivot away from unguided recoilless rifles toward precision anti-armor effects.[1] Japan extended the range of its Type 12 surface-to-ship missile beyond 1,000 km, prompting the development of new propellant and guidance electronics lines. Australia’s LAND 400 Phase 3 calls for 30 mm airburst rounds to equip its next-generation infantry fighting vehicles (IFVs), forcing suppliers to integrate programmable fuzes at scale. The Philippines’ Horizon 2 modernization, valued at PHP 35 billion, converts Vietnam-era howitzers to 155 mm platforms and associated smart projectiles.
Expansion of Regional Manufacturing Capacity and Self-Reliance Initiatives
Private-sector firms now account for 40% of Indian output, ramping 155 mm annual capacity to 100,000 shells and lifting the Asia-Pacific ammunition market’s local content ratio. Thailand opened a 5.56 mm NATO plant in early 2024, targeting 50 million rounds per year for ASEAN buyers. Indonesia’s PT Pindad, backed by European technology transfer, expanded its 81 mm mortar lines by 30% to meet both domestic and export orders. Rheinmetall’s Queensland facility began producing 155 mm artillery shells in late 2024, with phase-one output reaching 15,000 rounds by 2026. The Philippines and South Korea’s Poongsan have started building a brass-case plant, slated for completion in 2026, closing a critical input gap.
Civilian and Law-Enforcement Surge in Sporting/ Self-Defense Ammo
Gun ownership in the Philippines climbed 12% in 2024, lifting sales of 9 mm and .45 ACP rounds among licensed civilians. Thai shooting-sports club membership increased by 8%, driving demand for match-grade 5.56 mm and 7.62 mm cartridges. India’s annual growth of 6% in civilian licenses between 2022 and 2025 has encouraged manufacturers to diversify into both .32 ACP and 12-gauge loads. Indonesia’s National Police ordered 10 million hollow-point 9 mm rounds alongside 50,000 Glock pistols, demonstrating specialized law-enforcement pull. Australian state police transitioned to 5.7 × 28 mm platforms, introducing a new niche caliber to regional procurement records.
Restraints Impact Analysis*
| Restraint | (~) % Impact on CAGR Forecast | Geographic Relevance | Impact Timeline |
|---|---|---|---|
| Complex multi-layer export controls and licensing | -0.5% | Global, especially for US-origin parts | Short term (≤ 2 years) |
| Raw-material price volatility | -0.4% | India, Southeast Asia | Short term (≤ 2 years) |
| Cyber-security risks in smart-ammo interfaces | -0.3% | Japan, South Korea | Long term (≥ 4 years) |
| Proliferation of 3D-printed improvised munitions | -0.2% | Conflict zones, Southeast Asia | Medium term (2-4 years) |
| Source: Mordor Intelligence | |||
Complex Multi-Layer Export Controls and Licensing
The Missile Technology Control Regime rules cap transfers of munitions capable of a range exceeding 300 km or a payload exceeding 500 kg, complicating India’s BrahMos-NG supply talks with the Philippines.[2] The Wassenaar Arrangement broadened its 2024 lists to include programmable fuzes, adding 42-state clearance cycles to intra-Asian transactions. US ITAR reviews now average 90-120 days, with denial rates up 8% in 2024 as end-use scrutiny tightens. Australia’s export permit regime applies human rights tests that slowed 155 mm shell deliveries to Southeast Asia in 2024. South Korea’s K9 ammunition exports to Poland faced delays in NATO certification, indicating that even OECD suppliers may encounter administrative hurdles.
Raw-Material Price Volatility (Copper, Lead)
Copper prices spiked 15% in January 2024 to USD 9,200/t before easing, squeezing cash flow for cartridge-case fabs. Lead traded between USD 2,000 and USD 2,350/t during 2024, disrupting purchase schedules for Southeast Asian assemblers. Indian producers hedged up to 40% of copper exposure yet still saw 3-5 pp margin compression in FY 2024. PT Pindad absorbed a 12% cost uptick on 81 mm shells, prompting indexed-price clauses in new MoD contracts. Thales paused its 40 mm grenade output for two weeks in March 2024 due to lead-alloy shortages, highlighting the rigidity of its supply chain.
*Our forecasts treat driver/restraint impacts as directional, not additive. The impact forecasts reflect baseline growth, mix effects, and variable interactions.
Segment Analysis
By Caliber: Large-Caliber Artillery Gains Momentum
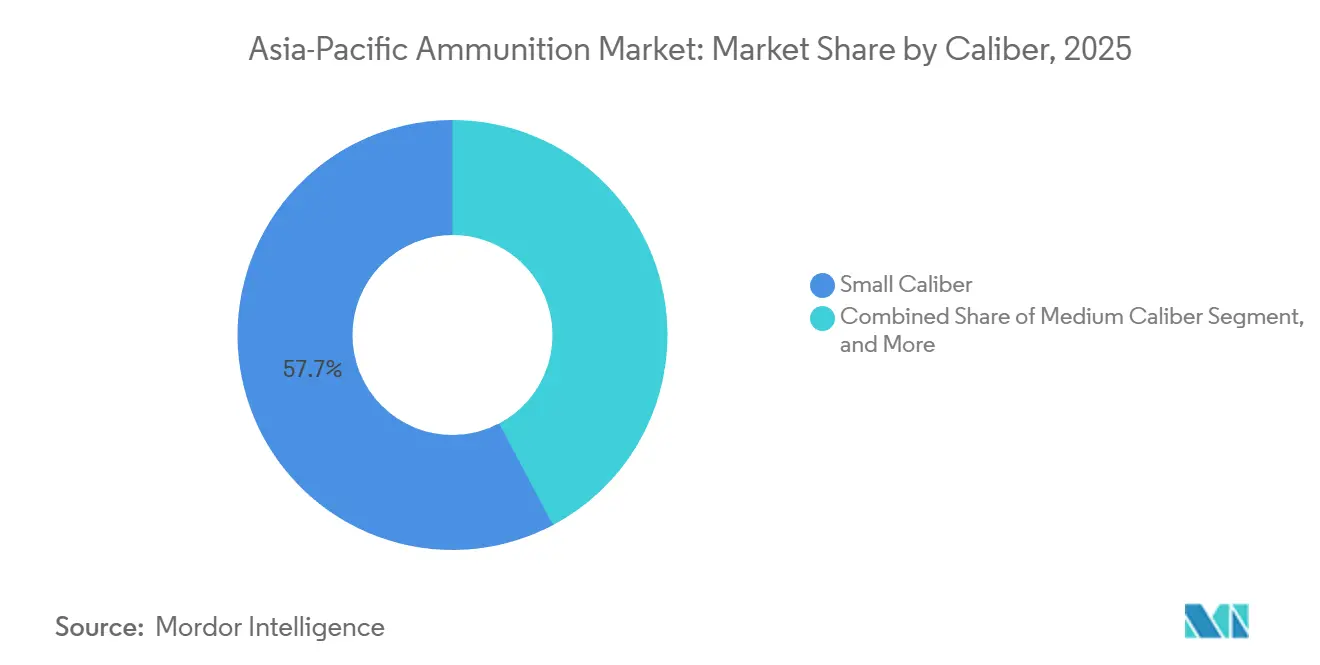
Small caliber ammunition dominated the Asia-Pacific ammunition market with a 57.74% share in 2025, thanks to the sheer volume of 5.56 mm, 7.62 mm, and 9 mm rounds procured for infantry weapons. Large caliber shells exceeding 100 mm are projected to grow at a 5.16% CAGR, outpacing the overall Asia-Pacific ammunition market as regional armies prioritize long-range fires and counter-battery missions. India’s annual 155 mm capacity now exceeds 100,000 rounds, illustrating how self-reliance ambitions can alter supplier maps. South Korea leverages domestic demand to price K9 ammunition 15-20% below European quotes, capturing export programs in Poland and Australia.
Medium caliber autocannons, with calibers ranging from 20 mm to 57 mm, serve armored vehicles and naval guns, with Australia’s LAND 400 program specifying smart 30 mm airburst options. The “others” bracket, which includes 12.7 mm machine gun rounds and 40 mm grenades, remains stable, driven by special forces and helicopter door guns. While small-caliber volumes will still dominate training consumption, their growth rate moderates as inventory turn stabilizes. In contrast, artillery demand reacts directly to shifting threat perceptions and exercises that draw down war stocks.

By Product: Bullets and Cartridges Hold Value Leadership
Bullets and cartridges accounted for 62.67% of the Asia-Pacific ammunition market share in 2025, driven by predictable replacement cycles for training and operational readiness. The segment is expanding at a 4.98% CAGR, benefiting from dual military-civilian overlap and the ease of scaling small-caliber production lines. Artillery shells and mortars, although lower in unit volume, carry higher average selling prices, especially when precision-guidance kits are added, keeping revenue contribution sizable despite smaller share counts.
Aerial bombs and 40 mm grenades fill niche close-air-support and infantry-assault roles; the Philippines, for example, earmarked Horizon 2 funds for automatic grenade launchers and stocks of dual-purpose rounds. Australian and Indonesian facilities ramping 155 mm shells illustrate how economies of scale are emerging outside traditional US and European hubs. Continued modernization ensures ongoing refresh cycles, locking in baseline demand even should overall training tempos fluctuate.
By Guidance: Unguided Dominates but Smart Rounds Accelerate
Unguided rounds controlled 90.38% of the Asia-Pacific ammunition market share in 2025 due to their cost efficiency and minimal integration requirements. Guided projectiles, however, are poised for a 5.62% CAGR as regional armed forces embrace precision effects to minimize collateral damage. South Korea’s Cheongeom missile and India’s GPS-enabled Pinaka rockets highlight the value governments place on first-round hit probability in contested environments.
Cyber-resilience now figures prominently in procurement criteria, with Australia and Japan hardening electronic interfaces to defeat spoofing threats. Despite unit prices that run five to ten times those of unguided equivalents, guided munitions are increasingly justified for high-value targets, especially along maritime chokepoints and border flashpoints, where misfires carry significant strategic risk.
By End-User: Military Spending Sets the Pace
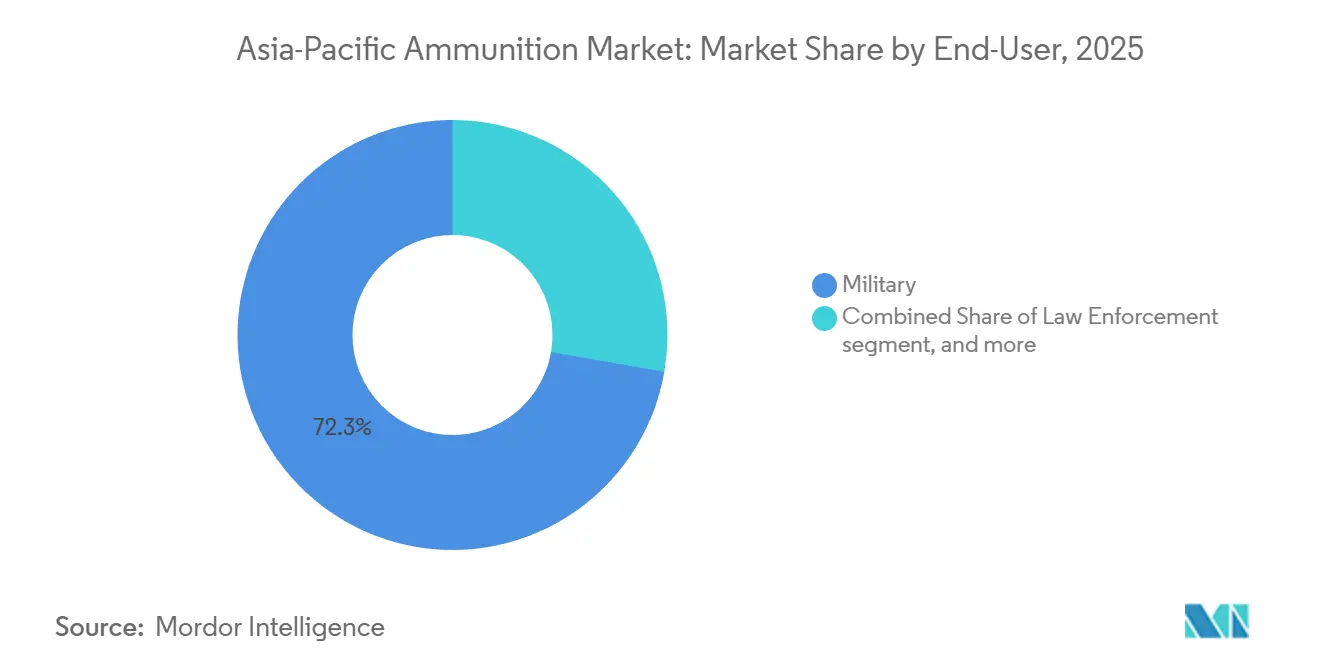
Military organizations consumed 72.26% of regional output in 2025 and are projected to grow at a 5.78% CAGR, faster than any civil or law-enforcement channel, as governments replenish stockpiles and expand force structures. India raised its annual ammo budget to USD 2.3 billion in 2024, while China expanded encrypted storage depots for its Rocket Force in western theaters.
Law-enforcement agencies account for a steady tranche of small-caliber demand, evidenced by Indonesia’s 10 million-round procurement for police pistols. Civilian sport-shooting adds incremental volume and margin, but licensing ceilings and caliber restrictions limit cross-border trade. Together, non-military segments cushion revenue during lulls in government pulses but will not unseat the military as the decisive growth engine.
By Platform: Land Systems Dominate Consumption
Land weapons systems held 64.89% of the Asia-Pacific ammunition market size in 2025, and their 6.04% CAGR makes them the fastest-growing platform segment. The surge reflects a wave of modernizations across India, Australia, and South Korea, including artillery, armored-vehicle, and small-arms upgrades.
Naval weapon demand grows in tandem with fleet renewals such as Japan’s Mogami-class frigates, which rely on 76 mm multi-role rounds. Airborne munitions, ranging from 20 mm cannons to standoff missiles, will track fighter acquisitions like Australia’s 72-strong F-35A fleet; yet, their aggregate volumes remain smaller than those of land-based categories.
Geography Analysis
China accounted for 50.35% of the 2025 regional volume, reflecting its deep stockpiles for potential contingencies involving Taiwan and ongoing border tensions with India. Indigenous giants such as Norinco provide everything from 155 mm shells to small-caliber loads, allowing Beijing to shelter production from foreign sanctions. As inventories edge toward sufficiency and export-control scrutiny stiffens, China’s growth rate is moderating.
India is the fastest-expanding geography, with a 5.28% forecast CAGR through 2031, buoyed by policies that trimmed import reliance below 10% and shifted 40% of production into private hands. Active capacity adds from brass-case plants to 155 mm lines signal that the Asia-Pacific ammunition market will see more intra-regional sourcing.
Japan’s 2024 budget spike redirected billions toward counter-strike ammunition, eroding its historical dependence on US inventories. South Korea’s 4-5% annual budget upticks and record USD 17 billion in defense exports showcase how scale and vertical integration translate into outward market penetration.[3] Australia’s Guided Weapons and Explosive Ordnance Enterprise anchors sovereign production for both home forces and Indo-Pacific allies, positioning Queensland as a regional artillery hub.
Southeast Asia, led by Indonesia, the Philippines, and Thailand, benefits from technology-transfer deals that localize staples such as 81 mm mortars and 5.56 mm cartridges. However, export license delays and fluctuations in raw material supply pose hurdles. Smaller markets, such as Vietnam and Malaysia, procure opportunistically, often sourcing from South Korea or Singapore’s ST Engineering. Overall, national self-reliance agendas recast trade flows, reducing exposure to distant suppliers yet multiplying compliance interfaces inside the region.
Regulatory Landscape
Across Asia-Pacific, ammunition production, storage, and cross-border movement are shaped by defense procurement rules, export-control regimes, and tightening controls on civilian possession. Multilateral controls such as the Missile Technology Control Regime (MTCR) and the Wassenaar Arrangement (including the 2024 list updates covering programmable fuzes) increase licensing complexity for guided and smart-munition subcomponents, and US-origin content can add additional review layers under ITAR. In practice, this extends lead times and elevates compliance as a source-selection factor.
Several countries are also updating domestic frameworks that affect sourcing and localization. In India, the Defence Procurement Manual (DPM) 2025 was approved to streamline revenue procurement and widen access for private industry in ammunition supply alongside state producers, aligning with acquisition preferences under the Defence Acquisition Procedure that prioritize Buy (Indian-IDDM) and Buy (Indian) categories. In Southeast Asia, Vietnam’s 2024 Law on management and use of weapons, explosive materials and support instruments took effect on 1 January 2025, requiring compliance with technical regulations for ammunition production and warehousing, while Hong Kong advanced amendments to the Firearms and Ammunition Ordinance in early 2025 to implement the UN Firearms Protocol, with specific offenses related to illicit trafficking.
Value Chain Analysis
The Asia-Pacific ammunition value chain runs from raw materials and energetics to component machining, final assembly, qualification, and distribution through tightly controlled government channels. Upstream inputs include copper and other metals for cartridge cases and projectile bodies, energetics (explosives and propellants), and increasingly electronics and sensors for programmable fuzes and guidance kits. Midstream production covers case drawing and forging, projectile and fuze manufacturing, propellant blending and filling, and system integration, followed by proofing, lot acceptance testing, and storage in regulated depots. Military procurement dominates volumes, while law enforcement and civilian sporting ammunition form smaller, higher-mix channels where allowed.
Localization initiatives are reshaping where value is captured within the chain, particularly around energetics, forging, and precision subcomponents that previously drove import dependence. In Australia, the Guided Weapons and Explosive Ordnance (GWEO) plan has elevated domestic manufacture of 155 mm ammunition and related components. In India, large-scale private participation is being added alongside traditional state production, including greenfield investments tied to partnerships for explosives, propellants, and precision-guided artillery ammunition. Key friction points remain raw-material price volatility, certification and export-license lead times for controlled components, and cyber and assurance requirements for smart munitions, which increase testing burden and favor suppliers with vertically integrated metallurgical, energetics, and compliance capabilities.
Competitive Landscape
The Asia-Pacific ammunition market is moderately fragmented; no supplier holds more than a 15% share, yet the combined top five control hovers near 45%, favoring firms with in-house metallurgy and propellant chemistry. State-owned incumbents Norinco, Munitions India Limited, and PT Pindad dominate the domestic tender market. At the same time, multinationals such as Rheinmetall and BAE Systems secure high-margin guided-munition contracts by pairing technology with local offsets.
India’s import drop from 35-40% in 2020 to below 10% in 2025 exemplifies how policy-driven self-reliance can quickly shrink the addressable volumes of foreign suppliers.[4] South Korea’s Hanwha and Poongsan leverage vertical integration to undercut European 155 mm prices by up to 20% on recent Polish and Australian sales. Rheinmetall’s AUD 1 billion (USD 0.67 billion) LAND 159 win demonstrates the value of joint ventures in this case, with Nioa tasked with meeting stringent sovereign capability mandates.
Raw-material volatility drives upstream integration: firms controlling brass smelters or recycled-metal streams cushion margin swings as copper pricing lurches. Cyber-security investments in anti-jam GPS receivers and encrypted fuzes add USD 1,000-plus per round but position suppliers for the smart-munition wave. Export-control compliance teams have become competitive differentiators; BAE Systems and Elbit Systems maintain dedicated staff to navigate ITAR and Wassenaar regimes, a barrier to entry for smaller Asian start-ups.
White-space opportunities are emerging in the green ammunition and law enforcement niches, where smaller batch runs and service-heavy contracts suit agile private players. Over the forecast window, consolidation is likely to occur around metallurgy assets and smart munition intellectual property, while national offset rules maintain complex and highly localized ownership structures.
Asia-Pacific Ammunition Industry Leaders
-
Poongson Corporation
-
Singapore Technologies Engineering Ltd.
-
Munitions India Limited
-
Hanwha Corporation
-
General Dynamics Corporation
- *Disclaimer: Major Players sorted in no particular order
Market Opportunities and Future Outlook
Sovereign capacity build-out in large-caliber artillery, including upstream inputs such as forged bodies, brass cases, explosives, and propellants, is creating whitespace for equipment, materials, and process technology suppliers that can qualify to military standards and support repeatable lot acceptance. In Australia, the government awarded Rheinmetall NIOA Munitions an A$72 million contract (June 2026) to establish a 155 mm M795 artillery projectile forging capability in Maryborough, Queensland. This complements wider GWEO manufacturing pathways and signals demand for domestic forging, energetics, and QA and test infrastructure. Similar opportunities are visible in India, where private-sector plants and partnerships are being commissioned to raise shell output and localize critical inputs, aligning with procurement preferences that emphasize Indian content.
A second opportunity area is the upgrade cycle toward precision and programmable effects across land platforms, where integration and certification services can matter as much as the projectile itself. India’s modernization pull toward 155 mm and precision-guided artillery ammunition is supported by new private facilities, including the inauguration of a large artillery-shell manufacturing complex in Shirdi, Maharashtra (May 2026) and the commissioning of an automated medium-caliber (30 mm) ammunition facility in Nagpur (January 2026). Together, these investments expand the supplier base for both conventional and higher-specification rounds. On the small-caliber side, multi-year framework buys from security agencies, such as Malaysia’s three-year RM150 million contract awarded to Ketech Asia (July 2026) for 9 mm and 5.56 mm ammunition, highlight recurring demand where suppliers can differentiate on consistent quality, traceability, and compliant distribution.
Recent Industry Developments
- April 2026: Hanwha Aerospace discontinued its review process for acquiring Poongsan Corporation's ammunition business unit after the parties did not agree on valuation. The decision keeps Poongsan independent in ammunition supply while Hanwha continues to rely on partnerships rather than full vertical integration for certain munitions needs.
- February 2025: The Indian Ministry of Defence signed contracts with Economic Explosive Limited and Munitions India Limited to procure Area Denial Munition Type-1 (DPICM) and High Explosive Pre-Fragmented (HEPF) Mk-1 (Enhanced) rockets for the Pinaka MLRS, totaling INR 101,470 million, and also contracted Bharat Electronics Limited to upgrade SHAKTI software. The package reinforces domestic sourcing for rocket ammunition and strengthens production depth across warheads, rocket manufacturing, and fire-control enablement.
- February 2024: Munitions India Limited signed a USD 225 million contract to supply artillery ammunition to the Kingdom of Saudi Arabia through Nadrah Company. The deal underscores the export role of Indian producers in large-caliber supply and supports scale benefits that can feed back into domestic production economics.
Research Methodology Framework and Report Scope
Market Definition and Coverage
This market is defined as the value of ammunition demand across Asia-Pacific, covering rounds and munitions bought for military use, internal security, and other organized end users, and counted in US dollars for the study period.
Scope exclusions: We exclude weapons platforms and non-ammunition support services, and we do not count unrelated items such as uniforms or general electronics.
Segmentation Overview
- By Caliber
- Small Caliber
- Medium Caliber
- Large Caliber
- Others
- By Product
- Bullets and Cartridges
- Artillery Shells and Mortars
- Aerial Bombs and Grenades
- By Guidance
- Guided
- Unguided
- By End-User
- Military
- Law Enforcement
- Civil and Sports Shooting
- By Platform
- Land
- Naval
- Airborne
- By Geography
- China
- India
- Japan
- South Korea
- Australia
- Indonesia
- Philippines
- Thailand
- Rest of Asia-Pacific
Data Sources, Market Sizing, and Validation
Desk Research
Desk research starts by building a clean demand picture for Asia-Pacific using public defense budget documents, procurement releases, and parliamentary or audit reports where available. We also refer to sources such as UN Comtrade trade statistics, SIPRI military expenditure data, official defense ministry and armed forces websites, and UNODA reporting on conventional arms to understand import dependence and replenishment cycles.
To turn these signals into market inputs, we use company annual reports and investor presentations for capacity direction and revenue mix hints, along with reputable press coverage of ammunition orders and stockpile refill programs. For cross-checking at a company and project level, we selectively use paid subscriptions for company financials and intelligence, defense contract and tender tracking, and shipment-level trade databases, which helps us validate timing and reduce double counting. These desk sources are not exhaustive, and we relied on other public references to collect data, validate assumptions, and clarify open questions.
Primary Interviews and Surveys
Primary work is used to test the assumptions behind procurement pacing, caliber mix shifts, and typical pricing behavior, before the final numbers are locked. We spoke with a mix of ammunition manufacturers, distributors and channel partners, defense procurement and program stakeholders, and domain specialists across key Asia-Pacific markets, and the input was used to fine-tune demand allocation and forecast drivers.
Distribution of primary research fieldwork respondents
| Company type | Respondent position |
|---|---|
| Top tier: 25% | CXOs: 13% |
| Mid tier: 58% | Functional/Unit leaders: 34% |
| Smaller Players: 17% | Managers: 53% |
Market-Sizing & Forecasting
Sizing is built mainly through a top-down reconstruction that links defense spending and procurement priorities to an ammunition demand pool, then allocates that pool across major countries and end-use needs. When the model is run, selective bottom-up approximations are used as a check, such as rolling up sampled supplier revenues, order announcements, and estimated volumes multiplied by realistic average selling prices for common calibers.
A few inputs that matter in this market are country defense budget direction, live-fire training intensity and readiness pushes, stockpile replenishment cycles, import reliance versus local production, and the mix shift toward larger caliber and guided or smart munitions. Pricing is handled carefully by using a blended ASP logic that reflects contract timing and mix, rather than applying one flat price across the region. For forecasting, scenario analysis is used, with base, conservative, and higher procurement pacing cases shaped by interview feedback and visible budget signals, and then checked for consistency against trade and contract activity. Where bottom-up signals are missing for smaller countries, we address the gaps through proxying with force size, spend share, and recent procurement patterns, followed by a second pass to prevent overstatement.
Data Validation & Update Cycle
Validation is done in steps so outliers do not slip through, and so each assumption has a clear reason behind it. Model outputs are compared with independent signals such as trade flows, known procurement programs, and the implied per-soldier or per-platform ammunition spend, and then anomalies are reviewed by another analyst before sign-off.
If a major variance shows up, we re-check the scope mapping and, when needed, re-contact relevant respondents to confirm what changed, such as price resets, delivery slippage, or a new replenishment push. The report is refreshed annually, and interim updates are made when a material event affects demand or pricing assumptions. Right before delivery, a final review is completed so clients receive the latest view based on the newest public information and recent field feedback.
Mordor Intelligence's Asia Pacific Ammunition Market Size Compared Against Other Published Estimates
Published numbers for the Asia-Pacific ammunition market can look far apart, even when the growth rate direction seems similar. The spread usually comes from differences in what is counted as ammunition, how contract pricing is timed, and whether the estimate follows procurement reality or a broader spending narrative.
Trade flow checks, defense budget signals, and procurement award tracking are the evidence used to keep Mordor Intelligence's estimate tied to realized buying patterns in Asia-Pacific, instead of assuming all modernization spending converts into ammunition revenue in the same year. Some published figures also mix in adjacent categories (like wider weapons content) or apply a single regional price curve that does not reflect caliber and guidance mix, which can lift or compress the total depending on the base year chosen.
Benchmark comparison
| Source | Market Size | Gaps in Research Methodology |
|---|---|---|
| Mordor Intelligence | USD 4.85 B (2026) | |
| Industry Publisher A | USD 6.81 B (2024) | Uses an earlier valuation year and a broader scope description that can pull in a wider set of ammunition types and applications, and it can also reflect different currency timing and price assumptions across countries. |
| Global Publisher B | USD 2.69 B (2025) | The stated total appears closer to a narrower counted demand pool, which can happen when only selected end users or caliber bands are emphasized, and when procurement pacing is modeled more conservatively for the region. |
Taken together, the table shows that scope boundaries, base year selection, and price and mix handling explain most of the gap. By anchoring the model to observable procurement and trade signals, and then sanity checking with supplier and pricing approximations, the final number stays traceable to clear steps that can be repeated as new budgets and orders emerge.
Key Questions Answered in the Report
How large is the Asia-Pacific ammunition market in 2026?
The Asia-Pacific ammunition market size stood at USD 4.85 billion in 2026 and is projected to reach USD 5.93 billion by 2031.
Which caliber segment is growing fastest?
Large caliber artillery and tank ammunition is expanding at a 5.16% CAGR as regional forces prioritize long-range fires.
Which country leads regional demand?
China held 50.35% of 2025 demand, driven by stockpiling for potential Taiwan and border contingencies.
What share do guided munitions hold today?
Guided rounds represented under 10% of 2025 shipments, but they are growing at a 5.62% CAGR through 2031.
How are export controls affecting suppliers?
Multi-layer regimes such as ITAR, MTCR, and Wassenaar extend licensing lead-times to 90-120 days, tilting orders toward firms with robust compliance teams.
Which platform consumes the most ammunition?
Land systems account for nearly two-thirds of regional ammunition demand and are growing at over 6% annually.