
Market Overview
| Study Period | 2020 - 2031 |
|---|---|
| Forecast Data Period | 2026 - 2031 |
| Base Year Market Size (2025) | USD 7.79 Billion |
| Market Size (2026) | USD 8.24 Billion |
| Market Size (2031) | USD 10.91 Billion |
| Growth Rate (2026 - 2031) | 5.78 % |
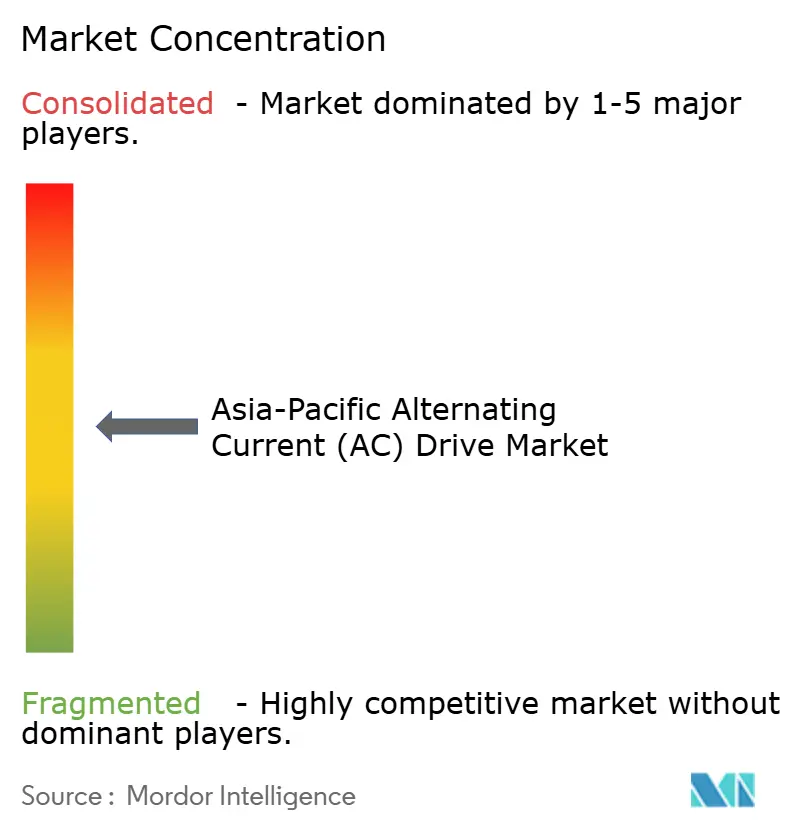
| Market Concentration | Medium |
Major Players *Disclaimer: Major Players sorted in no particular order Image © Mordor Intelligence. Reuse requires attribution under CC BY 4.0. | |
Asia-Pacific Alternating Current (AC) Drive Market Analysis by Mordor Intelligence
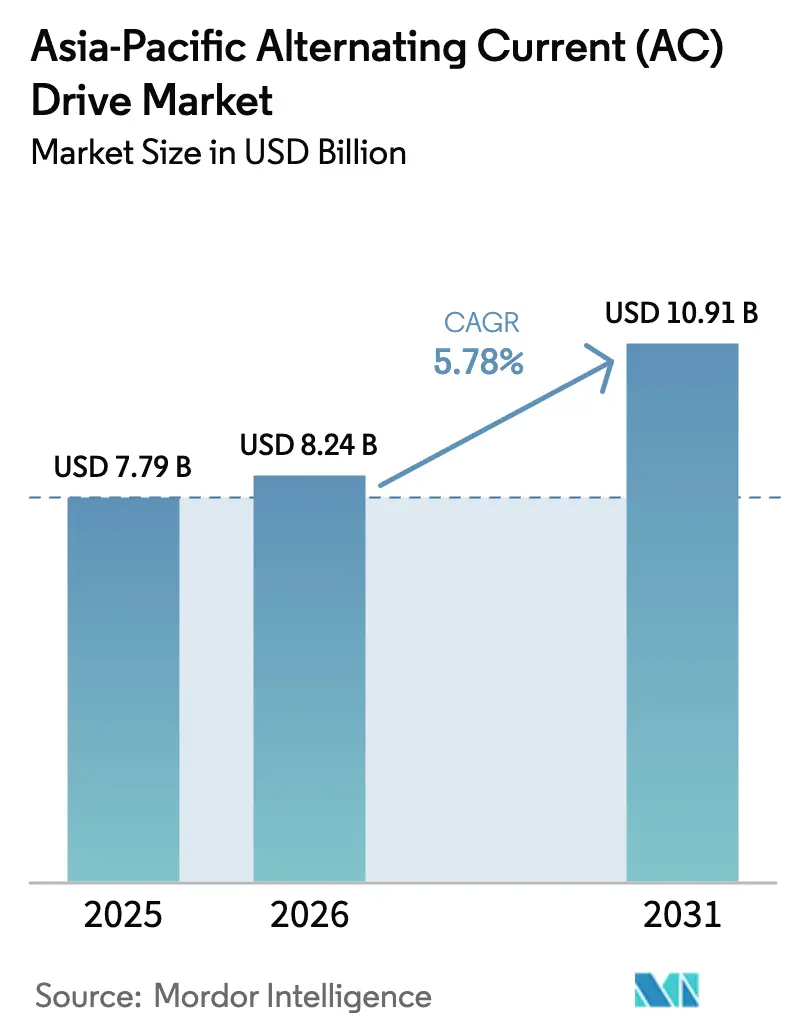
The Asia-Pacific AC drive market size in 2026 is estimated at USD 8.24 billion, growing from 2025 value of USD 7.79 billion with 2031 projections showing USD 10.91 billion, growing at 5.78% CAGR over 2026-2031. Market momentum reflects rapid industrial electrification, mandatory motor-efficiency upgrades, and a shift toward silicon-carbide power devices. Energy regulations that raise the bar from IE2 to IE3 efficiency classes prompt equipment owners to adopt variable-speed operation, while increasing electricity tariffs shorten the payback periods for drive retrofits. Suppliers that pair high-efficiency hardware with digital services capture the most value, even as price competition intensifies in the low-voltage space. Localization of production within Southeast Asia also mitigates supply-chain risk and positions vendors for tariff-free trade within the Regional Comprehensive Economic Partnership (RCEP) bloc.
Key Report Takeaways
- By voltage, low-voltage models held 69.05% of the Asia-Pacific AC drive market share in 2025; Medium-voltage units are projected to post a 7.26% CAGR through 2031.
- By power rating, the 0.4–11 kW segment captured a 37.12% share of the Asia-Pacific AC drive market size in 2025. Ratings above 132 kW are forecasted to grow at a 6.68% CAGR between 2026 and 2031.
- By drive type, VSI accounted for a 52.60% share in 2025, while PWM is expected to expand at a 6.98% CAGR to 2031.
- By application, pumps led with a 28.55% share in 2025; compressors are expected to rise at a 6.28% CAGR to 2031.
- By end-user, HVAC commanded 20.87% of the market in 2025; water and wastewater are projected to advance at a 5.76% CAGR through 2031.
- By geography, China represented a 47.12% share in 2025, whereas India is expected to clock a 6.32% CAGR through 2031.
Note: Market size and forecast figures in this report are generated using Mordor Intelligence’s proprietary estimation framework, updated with the latest available data and insights as of 2026.
Market Trends and Insights
Drivers Impact Analysis of Asia-Pacific Alternating Current (AC) Drive Market*
| Driver | (~) % Impact on CAGR Forecast | Geographic Relevance | Impact Timeline |
|---|---|---|---|
| Increasing demand for energy savings and efficiency | +1.8% | China and India | Medium term (2-4 years) |
| Rapid industrialisation and urban development | +1.5% | India and Southeast Asia | Long term (≥ 4 years) |
| Government policies favouring industrial electrification | +1.2% | China, India, Japan, South Korea | Short term (≤ 2 years) |
| Declining cost of power electronics components | +0.9% | Regionwide | Medium term (2-4 years) |
| Mandatory motor-efficiency standards across Asia Pacific | +0.8% | Regionwide | Short term (≤ 2 years) |
| Surge in renewable-powered pump and fan installations | +0.6% | China, India, Australia | Long term (≥ 4 years) |
| Source: Mordor Intelligence | |||
Increasing Demand for Energy Savings and Efficiency
Motor systems consume nearly 45% of all electricity used in Asia-Pacific manufacturing, making them a natural target for energy efficiency measures. China’s 2024 standard raised minimum efficiencies to IE3 for motors above 0.75 kW, prompting many factories to pair premium-efficiency machines with variable-speed drives. As industrial power tariffs increased by 18% between 2024 and 2025, the average drive payback period dropped below two years, accelerating retrofit programs. Singapore imposed similar IE3 mandates, reinforcing a regionwide regulatory pull.[1] Factory managers now verify energy savings using cloud dashboards that show 20-50% reductions in pump and fan loads, solidifying drives as a core element of operational excellence.
Rapid Industrialization and Urban Development
India’s USD 1.4 trillion National Infrastructure Pipeline adds airports, metros, and smart factories that require precise motor control. Production-Linked Incentive schemes worth USD 26 billion anchor new electronics and automotive plants, each specifying drives for conveyors, presses, and HVAC systems.[2] Southeast Asia is a parallel story: Vietnam’s export-oriented industrial parks adopt advanced drives from day one to ensure global quality standards. Urban building codes in Bangkok, Jakarta, and Manila now embed green-building requirements that implicitly favor variable-speed HVAC operation. Together, these projects sustain high baseline demand even if global trade softens.
Government Policies Favoring Industrial Electrification
Net-zero commitments translate into incentive packages that tilt capex toward electric over pneumatic or hydraulic motion. China’s 2060 neutrality pledge funds tax rebates covering up to 20% of the cost of high-efficiency drive systems.[3] Japan includes drives among “specified energy-saving devices” eligible for accelerated depreciation, while South Korea’s Green New Deal allocates grants to retrofit industrial blowers with variable-speed control. Such carrots shorten internal payback hurdles and embed drives into corporate decarbonization roadmaps.
Declining Cost of Power Electronics Components
Silicon-carbide (SiC) manufacturing ramp-ups in China and Malaysia increase wafer volumes and drive device prices down by more than 15% year-over-year. Microchip’s January 2025 release of mSiC modules shows 98% drive efficiency and 20°C lower junction temperature, enabling smaller heat sinks and cabinets. As BoM costs shrink, vendors package SiC with predictive-maintenance software to deliver total-cost savings that resonate with mid-tier factories, which were previously locked out by price.
Restraints Impact Analysis of Asia-Pacific Alternating Current (AC) Drive Market*
| Restraint | (~) % Impact on CAGR Forecast | Geographic Relevance | Impact Timeline |
|---|---|---|---|
| High up-front capital cost for medium-voltage drives | -0.7% | Emerging Asia-Pacific | Medium term (2-4 years) |
| Technical skill-gap in drive programming and tuning | -0.5% | Southeast Asia and India | Long term (≥ 4 years) |
| Currency volatility affecting imported semiconductors | -0.4% | Indonesia and Philippines | Short term (≤ 2 years) |
| Supply chain disruption for IGBT modules | -0.3% | Regionwide | Short term (≤ 2 years) |
| Source: Mordor Intelligence | |||
High Up-Front Capital Cost for Medium-Voltage Drives
A single medium-voltage (MV) inverter can exceed USD 100,000 before site wiring, making finance teams cautious. Smaller mines and water utilities defer MV upgrades despite lifecycle savings. The ABB ACS8080, launched in November 2024, reduces its footprint by 25% and integrates safety relays to minimize ancillary costs. Even so, many buyers adopt energy-performance contracts or drive-as-a-service models that shift the burden to specialist ESCOs.
Technical Skill-Gap in Drive Programming and Tuning
Modern vector drives need parameter mapping, harmonic mitigation, and network integration skills that many electricians lack. Mis-tuned units squander 8-12% of expected savings. Siemens responded with self-tuning algorithms via its Xcelerator Digital Drivetrain suite, allowing drives to auto-adjust torque curves and alarm thresholds. ASEAN governments now sponsor vocational modules on variable-frequency technology; however, the depth of the workforce will take years to mature.
*Our forecasts treat driver/restraint impacts as directional, not additive. The impact forecasts reflect baseline growth, mix effects, and variable interactions.
Asia-Pacific Alternating Current (AC) Drive Market Segment Analysis
By Voltage:
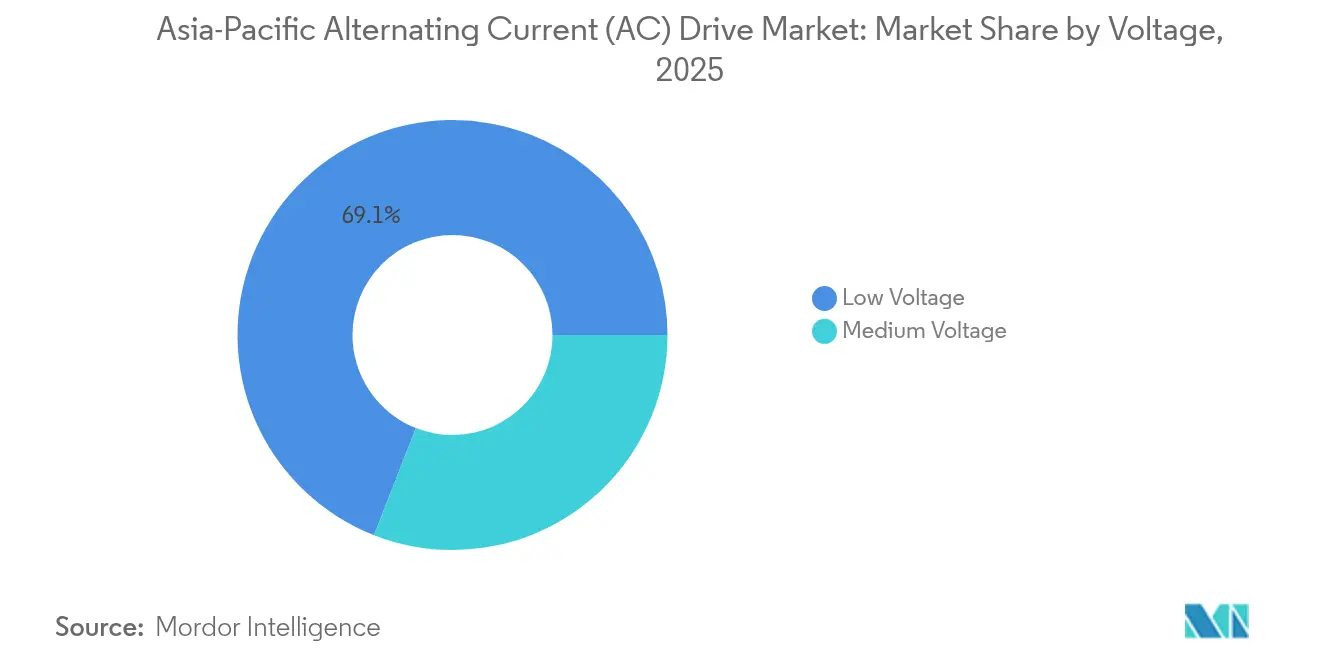
Low-Voltage Dominance Amid Medium-Voltage AccelerationLow-voltage drives captured 69.05% of the Asia-Pacific AC drive market share in 2025, reflecting their suitability for the vast installed base of motors with a voltage rating of less than 1 kV across manufacturing and building services. Demand for these units remains solid in 2025 because falling component prices keep initial costs within reach of small and mid-size factories. Medium-voltage products, although a smaller slice today, are expected to benefit from a 7.26% CAGR through 2031 as mining, desalination, and district cooling projects specify power ratings above 1 MW.
Industrial contractors are increasingly designing medium-voltage inverters into new facilities to avoid later retrofit expenses. Silicon-carbide switches raise efficiency to 98%, helping operators justify higher capex with sharper energy savings. Local assembly in India and Vietnam further lowers delivered costs, while integrated safety functions reduce the need for auxiliary panels. Overall, the voltage mix shows a stable core in low-voltage units and an accelerating premium tier in medium-voltage solutions.

By Power Rating:
Mid-Range Leads While High-Power Segments AccelerateDrives rated 0.4–11 kW accounted for 37.12% of the Asia-Pacific AC drive market size in 2025, powering pumps, fans, and conveyors that underpin light-industry operations. Standardization keeps average selling prices on a gentle downward path, widening the retrofit pool for legacy fixed-speed motors. Units above 132 kW, although fewer in number, expand at a 6.68% CAGR as petrochemical, metro, and steel projects specify high-power control to reduce energy use and improve process stability between 2026 and 2031.
High-power inverters now ship with regenerative braking and active-front-end technology as standard features, adding grid-quality benefits that align with utility regulators' expectations. Mid-range 11–132 kW models incorporate built-in cloud gateways, allowing for remote monitoring without the need for additional hardware. Below 0.4 kW, niche applications in precision tooling maintain modest yet steady volumes. This balanced spread across power classes cushions suppliers from demand swings in any single rating band.
By Drive Type:
VSI Technology Leads With PWM Innovation AdvancingVoltage-source inverters (VSIs) platforms accounted for 52.60% of the Asia-Pacific AC drive market share in 2025, thanks to their proven reliability and ease of commissioning across various voltage classes. Pulse-width-modulated (PWM) models, however, deliver the fastest growth at a 6.98% CAGR through 2031, as urban utilities tighten harmonic limits and factories seek finer speed resolution. Current-source inverters retain niche roles that leverage inherent short-circuit protection and regenerative capability.
PWM drives utilize faster processors to run high-frequency switching, which reduces motor noise and enhances efficiency. VSI suppliers respond by upgrading firmware to include low-harmonic modes, blurring category lines, and giving buyers more flexibility. Across the spectrum, embedded Ethernet and OPC UA connectivity make drives an integral part of plant-wide digital twins. This technology race fosters healthy competition and drives continuous performance improvements.
By Application:
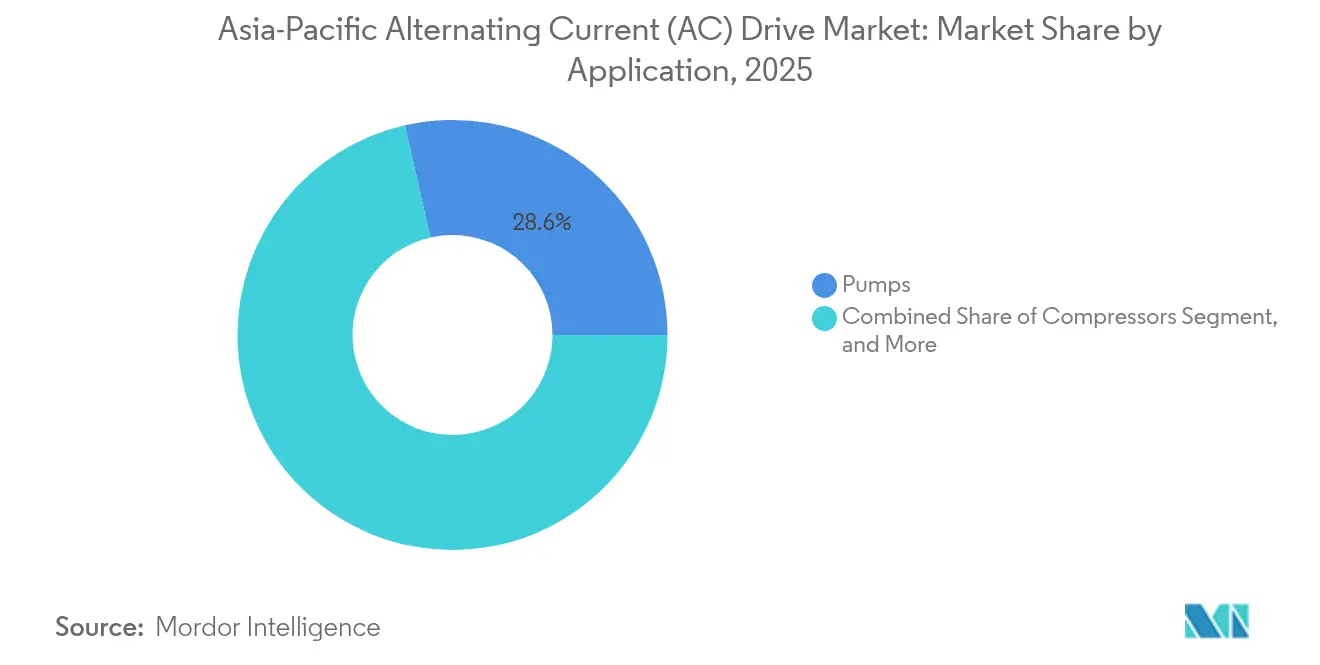
Pumps Lead While Compressors Drive GrowthPump duties delivered 28.55% of the Asia-Pacific AC drive market share in 2025, underscoring their ubiquity in water, irrigation, and HVAC loops, where variable flow control yields double-digit energy savings. Municipal mandates in China and Southeast Asia require variable-speed pumps with a capacity above 22 kW, thereby widening the installed base in 2025. Compressor applications, the growth frontrunner at 6.28% CAGR, gain momentum from cold-chain logistics, gas processing, and industrial refrigeration upgrades that demand precise pressure control through 2031.
Fan systems maintain strong volume on the back of data center construction and indoor air quality rules. Conveyor usage increases with e-commerce warehouse automation, while mixers and extruders in the food and plastics industries adopt closed-loop vector drives for improved product consistency. This diverse application mix ensures that weakness in one vertical does not derail overall market progress.
By End-User Industry:
HVAC Dominance With Water Treatment MomentumHVAC systems commanded 20.87% of the Asia-Pacific AC drive market share in 2025, driven by green-building codes that cap energy-use intensity and encourage developers to adopt variable-speed chillers and air handlers. Commercial real-estate recovery in 2025 sustains new installations even as retrofit work gains pace in older high-rises. Water and wastewater utilities exhibit the highest expansion, growing at a 5.76% CAGR, as authorities prioritize reducing leakage and achieving energy savings in pump stations and treatment plants through 2031.
Oil and gas, chemicals, and metals remain steady buyers because high reliability drives cut downtime in harsh environments. Food and beverage factories favor stainless-steel wash-down units, while electronics manufacturers specify clean-room-compatible drives with fieldbus connectivity. Skill-development programs and turnkey financing enlarge the addressable base across emerging economies, making end-user demand both deep and diverse.
Geography Analysis
China Alternating Current (AC) Drive Market
China accounted for 47.12% of the Asia-Pacific AC drive market share in 2025, representing a value of USD 3.67 billion. Domestic brands like Inovance scale quickly, yet multinationals keep share by offering higher-tier service contracts. The government’s 2024 efficiency framework solidifies long-term demand and aligns with its 2060 carbon reduction goals.
India Alternating Current (AC) Drive Market
India is expected to expand at a 6.32% CAGR to 2031, driven by USD 1.4 trillion in infrastructure programs and PLI manufacturing incentives. Water-pipeline expansions and metro projects embed drive specification from the design phase.
APAC Alternating Current (AC) Drive Market
Japan and South Korea focus on replacement cycles where predictive-maintenance overlays unlock OPEX savings. Australia and New Zealand deploy MV drives in mining haulage and desalination. Southeast Asian economies, notably Vietnam and Thailand, are emerging as manufacturing hubs where suppliers with local assembly and after-sales capabilities outpace import-only competitors. The geographic mosaic diversifies revenue streams and strengthens the long-range outlook for the Asia-Pacific AC drive market.
Regulatory Landscape
Regulation across Asia-Pacific is tightening around motor efficiency, electrical equipment safety approvals, and emerging digital manufacturing standards that affect AC drive selection and compliance work. In 2024, China raised minimum motor efficiency requirements to the IE3 class for motors above 0.75 kW, reinforcing the retrofit pull toward variable-speed operation as factories upgrade motor systems. Singapore continues to apply mandatory energy-related requirements through its Energy Conservation framework, while Australia regulates motor energy performance under its Greenhouse and Energy Minimum Standards program, which shapes procurement decisions for regulated motor ranges.
In 2026, several national programs reinforced standardization and market-entry obligations. Thailand advanced industrial compliance through a ministerial regulation tied to industrial standards for three-phase induction AC motors, effective April 17, 2026, supporting broader adoption of compliant motor-drive packages in industrial installations. Malaysia's Energy Commission formalized import and sale pathways for regulated electrical equipment through its Guidelines for the Approval of Electrical Equipment (2024 Edition), which centers on Certificate of Approval processes that can affect drive shipment planning and localization strategies. South Korea also expanded industrial standard-setting capacity in 2026 through the Ministry of Trade, Industry and Energy and the Korea Agency for Technology and Standards, including a multi-year plan to increase international standards work and KATS becoming the secretariat for the IEC smart manufacturing standardization committee (SC65F), a development that influences interfaces and digital integration expectations for drive-enabled automation.
Value Chain Analysis
The Asia-Pacific AC drive value chain begins with power semiconductor materials and components (including IGBTs and growing adoption of silicon-carbide devices), passives, control boards, and embedded software, then moves through drive design, assembly, and testing. Global suppliers and regional players are increasingly localizing manufacturing and configuration to shorten lead times and reduce cross-border friction, including ABB's low-voltage drive plant in Bac Ninh, Vietnam (ramped in 2025) and Schneider Electric's capacity expansion in Chennai, India. Upstream, semiconductor availability and packaging capability remain strategic, and suppliers pursue dual-sourcing and partnerships to manage module constraints and currency-driven import costs.
Midstream value sits in application engineering, commissioning, and system integration, where drives are specified with motors, PLCs, and plant networks and increasingly paired with digital services that validate energy savings and asset health. Channel partners, OEMs, panel builders, and EPC contractors deliver packaged solutions into pumps, fans, compressors, and HVAC projects, while after-sales service, spares, and software subscriptions extend lifetime value. As bundled analytics and self-tuning shift differentiation toward software attach and lifecycle support, localized service networks and training also help mitigate the skill-gap risk that can erode realized energy savings when drives are mis-parameterized.
Competitive Landscape
The Asia-Pacific AC drive market exhibits moderate concentration. The top five suppliers collectively hold roughly 46% of the combined revenue, leaving ample room for regional challengers. Global incumbents differentiate via SiC adoption and digital twins that forecast asset health, whereas Chinese makers compete on cost and speed of customization. Localization trends are evident: ABB opened a drive plant in Bac Ninh, Vietnam, in 2025, while Schneider expanded its Chennai capacity to reduce lead times by 30%.
Software adds a defensive moat. Yaskawa’s AI-based tuning minimizes commissioning days, while Danfoss bundles cloud energy analytics under subscription. Partnerships also intensify; Mitsubishi and Hitachi exchange IGBT supply and jointly bid on Japanese wastewater upgrades. Regional OEMs, such as Teco and INVT, pursue M&A to gain brand equity and expand their service networks.
Price erosion persists in entry-level low-voltage drives, yet premium MV and SiC products sustain double-digit margins. Suppliers that straddle the spectrum with modular platforms are best positioned to capture share as the Asia-Pacific AC drive market stratifies into commodity and value-added tiers.
Asia-Pacific Alternating Current (AC) Drive Industry Leaders
-
ABB Ltd.
-
Siemens AG
-
Schneider Electric SE
-
Mitsubishi Electric Corporation
-
Fuji Electric Co. Ltd.
- *Disclaimer: Major Players sorted in no particular order
Asia-Pacific Alternating Current (AC) Drive Market Companies Covered in this Report
- ABB Ltd.
- Siemens AG
- Schneider Electric SE
- Mitsubishi Electric Corporation
- Fuji Electric Co. Ltd.
- Danfoss A/S
- Hitachi Ltd.
- Toshiba Infrastructure Systems and Solutions Corporation
- Yaskawa Electric Corporation
- Nidec Corporation
- WEG Equipamentos Eletricos S.A.
- Hiconics Eco-Energy Technology Co. Ltd.
- Teco Electric and Machinery Co. Ltd.
- Rockwell Automation Inc.
- Larsen and Toubro Limited
- Inovance Technology Co. Ltd.
- Delta Electronics Inc.
- KEB Automation KG
- CG Power and Industrial Solutions Limited
- Bonfiglioli Riduttori S.p.A.
Read Analysis of Asia-Pacific Alternating Current (AC) Drive Companies
Market Opportunities and Future Outlook
A clear whitespace is forming around local-for-local manufacturing and engineering capacity for drives and related automation hardware in India and parts of Southeast Asia, where industrial electrification programs and infrastructure builds are adding new motor loads and modernization projects. In March 2026, ABB announced a USD 75 million investment in India to expand manufacturing and R&D for electrification, motion, and automation, including USD 21 million for the Peenya facility to increase low-voltage drive manufacturing capacity. These expansions support suppliers of power electronics, cabinets, and certified components, and also strengthen system integrators that can standardize deployments across multi-site manufacturers.
Process-industry electrification and ruggedized deployments are another opportunity area, particularly in harsh environments or high-duty applications where the value of sealed enclosures, corrosion resistance, and reduced cabinet complexity rises. ABB's June 2026 launch of IP66 and UL Type 4X variants for ACS580, ACH580, and ACQ580 points to demand for drives that can be installed closer to equipment without additional enclosures in water and wastewater sites. Industrial projects that package drives with automation platforms are also expanding the serviceable market, reinforced by ABB's July 2026 award to supply electrification equipment, including drives integrated with the ABB Ability System 800xA platform, for Coolbrooks RotoDynamic Heater deployment at Adani Cements Boyareddypalli plant in India. These project patterns support more standardized digital commissioning, monitoring, and performance verification offerings tied to installed drive fleets.
Recent Industry Developments in Asia-Pacific Alternating Current (AC) Drive Market
- June 2026: Mitsubishi Electric announced joint development of a new LV100-type standard package for power modules with integrated 3-level circuits with Semikron Danfoss, targeting industrial drive equipment. The collaboration focuses on standardizing advanced power module designs, supporting higher-efficiency and higher-performance inverter architectures used in modern AC drives.
- September 2025: Inovance Technology opened a silicon-carbide device packaging line in Guangdong to secure component supply for its next-generation medium-voltage inverters. The move strengthens vertical control over critical power-device packaging, improving supply resilience and supporting higher-efficiency MV drive roadmaps.
- November 2024: ABB launched the ACS8080 medium-voltage drive with a smaller footprint and integrated safety functions aimed at reducing installation complexity in high-power applications. By lowering cabinet space and ancillary hardware needs, the product refresh supports MV deployments in energy-intensive industries where total installed cost can slow upgrade decisions.
Asia-Pacific Alternating Current (AC) Drive Market Report Scope and Research Methodology
Market Definition and Coverage
This market covers revenues generated from alternating current (AC) drives sold and used across Asia-Pacific to control AC motor speed and torque in industrial and building applications.
Scope exclusions: We exclude standalone motors, mechanical gearboxes, and unrelated automation hardware that does not perform AC drive functionality.
Segments Covered in This Report
- By Voltage
- Low Voltage
- Medium Voltage
- By Power Rating
- less than or equal to 0.4 kW
- 0.4 – 11 kW
- 11 – 132 kW
- Above 132 kW
- By Drive Type
- VSI Drives
- CSI Drives
- PWM Drives
- By Application
- Pumps
- Fans
- Compressors
- Conveyors
- HVAC
- Other Application
- By End-User Industry
- Oil and Gas
- Chemical and Petrochemical
- Power Generation
- Water and Wastewater
- Metals and Mining
- HVAC
- Food and Beverage
- Discrete Manufacturing
- Other End-User Industry
- By Country
- China
- India
- Japan
- South Korea
- Australia and New Zealand
- Rest of Asia Pacific
Data Sources, Market Sizing, and Validation
Desk Research
Desk work started with building a clear demand map by end-use and application, and then linking it to measurable signals across the region. Public sources such as International Energy Agency efficiency publications, International Trade Centre trade statistics, World Bank industrial value-added indicators, and UNIDO industrial production releases were used to understand where motor-driven loads are expanding.
We then layered in context from sources such as national energy agencies and electricity authorities, water and wastewater utilities and associations, and standards bodies like IEC for drive and motor efficiency references. Company annual reports, investor presentations, and reputable press releases were used to cross-check shipment commentary, pricing direction, and capacity moves. Where needed, we also used paid subscriptions for company financials and news screening, and an import-export shipment-level database to validate country-level movement of relevant equipment classes. These desk sources are not exhaustive, and many other public and subscription sources were also consulted to collect data, validate assumptions, and clarify gaps.
Primary Interviews and Surveys
Primary work was used to pressure-test how AC drives are specified and purchased, and how pricing and mix move by voltage class and power rating. We spoke with a spread of channel partners, system integrators, plant engineering teams, and procurement roles across major Asia-Pacific markets so that desk assumptions on adoption, replacement cycles, and application mix could be corrected where needed.
Distribution of primary research fieldwork respondents
| Company type | Respondent position |
|---|---|
| Top tier: 29% | CXOs: 18% |
| Mid tier: 49% | Functional/Unit leaders: 39% |
| Smaller Players: 22% | Managers: 43% |
Market-Sizing & Forecasting
Sizing was built using a top-down demand pool reconstruction, where industrial output, infrastructure build activity, and motor-driven application intensity are translated into expected AC drive consumption by country and then aggregated for Asia-Pacific. In practice, we used variables such as manufacturing production trends, power generation and grid additions, wastewater capacity additions, HVAC construction activity, and the mix shift between low voltage and medium voltage installations, which then influence unit volumes and average selling prices.
Those totals were then cross-checked using selective bottom-up approximations, such as sampling price bands by voltage and power rating, channel feedback on annual shipment direction, and supplier revenue splits that are publicly disclosed. When bottom-up visibility was weak in smaller countries, gaps were handled by applying calibrated penetration and replacement assumptions that were verified during interviews, and then kept consistent across the time series.
For forecasting, scenario analysis was used so that energy-efficiency policy intensity, industrial capex cycles, and commodity-linked investment in process industries could be reflected without overfitting. The final forecast path was accepted only after primary inputs aligned on realistic adoption speed in pumps, fans, compressors, and other common motor loads.
Data Validation & Update Cycle
Validation was done through multiple checks so the final number does not rely on a single data stream. We compared model outputs against independent signals such as industrial production direction, trade movement in related equipment groups, and country investment patterns, and then investigated any sharp jumps that did not match the underlying drivers.
Before sign-off, the model and key assumptions were reviewed in steps by analysts, and re-contacts were triggered when interview feedback conflicted with desk indicators or when pricing direction looked inconsistent by voltage class. Reports are refreshed annually, and interim updates are made when a material event changes demand expectations. Right before delivery, a final pass is done so clients receive an updated view based on the latest available data.
Mordor Intelligence's Asia Pacific Alternating Current Drive Market Size Measured Against Other Published Estimates
Published market values for Asia-Pacific AC drives often differ because the scope choices behind the numbers are not the same, and because pricing and mix assumptions vary a lot across voltage and power bands. Timing also matters because some publishers update currency conversion and inflation inputs more frequently than others, which shifts the reported USD value.
The main gap comes from whether adjacent products are counted together, where Mordor Intelligence counts only AC drives used for motor speed control and excludes DC drives and broader motor control centers that are sometimes bundled into drive revenue.
Benchmark comparison
| Source | Market Size | Gaps in Research Methodology |
|---|---|---|
| Mordor Intelligence | USD 7.79 B (2025) | |
| Industry Portal A | USD 9.60 B (2025) | Uses a broader country list and presents production and trade coverage, but the visible scope is less explicit on excluding adjacent motor-control hardware, which can inflate the addressable revenue pool. |
| Sector Brief B | USD 10.40 B (2026) | Tracks low voltage drives rather than total AC drives, and the year differs, so the value can look larger due to timing, inflation, and a definition that may not separate AC drives from neighboring low voltage motor-control categories. |
The spread in the table is mainly explained by category boundaries and year alignment, and not only by growth expectations. By keeping voltage, power rating, and application-linked pricing logic consistent, the final estimate stays traceable to repeatable inputs that can be rechecked as new signals emerge.
Key Questions Answered in the Report
What is the current value of the Asia-Pacific AC drive market?
The Asia-Pacific AC drive market size is USD 8.24 billion in 2026.
How fast will demand grow in India?
India’s share is projected to rise at a 6.32% CAGR through 2031, faster than any other country segment.
Which application generates the highest revenue?
Pump systems account for 28.55% of total 2025 revenue, making them the largest single application.
Why are silicon-carbide drives gaining traction?
SiC devices boost drive efficiency to 98% and shrink cooling hardware, delivering lower lifecycle costs.
How concentrated is supplier power?
The top five vendors hold about 46% of regional sales, reflecting moderate concentration and room for new entrants.
What voltage class dominates current shipments?
Low-voltage models still comprise nearly 70% of shipments, though medium-voltage units are growing faster.