Market Overview
| Study Period | 2017 - 2028 |
|---|---|
| Base Year For Estimation | 2023 |
| Forecast Data Period | 2024 - 2028 |
| Market Size (2024) | USD 5.12 Billion |
| Market Size (2028) | USD 6.52 Billion |
| Growth Rate (2024 - 2028) | 6.26% CAGR |
| Market Concentration | Low |
Major Players*Disclaimer: Major Players sorted in no particular order Image © Mordor Intelligence. Reuse requires attribution under CC BY 4.0. | |

Asia-Pacific Acrylic Adhesives Market Analysis by Mordor Intelligence
The Asia-Pacific Acrylic Adhesives Market size is estimated at 5.12 billion USD in 2024, and is expected to reach 6.52 billion USD by 2028, growing at a CAGR of 6.26% during the forecast period (2024-2028).
The Asia-Pacific acrylic adhesives market is experiencing significant transformation driven by rapid industrialization and infrastructure development across the region. China continues to lead regional construction activities, with its construction market reaching USD 4.6 trillion in 2021 and demonstrating a remarkable 10% year-over-year growth. This robust construction sector growth has created substantial opportunities for acrylic adhesives in applications ranging from waterproofing and weather-sealing to crack sealing and structural bonding. The increasing focus on sustainable construction practices and green building initiatives has further accelerated the adoption of environmentally friendly adhesive solutions across the region.
The automotive sector is undergoing a revolutionary shift toward electric vehicles, creating new opportunities for specialized adhesive applications. China's electric vehicle market is projected to achieve a 60% adoption rate by 2030, accounting for more than 40% of global new EV sales. This transition necessitates advanced bonding solutions for battery assemblies, lightweight materials, and structural components. The growing emphasis on vehicle weight reduction and improved fuel efficiency has led to increased utilization of advanced acrylic adhesives in automotive manufacturing processes.
The rapid expansion of e-commerce across the region has revolutionized packaging requirements and adhesive applications. Thailand's e-commerce sector exemplifies this trend, with projected growth rates of 8% annually between 2021 and 2025, significantly outpacing the global average of 6%. The packaging industry has responded to this growth with innovations in sustainable packaging solutions, with Thailand's packaging sector expected to reach 197.7 million tons in 2022. This evolution has driven demand for specialized acrylic adhesives that offer superior bonding properties while meeting environmental regulations.
The region's manufacturing capabilities continue to evolve, with Asia-Pacific maintaining its position as a global manufacturing hub, consistently accounting for 38-40% of global adhesive demand. This manufacturing strength has fostered technological advancements in adhesive formulations, particularly in water-borne and UV-cured technologies. The industry has witnessed significant investments in research and development, focusing on developing adhesives with enhanced performance characteristics such as faster curing times, improved durability, and better environmental sustainability profiles. These innovations have enabled manufacturers to meet increasingly stringent regulatory requirements while addressing the evolving needs of end-user industries. The Asian adhesive market is poised for continued growth as these trends unfold.
Asia-Pacific Acrylic Adhesives Market Trends and Insights
Fast paced growth of e-commerce industry in developing nations to augment the industry
- Packaging is mainly used for protection, containment, information, utility, and promotion. This makes packaging an integral part of most industries. In 2017, packaging usage accounted for 2.5 billion ton of packaging, including paper and paperboard and plastic packaging. In 2020, due to the COVID-19 pandemic, the market registered a negative growth rate of 7.4% due to disruptions in the supply chain, shortage of packaging material, restrictions on the import and export of goods, and factories operating at low capacity.
- Governments of different Asian countries have taken steps to reduce the use of plastic, as China and Indonesia are the first and second-largest contributors to plastic waste in the ocean. China has announced new restrictions on excessive packaging, requiring all food and cosmetics producers to adhere to specific guidelines determining the volume of packaging allowed in proportion to a product. The extended producer responsibility (EPR) regulation imposed by the Indonesian government will oblige producers and retailers to redesign their product packaging to include a higher proportion of recyclable material.
- In 2021, the market registered a positive growth of 8%, with 2.7 billion ton of packaging material used for various purposes. The packaging industry is expected to keep growing due to the rising middle-income population, improvement of supply chains, and rising e-commerce activities, which have significantly boosted the packaging industry in the past few years as special packaging is required for shipping goods. The growing Asian market is expected to boost packaging usage, enabling it to register a CAGR of 5.7% during the forecast period (2022-2028).

Understand The Key Trends Shaping This Market
Download PDF
Raising investment to expand infrastructural activities will augment the industry size
- Asia-Pacific is driven by the world's major economies, such as China, Japan, and India. China is promoting and undergoing a process of continuous urbanization, with a target rate of 70% for 2030. The increased living spaces required in the urban areas resulting from increasing urbanization and the desire of middle-income urban residents to improve their living conditions may impact the housing market and, thereby, increase the residential constructions in the country.
- Non-residential infrastructure is likely to expand significantly. The Chinese government approved 26 infrastructure projects worth approximately USD 142 billion in 2019, with completion due in 2023. The country has the largest construction market globally, accounting for 20% of all worldwide construction investments. By 2030, the government plans to spend over USD 13 trillion on construction. Thus, the construction market is expected to register a 4.48% CAGR during the forecast period (2022-2028).
- The construction industry is one of the largest industries in Asia-Pacific and recorded promising growth in 2019. The industry continues to grow as the region constitutes many developing countries such as Vietnam, Malaysia, Indonesia, Thailand, and other South Asian countries. However, due to the COVID-19 pandemic, the construction sector witnessed a significant decline owing to lockdowns by governments across the region, which severely affected developing countries, including India, China, Japan, and ASEAN countries.
- The Asia-Pacific region is also witnessing significant interest from international investors in the construction space. Foreign Direct Investment (FDI) in the construction development sector is increasing as developing countries provide better returns and opportunities for investors.

Understand The Key Trends Shaping This Market
Download PDF
OTHER KEY INDUSTRY TRENDS COVERED IN THE REPORT
- Rapid growth of civil aviation will propel the aerospace industry
- Large concentration of footwear exporters in the Asia-Pacific region will facilitate the industry growth
- Increasing adoption of electric vehicles to drive the industry
Segment Analysis: End User Industry
Packaging Segment in Asia-Pacific Acrylic Adhesives Market
The packaging segment dominates the Asia-Pacific acrylic adhesives market, commanding approximately 49% market share in 2024. This significant market position is primarily driven by the extensive use of acrylic adhesives in pressure-sensitive applications such as labels, tapes, and flexible packaging solutions. The segment's dominance is further strengthened by the rapid growth of e-commerce across the region, particularly in China, which has created substantial demand for efficient and secure packaging solutions. The increasing popularity of online shopping, coupled with enhanced internet infrastructure and rising mobile phone usage, continues to drive the demand for packaging applications. Additionally, the implementation of sustainable packaging initiatives and the growing need for innovative packaging solutions in the food and beverage industry have contributed to the segment's market leadership.
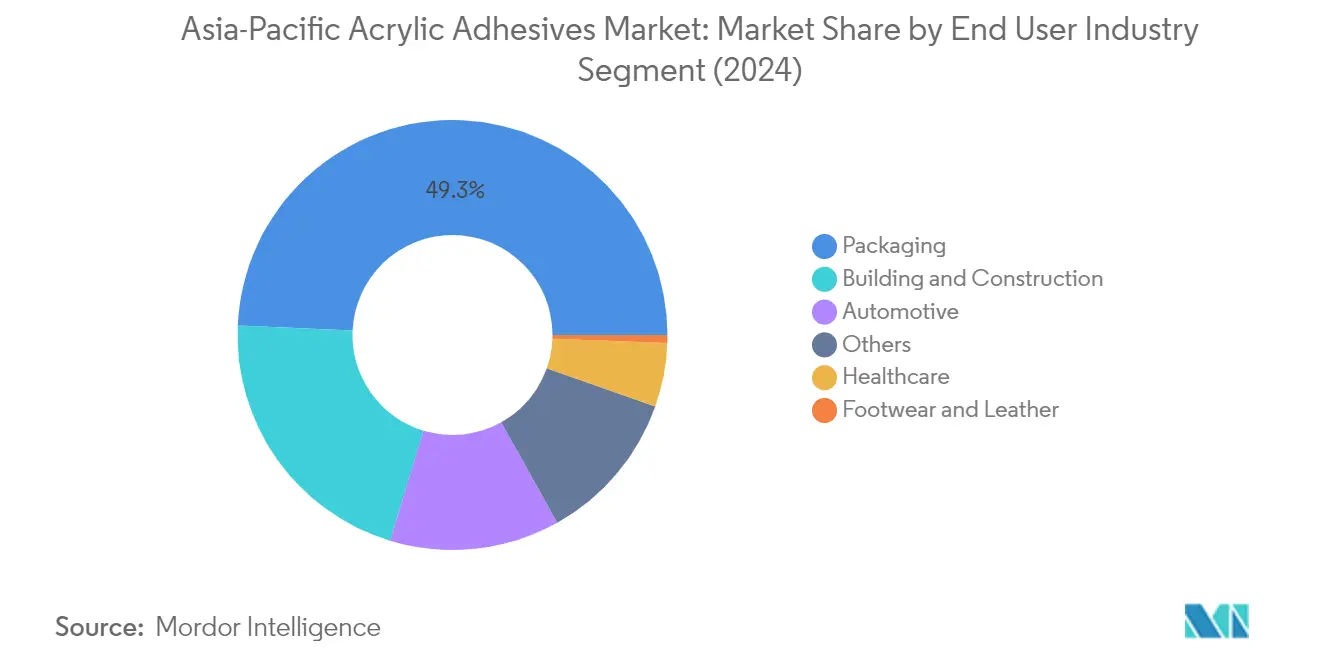
Building and Construction Segment in Asia-Pacific Acrylic Adhesives Market
The building and construction segment is emerging as the fastest-growing segment in the Asia-Pacific acrylic adhesives market. The segment is experiencing robust growth driven by extensive infrastructure development and urbanization initiatives across the region. China's construction market, which accounts for approximately 20% of global construction investments, is a major growth driver with plans to invest significantly in construction projects through 2028. The segment's growth is further supported by increasing adoption of modern construction techniques that require high-performance acrylic adhesives for applications such as flooring, roofing, and assembling prefabricated components. Additionally, government initiatives promoting sustainable construction practices and energy-efficient buildings are creating new opportunities for acrylic adhesive applications in the construction sector.
Remaining Segments in End User Industry
The automotive, healthcare, footwear and leather, and other industrial segments collectively represent significant opportunities in the Asia-Pacific acrylic adhesives market. The automotive segment is particularly noteworthy due to the growing electric vehicle production in the region, while the healthcare segment is driven by increasing demand for medical device assembly and disposable medical products. The footwear and leather segment, though smaller, maintains steady demand particularly in manufacturing hubs like China, India, and Vietnam. Other industrial applications, including electronics and aerospace, contribute to market diversity through specialized high-performance adhesive applications. These segments are experiencing varying growth rates influenced by technological advancements, regulatory requirements, and evolving industry needs.
Segment Analysis: Technology
Water-borne Segment in Asia-Pacific Acrylic Adhesives Market
Water-borne technology dominates the Asia-Pacific acrylic adhesives market, holding approximately 75% market share in 2024. The segment's prominence is driven by increasing environmental regulations favoring eco-friendly adhesive solutions with low VOC emissions. Water-borne acrylic adhesives are particularly popular in the healthcare industry due to their non-toxic nature and compatibility with medical device applications. These adhesives offer superior bonding capabilities for various substrates while maintaining high processing efficiency and quick curing properties. The automotive, aerospace, and healthcare industries show strong preference for water-borne acrylic adhesives due to their environmental sustainability and high performance characteristics. Additionally, the quick processing capability and strong adhesion to multiple substrates make these adhesives ideal for medical applications, including medical tapes and labeling.
UV Cured Segment in Asia-Pacific Acrylic Adhesives Market
The UV cured adhesives segment is emerging as the fastest-growing technology in the Asia-Pacific acrylic adhesives market, with strong growth potential through 2024-2029. These adhesives are gaining popularity due to their strong bonding capabilities and flexible curing times, making them particularly valuable in precision applications. The segment's growth is primarily driven by increasing demand in electronics manufacturing, aerospace applications, and healthcare sectors. UV cured acrylic adhesives offer unique advantages in terms of precision control during application and rapid curing properties, which significantly enhance manufacturing efficiency. The technology's ability to provide high-precision bonding while maintaining flexibility makes it particularly suitable for advanced manufacturing applications in electronics and aerospace industries.
Remaining Segments in Technology
The reactive and solvent-borne segments continue to maintain significant positions in the Asia-Pacific acrylic adhesives market. Reactive acrylic adhesives are particularly valued in automotive and heavy-duty applications where high strength and durability are essential. These adhesives provide excellent temperature resistance and permanent resilience, making them ideal for structural applications. Solvent-borne acrylic adhesives, while facing some regulatory challenges due to VOC content, remain important in specific applications where their unique properties are essential, such as in electronics and marine applications. Both technologies continue to evolve with manufacturers focusing on improving their performance characteristics while addressing environmental concerns.
Asia-Pacific Acrylic Adhesives Market Geography Segment Analysis
Acrylic Adhesives Market in China
China dominates the Asia-Pacific acrylic adhesives market, commanding approximately 53% of the total market value in 2024. The country's market leadership is primarily driven by its robust manufacturing sector, particularly in the packaging and electronics industries. The implementation of the country's sustainable packaging initiatives under the "14th Five-Year Plan" has significantly influenced the demand for environmentally friendly acrylic adhesives solutions. China's position is further strengthened by its dominant automotive sector, where acrylic adhesives are extensively used in electric vehicle manufacturing. The country's commitment to developing its EV ecosystem has created substantial opportunities for adhesive manufacturers. Additionally, China's construction industry, which accounts for about 20% of global construction investments, continues to be a major growth driver for acrylic adhesives, particularly in waterproofing and structural applications. The market is also benefiting from the country's rapid urbanization initiatives, with a target rate of 70% for 2030, driving demand in residential construction applications.
Acrylic Adhesives Market in India
India's acrylic adhesives market is projected to grow at approximately 7% CAGR from 2024 to 2029, emerging as the fastest-growing market in the region. The country's growth trajectory is strongly supported by its expanding manufacturing sector, particularly in the automotive and electronics industries. India's push towards becoming a global manufacturing hub through various government initiatives has created significant opportunities for adhesive manufacturers. The country's rapidly evolving e-commerce sector has substantially increased the demand for packaging solutions, directly impacting the consumption of acrylic adhesives. Furthermore, India's construction sector, which contributes significantly to the national GDP, continues to drive market growth through various infrastructure development projects. The country's focus on renewable energy projects, particularly in solar panel installations, has created additional demand for specialized acrylic adhesives. The market is also benefiting from increasing investments in research and development facilities by major manufacturers looking to develop customized solutions for local applications.
Acrylic Adhesives Market in Japan
Japan's acrylic adhesives market is characterized by its high-tech manufacturing sector and stringent quality standards. The country's market is primarily driven by its advanced automotive and electronics industries, where precision and reliability are paramount. Japan's focus on technological innovation has led to the development of specialized acrylic adhesives solutions, particularly in high-performance applications. The country's packaging industry has shown significant evolution, especially in sustainable packaging solutions, creating new opportunities for water-based acrylic adhesives. The market is further supported by Japan's robust aerospace sector, which has seen increased involvement in worldwide cooperative development of civil aircraft. The country's emphasis on quality and performance has made it a key market for premium acrylic adhesives products. Additionally, Japan's aging infrastructure renovation projects and earthquake-resistant construction requirements have created steady demand for structural adhesive applications.
Acrylic Adhesives Market in Indonesia
Indonesia's acrylic adhesives market demonstrates strong potential, driven by its expanding manufacturing base and growing domestic consumption. The country's strategic focus on developing its automotive sector, particularly in electric vehicle production, has created new opportunities for adhesive manufacturers. Indonesia's robust e-commerce growth has significantly impacted the packaging sector, driving demand for various adhesive solutions. The government's commitment to infrastructure development, including the construction of new airports and transportation facilities, has boosted the construction segment of the market. The country's growing electronics manufacturing sector has also emerged as a significant consumer of specialized acrylic adhesives. Furthermore, Indonesia's position as a major producer of consumer goods in Southeast Asia has created sustained demand for packaging applications. The market is also benefiting from increasing foreign direct investment in manufacturing facilities and the government's push towards industrial modernization.
Acrylic Adhesives Market in Other Countries
The acrylic adhesives market in other Asia-Pacific countries, including South Korea, Thailand, Malaysia, Singapore, and Australia, exhibits diverse growth patterns influenced by their respective industrial strengths. South Korea's market is primarily driven by its advanced electronics and automotive sectors, while Thailand's growth is supported by its strong automotive manufacturing base and expanding packaging industry. Malaysia's market benefits from its growing electronics manufacturing sector and increasing infrastructure developments. Singapore, despite its smaller size, maintains a significant market presence due to its high-tech manufacturing capabilities and role as a regional hub for aerospace maintenance, repair, and overhaul operations. Australia's market is characterized by its focus on construction and infrastructure development projects. These countries collectively contribute to the region's dynamic market landscape, each offering unique opportunities based on their industrial specializations and economic development stages.
Get Analysis on Important Geographic Markets
Download PDF
Competitive Landscape
Top Companies in Asia-Pacific Acrylic Adhesives Market
The leading companies in the acrylic adhesives market, including 3M, Henkel AG & Co. KGaA, Avery Dennison Corporation, Hubei Huitian New Materials, and Nanpao Resins, are focusing on strategic initiatives to maintain their competitive positions. Product innovation remains a key trend, with companies developing new generations of acrylic adhesives featuring improved bonding strength, faster curing times, and enhanced environmental sustainability. Operational agility has become crucial as manufacturers invest in R&D facilities and technology centers across the region to better serve local markets and respond quickly to changing customer needs. Companies are expanding their manufacturing footprint through greenfield investments and strategic partnerships, particularly in high-growth markets like China and India. The industry has also witnessed an increased focus on developing specialized solutions for emerging applications in electric vehicles, electronics, and sustainable packaging.
Market Structure Shows Regional Manufacturing Dominance
The Asia-Pacific acrylic adhesives market exhibits a moderately fragmented structure with a mix of global conglomerates and regional specialists. Global players like 3M and Henkel leverage their extensive R&D capabilities, broad product portfolios, and established distribution networks to maintain strong market positions. However, regional manufacturers, particularly Chinese companies, have gained significant market share through cost advantages and a deep understanding of local market requirements. The market has seen increasing participation from local players who focus on specific end-user segments or geographical regions, creating a competitive environment that balances global expertise with local market knowledge.
The industry has witnessed strategic consolidation through mergers and acquisitions, particularly as companies seek to strengthen their presence in high-growth markets and acquire technological capabilities. Global players are increasingly partnering with or acquiring local manufacturers to expand their regional footprint and access established distribution networks. Meanwhile, regional players are forming strategic alliances to enhance their technical capabilities and expand their product offerings. This dynamic has led to a market structure where success depends on balancing scale advantages with local market responsiveness.
Innovation and Sustainability Drive Future Success
For incumbent companies to maintain and increase their market share, developing innovative products aligned with emerging industry trends will be crucial. This includes focusing on environmentally friendly formulations with lower VOC emissions, faster curing times, and improved bonding strength for new materials used in electric vehicles and electronics. Companies must also invest in digital capabilities to enhance customer service and technical support while strengthening their distribution networks to ensure reliable product availability. Building strong relationships with key end-users in growing sectors like packaging, electronics, and automotive will be essential for maintaining competitive advantages.
For contenders looking to gain ground, success will depend on identifying and serving niche market segments underserved by larger players. This includes developing specialized products for specific applications or focusing on regional markets with unique requirements. Companies must also consider potential regulatory changes, particularly regarding environmental standards and VOC emissions, which could create opportunities for innovative solutions. The ability to offer competitive pricing while maintaining product quality will remain important, especially in price-sensitive markets. Additionally, building technical expertise and offering superior customer service can help smaller players differentiate themselves in a crowded market.
Asia-Pacific Acrylic Adhesives Industry Leaders
3M
AVERY DENNISON CORPORATION
Henkel AG & Co. KGaA
Hubei Huitian New Materials Co. Ltd
NANPAO RESINS CHEMICAL GROUP
- *Disclaimer: Major Players sorted in no particular order

Need More Details on Market Players and Competitors?
Download PDF
Recent Industry Developments
- December 2021: Sika planned to establish a new technology center and manufacturing factory for high-quality adhesives and sealants in Pune, India. The company primarily manufactures products for the transportation and construction industries through its three new production lines.
- October 2021: 3M introduced a new generation of acrylic adhesives, including 3M Scotch-Weld Low Odor Acrylic Adhesive 8700NS Series, 3M Scotch-Weld Flexible Acrylic Adhesive 8600NS Series, and 3M Scotch-Weld Nylon Bonder Structural Adhesive DP8910NS.
- July 2021: H.B. Fuller announced a strategic agreement with Covestro to offer sustainable adhesives in the market.
Asia-Pacific Acrylic Adhesives Market Report Scope
Aerospace, Automotive, Building and Construction, Footwear and Leather, Healthcare, Packaging are covered as segments by End User Industry. Reactive, Solvent-borne, UV Cured Adhesives, Water-borne are covered as segments by Technology. Australia, China, India, Indonesia, Japan, Malaysia, Singapore, South Korea, Thailand are covered as segments by Country.End User Industry
| Aerospace |
| Automotive |
| Building and Construction |
| Footwear and Leather |
| Healthcare |
| Packaging |
| Other End-user Industries |
Technology
| Reactive |
| Solvent-borne |
| UV Cured Adhesives |
| Water-borne |
Country
| Australia |
| China |
| India |
| Indonesia |
| Japan |
| Malaysia |
| Singapore |
| South Korea |
| Thailand |
| Rest of Asia-Pacific |
| End User Industry | Aerospace |
| Automotive | |
| Building and Construction | |
| Footwear and Leather | |
| Healthcare | |
| Packaging | |
| Other End-user Industries | |
| Technology | Reactive |
| Solvent-borne | |
| UV Cured Adhesives | |
| Water-borne | |
| Country | Australia |
| China | |
| India | |
| Indonesia | |
| Japan | |
| Malaysia | |
| Singapore | |
| South Korea | |
| Thailand | |
| Rest of Asia-Pacific |
Need A Different Region or Segment?
Customize Now
Market Definition
- End-user Industry - Building & Construction, Packaging, Automotive, Aerospace, Woodworking & Joinery, Footwear & Leather, Healthcare, and Others are the end-user industries considered under the acrylic adhesives market.
- Product - All acrylic adhesive products are considered in the market studied
- Resin - Under the scope of the study, different kinds of acrylate monomers, like 2-Ethylhexyl acrylate and butyl acrylate are considered
- Technology - For the purpose of this study, Water-borne, Solvent-borne, Reactive, Hot Melt, and UV Cured adhesive technologies are taken into consideration.
| Keyword | Definition |
|---|---|
| Hot-melt Adhesive | Hot melt adhesives are generally 100% solid formulations, based on thermoplastic polymers. They are solid at room temperature and are activated upon heating above their softening point, at which stage they are liquid, and hence, can be processed. |
| Reactive Adhesive | A reactive adhesive is made up of monomers that react in the adhesive curing process and do not evaporate from the film during use. Instead, these volatile components become chemically incorporated into the adhesive. |
| Solvent-borne Adhesive | Solvent-borne adhesives are mixtures of solvents and thermoplastic, or slightly cross-linked polymers, such as polychloroprene, polyurethane, acrylic, silicone, and natural and synthetic rubbers (elastomers). |
| Water-borne Adhesive | Water-borne adhesives use water as a carrier or diluting medium to disperse a resin. They are set by allowing the water to evaporate or be absorbed by the substrate. These adhesives are compounded with water as a diluent, rather than a volatile organic solvent. |
| UV Cured Adhesive | UV curing adhesives induce curing and create a permanent bond without heating by using ultraviolet (UV) light or other radiation sources. An aggregation of monomers and oligomers is cured or polymerized by ultraviolet (UV) or visible light in a UV adhesive. Because UV is a radiating energy source, UV adhesives are often referred to as radiation curing or rad-cure adhesives. |
| Heat-resistant Adhesive | Heat-resistant Adhesives refer to those that do not break down under high temperatures. One aspect of a complicated system of circumstances is the adhesive's capacity to withstand disintegration brought on by high temperatures. As the temperature rises, adhesives may liquefy. They can withstand stresses resulting from differing coefficients of expansion and contraction, which might be an additional advantage. |
| Reshoring | Reshoring is the practice of moving commodity production and manufacturing back to the nation where the business was founded. Onshoring, inshoring, and back shoring are further terms used. Offshoring, the practice of producing items abroad to lower labor and manufacturing costs, is the opposite of this. |
| Oleochemicals | Oleochemicals are compounds produced from biological oils or fats. They resemble petrochemicals, which are substances made from petroleum. The oleochemical business is built on the hydrolysis of oils or fats. |
| Nonporous Materials | Nonporous materials are substances that do not permit the passage of liquid or air. Nonporous materials are those that are not porous, such as glass, plastic, metal, and varnished wood. Since no air can get through, less airflow is required to raise these materials, negating the requirement for high airflow. |
| EU-Vietnam Free Trade Agreement | A trade agreement and an investment protection agreement were concluded between the European Union and Vietnam on June 30, 2019. |
| VOC content | Compounds with limited solubility in water and high vapor pressure are known as Volatile Organic Compounds (VOCs). Many VOCs are human-made chemicals that are used and produced in the manufacture of paints, pharmaceuticals, and refrigerants. |
| Emulsion Polymerization | Emulsion polymerization is a method of producing polymers or connected groups of smaller chemical chains known as monomers, in a water solution. The method is often used to make water-based paints, adhesives, and varnishes, in which the water stays with the polymer and is marketed as a liquid product. |
| 2025 National Packaging Targets | In 2018, the Australian Environment Ministry set the following 2025 National Packaging Targets: 100% of the packaging must be reusable, recyclable, or compostable by 2025, 70% of plastic packaging must be recycled or composted by 2025, 50% of average recycled content must be included in packaging by 2025, and problematic and unnecessary single-use plastic packaging must be phased out by 2025. |
| Russian Government’s Import Substitution Policy | The Western sanctions suspended the distribution of several high-tech items to Russia, including those required by the raw material export sectors and the military-industrial complex. In response, the government launched an "import substitution" scheme, appointing a special commission to oversee its implementation in early 2015. |
| Paper Substrate | Paper substrates are paper sheets, reels, or boards with a base weight of up to 400 g/m2 that has not been converted, printed or otherwise altered. |
| Insulation Material | A material that inhibits or blocks heat, sound, or electrical transmission is known as Insulation Material. The variety of insulation materials includes thick fibers like fiberglass, rock and slag wool, cellulose, and natural fibers as well as stiff foam boards and sleek foils. |
| Thermal Shock | A temperature change known as thermal shock generates stress in a material. It commonly results in material breakdown and is especially prevalent in brittle materials like ceramics. When there is a quick temperature change, either from hot to cold or vice versa, this process occurs abruptly. It occurs more frequently in materials with poor heat conductivity and insufficient structural integrity. |
Need More Details on Market Definition?
Ask a Question
Research Methodology
Mordor Intelligence follows a four-step methodology in all our reports.
- Step-1: Identify Key Variables: The quantifiable key variables (industry and extraneous) pertaining to the specific product segment and country are selected from a group of relevant variables & factors based on desk research & literature review; along with primary expert inputs. These variables are further confirmed through regression modeling (wherever required).
- Step-2: Build a Market Model: In order to build a robust forecasting methodology, the variables and factors identified in Step-1 are tested against available historical market numbers. Through an iterative process, the variables required for market forecast are set and the model is built on the basis of these variables.
- Step-3: Validate and Finalize: In this important step, all market numbers, variables and analyst calls are validated through an extensive network of primary research experts from the market studied. The respondents are selected across levels and functions to generate a holistic picture of the market studied.
- Step-4: Research Outputs: Syndicated Reports, Custom Consulting Assignments, Databases & Subscription Platforms

Get More Details On Research Methodology
Download PDF


