
Market Overview
| Study Period | 2020 - 2031 |
|---|---|
| Forecast Data Period | 2026 - 2031 |
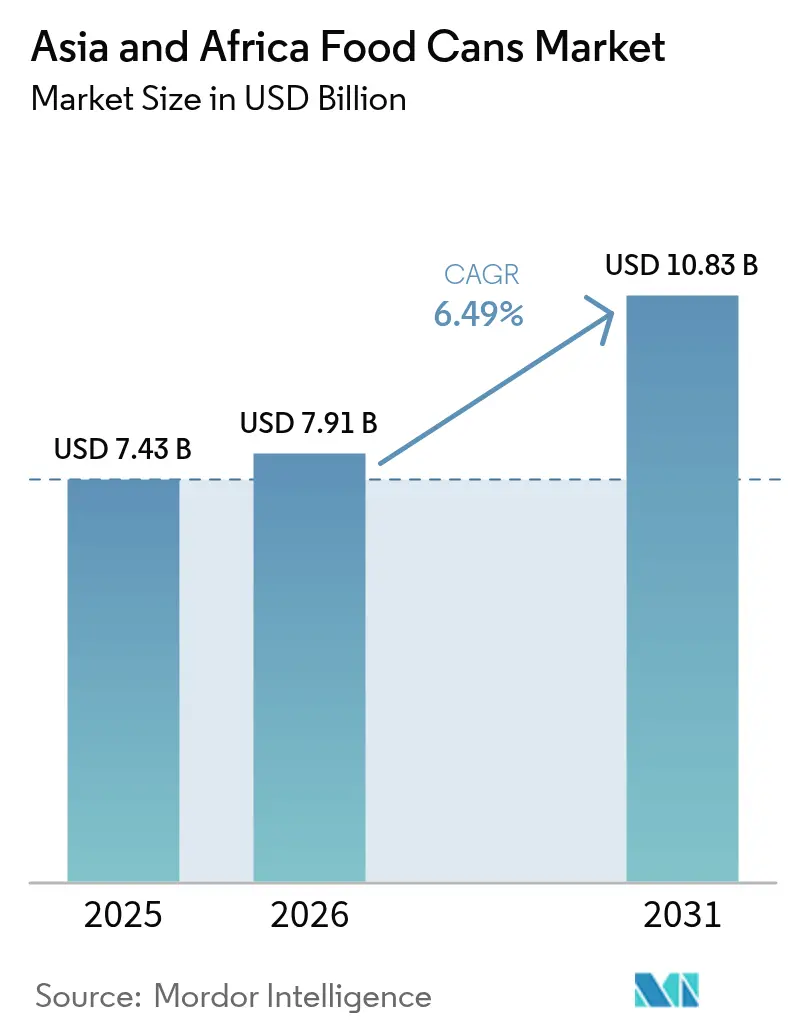
| Base Year Market Size (2025) | USD 7.43 Billion |
| Market Size (2026) | USD 7.91 Billion |
| Market Size (2031) | USD 10.83 Billion |
| Growth Rate (2026 - 2031) | 6.49 % |
| Market Concentration | Medium |
Major Players *Disclaimer: Major Players sorted in no particular order Image © Mordor Intelligence. Reuse requires attribution under CC BY 4.0. | |
Asia And Africa Food Cans Market Analysis by Mordor Intelligence
Asia and Africa food cans market size in 2026 is estimated at USD 7.91 billion, growing from 2025 value of USD 7.43 billion with 2031 projections showing USD 10.83 billion, growing at 6.49% CAGR over 2026-2031. Population growth, rapid urban migration, and limited cold-chain capacity underpin sustained demand for shelf-stable foods, while government circular-economy mandates elevate metal packaging over plastics. Aluminum price volatility and tinplate supply disruptions temper margins for converters, yet scale efficiencies and process automation help large manufacturers preserve profitability. Two-piece technology adoption rises as producers optimize material use, and easy-open ends expand penetration in line with consumers’ convenience expectations. Regional processors increasingly add QR-code authentication to assure food safety and traceability, reinforcing confidence in the Asia and Africa food cans market.
Key Report Takeaways
- By material, steel and tin captured 56.15% of the Asia and Africa food cans market share in 2025.
- By can type, the Asia and Africa food cans market size for the three-piece construction segment is projected to grow at a 7.05% CAGR between 2026-2031.
- By application, processed food captured 25.02% of the Asia and Africa food cans market share in 2025.
- By opening type, the Asia and Africa food cans market size for the standard ends segment is projected to grow at a 7.26% CAGR between 2026-2031.
- By geography, Asia captured 60.55% of the Asia and Africa food cans market share in 2025.
Note: Market size and forecast figures in this report are generated using Mordor Intelligence’s proprietary estimation framework, updated with the latest available data and insights as of 2026.
Asia And Africa Food Cans Market Trends and Insights
Drivers Impact Analysis*
| Driver | (~) % Impact on CAGR Forecast | Geographic Relevance | Impact Timeline |
|---|---|---|---|
| High Recyclable Score of Metal Cans Over Alternatives | +1.8% | Global, early gains in China, South Korea, Thailand | Medium term (2-4 years) |
| Demand for Canned Foods Driven by Cost and Convenience Advantages | +2.1% | APAC core, spill-over to MEA, early gains in Jakarta, Manila, Lagos | Short term (≤ 2 years) |
| Product Innovations Increasing Shelf Life | +1.2% | Asia Pacific, selective MEA markets | Medium term (2-4 years) |
| Surge in Ready-to-Eat Seafood Exports From Southeast Asia | +1.7% | Southeast Asia, export corridors to Middle East and Africa | Short term (≤ 2 years) |
| Government Circular-Economy Mandates Pushing Metal Packaging | +1.4% | China, India, South Africa, Thailand | Long term (≥ 4 years) |
| Rise of Smart Can Tracking for Anti-Counterfeit Assurance | +0.8% | China, India, premium segments across Asia | Medium term (2-4 years) |
| Source: Mordor Intelligence | |||
High Recyclable Score of Metal Cans Over Alternatives
Metal cans achieve recyclability rates above 90% in mature markets, positioning them favorably against plastics that face escalating regulatory scrutiny. South Africa’s Extended Producer Responsibility program, in effect since 2021, imposes differentiated per-ton fees that financially reward highly recyclable substrates. China’s convenience-store chain Bianlifeng has rolled out QR-code systems across 1,500 outlets to verify product authenticity, showcasing the digital potential of metal packaging.[1] In Tanzania’s Arusha city, municipal scrap collection exceeds 314 tonnes per month, resulting in conserved virgin iron ore and energy savings, and signaling to policymakers that the circular value of the Asia and Africa food cans market can be monetized locally. ISO 14001 certification is now a common selection criterion for multinational food processors, reinforcing the competitive edge of recyclable cans.
Demand for Canned Foods Driven by Cost and Convenience Advantages
Urban lifestyles compress meal-preparation time, pushing households toward shelf-stable proteins and vegetables. Indonesia hosts more than 41,000 grocery outlets, giving canned products deep retail reach. Nigerian shoppers increasingly prize nutrition and food safety, and packaging that communicates integrity drives brand preference. Limited refrigerators in peri-urban districts make canned fish and meats the reliable protein of choice. Vietnam’s seafood industry shipped USD 9.2 billion worth of processed products by November 2024, illustrating how canning converts perishable marine harvests into exportable value. HACCP and GMP requirements remain entry tickets to regional supermarket shelves.
Product Innovations Increasing Shelf Life
Regulatory action against bisphenol A accelerates the transition to BPA-non-intent linings. The European Union’s 2024/3190 regulation bans BPA across food-contact materials, prompting converters to field acrylic and polyester alternatives. Toyochem’s Lionova series meets the new thresholds with styrene below detection limits, providing converters with compliant coatings. Thailand’s Ministry of Industry raised hot-fill resistance to 100 °C, driving research into high-temperature polymers that protect food integrity. Integrating freshness sensors and time-temperature indicators furthers shelf-life extension and transparency.
Surge in Ready-to-Eat Seafood Exports From Southeast Asia
Thailand produced 630,434 tons of canned tuna in 2024, channeling 91.9% to overseas buyers. Exporters now customize formulations for halal markets; shipments to the Middle East and Africa rose to 37% of volume in early 2025. Vietnam’s processors offset raw-material shortages by pivoting to value-added lines, lifting shrimp exports 22% in 2024. Malaysia’s record 2,117 MT canned-tuna imports in Q1 2024 underline intra-ASEAN trade momentum. Certification under the Marine Stewardship Council strengthens premium positioning.
Restraints Impact Analysis*
| Restraint | (~) % Impact on CAGR Forecast | Geographic Relevance | Impact Timeline |
|---|---|---|---|
| Plastic Remains a Credible Alternative | -1.3% | Global, competitive pressure in flexible packaging | Short term (≤ 2 years) |
| Price Volatility of Aluminum and Steel | -1.7% | Asia-Pacific hubs, import-dependent African markets | Short term (≤ 2 years) |
| Fragmented Cold-Chain Infrastructure in Emerging African Markets | -0.8% | Sub-Saharan Africa | Long term (≥ 4 years) |
| Slow Uptake of BPA-Free Linings | -0.6% | Premium segments, export-oriented manufacturers | Medium term (2-4 years) |
| Source: Mordor Intelligence | |||
Plastic Remains a Credible Alternative
Flexible packs threaten cans in single-serve SKU lines. Rwanda’s plastic ban raised per-unit costs five-fold for certain goods, showing that outright prohibition is not cost-neutral. West Africa’s Mohinani Group built 30,000 tpa rPET plants in Ghana and Nigeria, giving converters low-carbon resin options. Tetra Recart cartons position themselves as 6 times lighter on the environment than tin cans for pet food. Yet cans still support retort temperatures above 121 °C, essential for institutional formats and emergency-relief rations.
Price Volatility of Aluminum and Steel
A projected 16 million-ton aluminum deficit by 2030 requires USD 60-90 billion investment, stressing supply security.[2] China removed the 13% VAT rebate on aluminum semis, and capped smelter capacity at 45 million tons, elevating regional premiums. Tin mine shutdowns in the Democratic Republic of Congo disrupted supply, spiking tinplate costs. LME aluminum inventories fell 10% and SHFE stocks 30% in May 2025, exposing buyers to bigger spreads. Hedging strategies and multiregional sourcing emerge as survival levers in the Asia and Africa food cans market.
*Our forecasts treat driver/restraint impacts as directional, not additive. The impact forecasts reflect baseline growth, mix effects, and variable interactions.
Segment Analysis
By Material: Aluminum Gains Ground Despite Steel Dominance
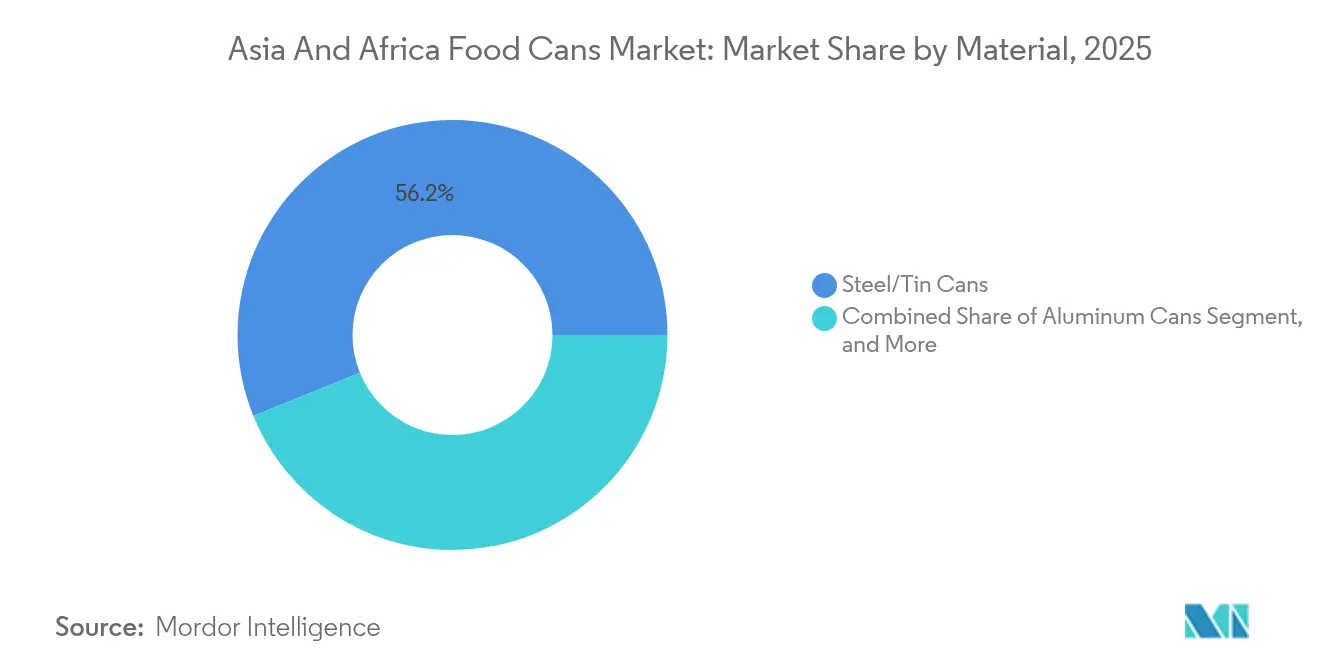
Steel and tin drums accounted for 56.15% of the Asia and Africa food cans market share in 2025, driven by established supply chains and price advantages associated with high-volume integrated steel mills in Guangdong and Jiangsu. The segment preserves competitive pricing for institutional tomato paste and large-format fruit cocktail, anchoring the Asia and Africa food cans market size at USD 4.17 billion that year. Producers utilize continuous annealing and chrome-free passivation to comply with EU food-contact regulations, while servo-controlled seamers enhance quality.
Aluminum cans are expected to grow at a 7.85% CAGR to 2031, driven by beverage converters transferring expertise to food lines and as recycling targets favor lightweight alloys. Crown Holdings grew global beverage-can income 24% year-over-year in Q1 2025, demonstrating aluminum’s robust volume trajectory. Supply constraints paradoxically boost the segment’s perceived scarcity value; Indonesia hosts two-thirds of the 2025 smelter additions, but geographic dispersion raises freight costs. Environmental targets under ISO 14001 align multinational food processors with aluminum adoption, underpinning the Asia and Africa food cans market.

By Can Type: 2-Piece Technology Drives Efficiency Gains
Two-piece bodies controlled 66.94% market revenue in 2025, primarily through draw-and-iron lines that achieve high speed and low metal usage, crucial for cost-sensitive legumes and protein meals. Process automation includes in-line vision inspection and nitrogen dosing to extend headspace life. Crown transferred volumes from Ho Chi Minh City and Singapore into its Vung Tau super-plant, lowering conversion costs for regional accounts.
Three-piece formats show a 7.05% CAGR outlook, fueled by local tomato processors in Nigeria and Ghana that require variable heights and diameters. Dangote’s Kadawa complex runs 1,200 tons per day through three-piece welders optimized for 400 g tomato paste. The technology’s flexibility offsets its higher seam labor share, and laser side-seam welding narrows integrity gaps with two-piece bodies. Investments in automatic seam-powder sprinklers and internal lacquer ovens keep quality on par.
By Application: Pet Food Emerges as Growth Engine
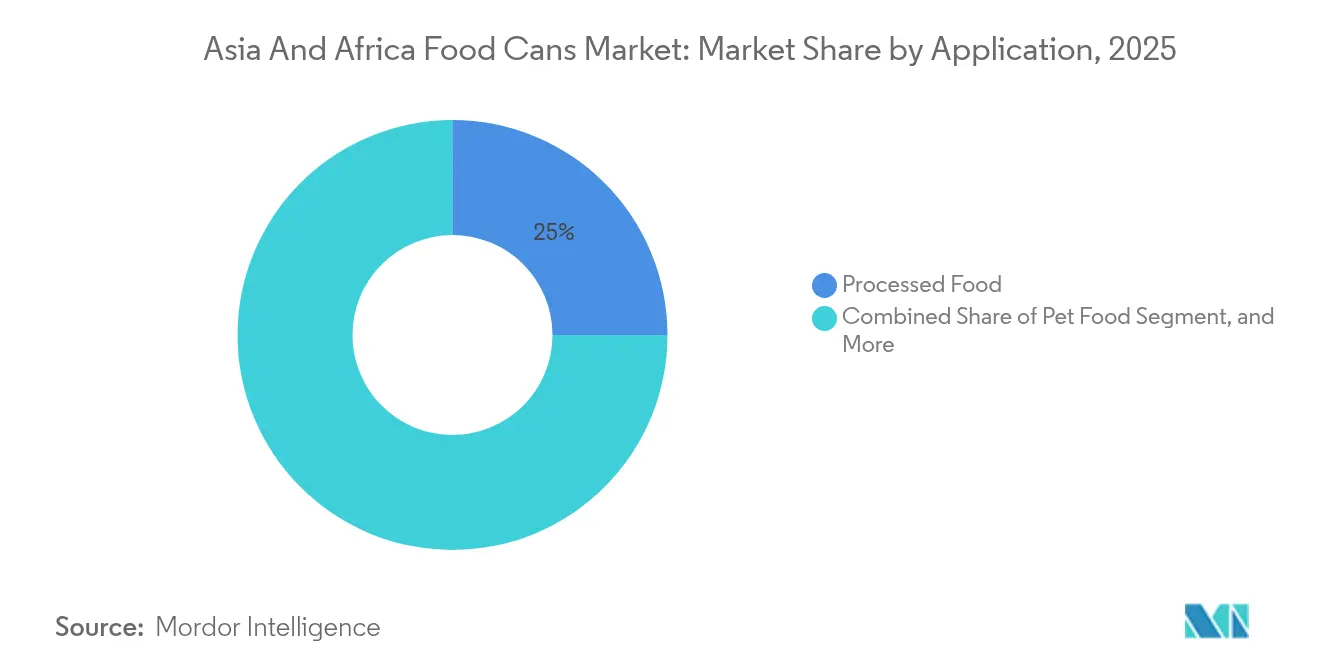
Processed food retained 25.02% market share in 2025, translating to USD 1.86 billion of the Asia and Africa food cans market size. Ready meals, beans, and condiments remain staples for urban consumers with limited cooking time. Indonesia, with 8,556 industrial processors, continues to anchor regional ingredient demand. HACCP audits and SQF-level traceability are now baseline requirements for supermarket listings.
Pet food delivers the fastest 8.44% CAGR, buoyed by a regional pet ownership boom. China’s pet-food sales reached EUR 18.3 billion (USD 19.8 billion) in 2023, yet packaged penetration is below 20%, illustrating vast headroom. Silgan noted that pet food constituted roughly 50% of its metal-container volumes with high-single-digit growth in Q3 2024. Asian brands differentiate through tuna-in-broth and grain-free formulations, which need hermetic retort packaging. Africa’s fledgling middle class mimics the trend, adopting premium wet diets for dogs and cats.
By Opening Type: Easy-Open Ends Gain Consumer Preference
Easy-open ends captured 62.12% share in 2025, equating to roughly 34 billion units across Asia and Africa. Pull-tab technology shortens meal prep and reassures safety through tamper evidence. Silgan’s Quick Top leads global supply, supported by its 2021 Easytech acquisition that added end-making presses in China and Italy. EOE growth aligns with modern retail penetration, as supermarkets promote convenience features.
Standard ends remain vital for 3 kg hotel cans and cost-sensitive commodities, and they register a headline 7.26% CAGR as Africa’s processors ramp production of institutional tomato paste and palm fruit concentrate. Simpler double-seam tooling and lower scrap make standard ends attractive to new entrants. Progress in laser score-line control inches standard ends closer to EOE functionality, blurring the gap.
Geography Analysis
Asia delivered 60.55% of 2025 revenue, underpinned by China’s integrated aluminum and steel ecosystems and Southeast Asia’s export-oriented seafood clusters. Crown Holdings manages 27 beverage-can and end plants across Asia, capitalizing on economies of density. Thailand shipped 630,434 tons of canned tuna in 2024, supporting global demand for ready-to-eat protein. Urbanization in India and Indonesia, plus rising per-capita incomes, sustain a 6.92% CAGR outlook. E-commerce penetration expands can consumption through direct-to-consumer grocery boxes, and QR-coded cans allow trace-back to farm origins, fortifying the Asia and Africa food cans market.
Africa contributed 39.45% of 2025 value, with Nigeria, Ghana, and Egypt spearheading capacity builds in tomato, fruit, and legume lines. South Africa’s Extended Producer Responsibility framework rewards the recyclability advantage that cans possess over multilayer flexibles. Supply-chain hurdles persist: port congestion, currency depreciation, and rural logistics add costs. Yet shelf-stable foods fill protein gaps where refrigeration is scarce, anchoring growth. Halal certification drives alignment with Muslim dietary codes across North and West African markets, and local brands increasingly badge cans with dual Arabic and English labeling to broaden reach.
The medium-term prospect shows both regions responding to price volatility through hedging and supplier diversification. Tinplate users source from Taiwan and Turkey to mitigate African mine disruptions, while aluminum purchasers negotiate tolling deals with Middle-Eastern smelters to bypass Chinese export taxes. Sustained infrastructure spending and digital traceability adoption underpin an Asia and Africa food cans market expected to cross USD 10.83 billion by 2031.
Regulatory Landscape
Food-can producers in Asia and Africa operate under tightening food-contact safety regimes and labeling requirements that increasingly emphasize composition control, migration testing, and traceability. In Asia, Japan completed the transition to a positive list system for synthetic food container and packaging materials on June 1, 2025, tightening supplier qualification and documentation expectations. South Korea further updated its standards for food-contact utensils, containers, and packages via MFDS Notice No. 2026-24, effective March 27, 2026, including revised specifications such as migration limits for certain substances and a higher compliance load for coatings, inks, and sealants used on metal cans and ends.
China signaled continued regulatory modernization by notifying the WTO on August 29, 2025 of a new National Food Safety Standard covering general safety requirements for food contact materials, intended to replace elements of the GB 4806 framework. This update affects conformity assessments for can coatings and additives used by regional converters and exporters. In Africa, compliance remains more country-specific, with national agencies and standards bodies shaping requirements for imported and locally produced packaging. For example, Nigeria’s NAFDAC issued a 2025 draft focused on labeling requirements for non-retail containers of food, which impacts institutional can formats and cross-border shipments. Regional harmonization work aligned to Codex guidance continues to be a reference point for food safety legislation, but implementation still depends on national enforcement and testing capacity.
Value Chain Analysis
The value chain runs from upstream metal and chemical inputs (tinplate, aluminum, steel sheet, and food-contact coatings) through conversion (sheet slitting, body forming, welding or draw-and-iron, end making, lacquering and curing, decoration). Downstream steps include filling, retorting, distribution, and post-consumer collection for recycling. Asia benefits from denser integrated ecosystems where steel and tinplate supply, can making, and high-volume seafood and processed-food filling co-locate. This supports high-speed two-piece production and large end-making platforms.
Compliance and quality infrastructure increasingly gates access to modern retail and export corridors, reinforcing the role of established converters with validated coating systems and seam-performance controls. In Africa, converters and fillers manage greater variability in substrate availability, logistics, and foreign-exchange exposure, so supply strategies rely more on sourcing diversification and selective vertical integration. A specific example is Nestle Ghana’s Tema factory, which operates as a fully integrated manufacturing hub for West Africa with an internal can manufacturing department supporting shelf-stable products such as evaporated milk. This reduces dependence on imported intermediates for fillers. On the independent converter side, Africa Crowns & Packaging expanded its footprint by opening a facility in Accra, Ghana in 2025, strengthening local availability of cans and related packaging services. Downstream, scrap collection and aggregation remain critical to feed metal recycling loops, while fragmented national requirements, including labeling and testing for imported packaging, shape how empty cans and ends are traded across borders.
Competitive Landscape
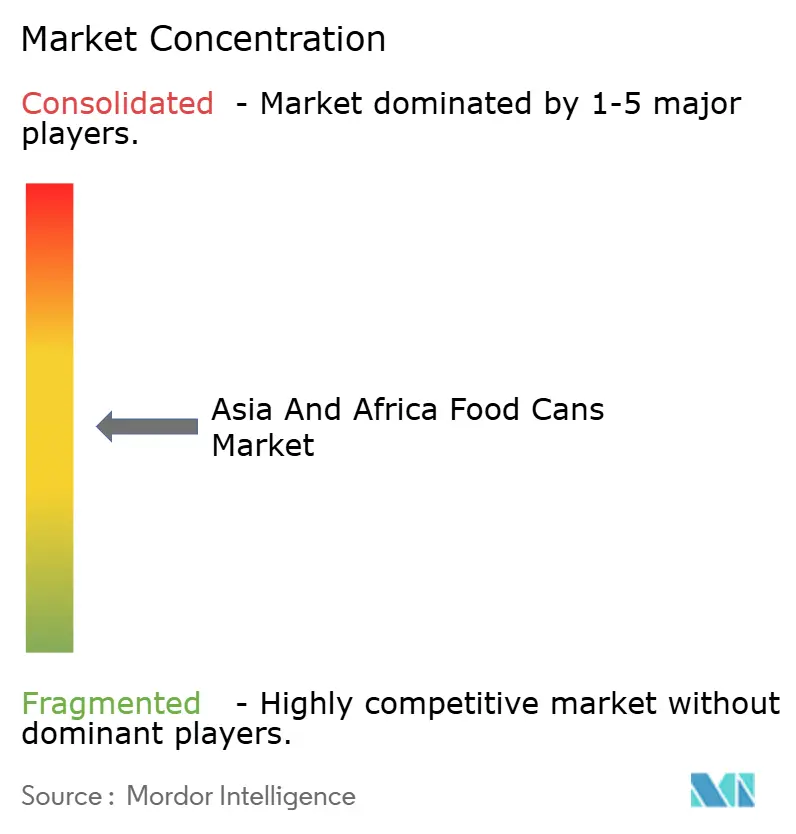
The Asia and Africa food cans market features moderate concentration. Crown Holdings and Silgan Holdings combine robust regional footprints with long-term purchase agreements that secure equipment utilization above 90%, defending margins even as substrate prices fluctuate. Crown’s Vung Tau consolidation lifted operating efficiency, while Silgan locked 90% of projected 2024 sales into multi-year supply contracts.
Regional specialists such as CPMC Holdings in China, Kian Joo in Malaysia, and Nampak in South Africa leverage proximity to fillers and localized logistics to defend niches. Nampak’s alliance with Coca-Cola Beverages Africa provides steady end-market off-take, whereas Kian Joo supplies halal-certified seafood cans across ASEAN. Investment in quick-change press tooling lets mid-tiers handle SKU proliferation cost-effectively.
Technology racelines focus on QR-code serialization, BPA-non-intent linings, and lightweight necked-in designs that shave grams without compromising stacking. Firms attaining ISO 9001 and FSSC 22000 demonstrate quality stewardship, winning multinational tenders. Material inflation and greater environmental disclosure oblige converters to renegotiate pass-through clauses with brand owners, and those lacking scale risk margin squeeze. Collaborative recycling programs are emerging as brand–converter joint ventures to safeguard post-consumer metal supply, securing closed-loop credentials for the Asia and Africa food cans market.
Asia And Africa Food Cans Industry Leaders
-
Asia Can Co. Ltd
-
Toyo Seikan Group Holdings Ltd
-
Kaira Can Private Limited
-
Ardagh Group S.A.
-
Crown Holdings Inc.
- *Disclaimer: Major Players sorted in no particular order
Market Opportunities and Future Outlook
A key opportunity sits at the intersection of circular-economy mandates and food-contact compliance. Brand owners and can makers can differentiate through verified traceability, certified management systems such as ISO 14001, and validated low-migration coating packages aligned to evolving Asian standards. With easy-open ends already a high-volume format in the region (about 34 billion units in 2025), whitespace extends to convenience-led closures and anti-counterfeit features beyond premium SKUs, including QR-code authentication and serialization workflows that food processors reference for safety assurance and export confidence.
Competition from alternative packaging is also reshaping investment priorities, increasing the need for metal can value propositions that emphasize recyclability, retort performance, and food safety documentation. Recent funding and industrial programs focused on circular packaging in the region highlight active capital deployment around packaging sustainability. Circulate Capital’s first close of Asia Fund II in March 2026 targets recycling and circular supply chains across multiple Asian markets, raising the bar for converters on recycled-content narratives, life-cycle reporting, and collection partnerships. At the same time, large-scale food-grade rPET projects announced in Nigeria in 2026 point to how quickly competing substrates are building local circular infrastructure, intensifying the case for metal-can stakeholders to secure scrap supply through structured collection programs. It also increases pressure to strengthen compliance-led procurement with multinational fillers operating across Asia and Africa.
Recent Industry Developments
- May 2026: Toyo Seikan Group Holdings Ltd. announced its Open Up 20-30 medium-term management plan, outlining JPY 350 billion of investment over five years with an emphasis on expanding production facilities and pursuing M&A in Southeast Asia (including Vietnam, Malaysia, Indonesia, and Thailand). The program indicates continued capacity and capability build-out in key can-consuming and can-exporting hubs, shaping competitive intensity and technology upgrading across regional metal packaging supply chains.
- April 2026: Crown Holdings Inc. announced the establishment of a state-of-the-art beverage can manufacturing facility in Northern India with two production lines designed to produce around 2.2 billion cans annually. While beverage-focused, the added regional can-making footprint and supplier ecosystem development can spill over into food-can capability and procurement leverage for shared inputs such as sheet, ends, and coatings.
- September 2025: Crown Holdings partnered with San Juan Beverage Company to supply cans for the Bammarita cocktail launch. The partnership reinforced Crown’s positioning in premium can formats and customer programs, supporting higher-value specifications that can translate into food-can decoration, end features, and line-performance requirements in adjacent shelf-stable categories.
Research Methodology Framework and Report Scope
Market Definition and Coverage
We define this market as the value of metal food cans used to pack shelf stable food across Asia and Africa, counted at the point where cans are supplied into food manufacturing and packing.
Scope exclusions: Aerosol cans, beverage cans, and non-metal food packaging formats (such as pouches, cartons, glass, and plastic) are excluded.
Segmentation Overview
- By Material
- Aluminum Cans
- Steel/Tin Cans
- By Can Type
- 2-Piece
- 3-Piece
- By Application
- Fish and Seafood
- Fruits and Vegetables
- Processed Food
- Pet Food
- Other Applications
- By Opening Type
- Easy-Open End
- Standard End
- By Geography
- Asia
- China
- India
- South Korea
- Southeast Asia
- Africa
- South Africa
- Asia
Data Sources, Market Sizing, and Validation
Desk Research
Desk research starts by building the demand context for canned food and the supply context for metal packaging in Asia and Africa. We reference public sources such as UN Comtrade for trade flows of cans and related metal packaging inputs, World Bank and IMF indicators for population and income trends, FAO statistics for food processing output signals, and UNIDO industrial statistics for manufacturing activity where available.
On the industry side, we review disclosures and public material such as annual reports and investor presentations from packaging and food processing companies, relevant food packaging association releases, and reputable business press coverage on capacity additions and plant commissioning. Where a subscription database is available to us, it is used mainly to standardize company financials, patent lookups for can making and easy open ends, and shipment level import export checks. The sources listed above are illustrative, and many other public references were reviewed to collect, validate, and clarify the final assumptions.
Primary Interviews and Surveys
Our interviews and surveys across Asia and Africa cover can makers, food processors, buyers, distributors, and specialists. We use their input to test secondary data, fill gaps on output, pricing, material mix, and format adoption, and reconcile conflicting assumptions before country totals are set.
Distribution of primary research fieldwork respondents
| Company type | Respondent position |
|---|---|
| Top tier: 28% | CXOs: 18% |
| Mid tier: 47% | Functional/Unit leaders: 32% |
| Smaller Players: 25% | Managers: 50% |
Market-Sizing & Forecasting
The core sizing uses a top-down build that reconstructs the can demand pool from packaged food production signals, trade and manufacturing activity, and the observed penetration of metal cans by food category in the two regions. Once the regional totals are formed, we corroborate them with selective bottom-up checks, such as rolling up a sampled set of can supplier revenues, aligning against known capacity additions, and validating typical price per can movement against raw material trends.
Inputs that materially shape the model include canned and processed food output trends, net trade direction for cans and related packaging items, tinplate and aluminum price direction, shifts in easy open end adoption, and the mix between 2-piece and 3-piece cans by application. Where direct volume is not consistently available, gaps are handled through proxy ratios that are rechecked in interviews, and then applied consistently across countries within Asia and Africa.
For forecasting, scenario analysis is used so expected growth in packaged food demand, pricing pass-through, and capacity utilization can be expressed as a base case with clear sensitivities. The forward view is then adjusted only after the assumptions are tested with primary respondents who track can orders, inventory cycles, and contracting behavior.
Data Validation & Update Cycle
Outputs are validated through multiple checks, including variance testing against trade direction, price trend consistency, and whether implied can demand growth is realistic versus packaged food production signals. When a number looks unusual, we revisit the drivers, recheck conversion factors, and recontact relevant interviewees so the adjustment is evidence-led and documented.
Before sign-off, the model goes through stepwise analyst review so that definitions, units, and currency handling are consistent across the time series. Reports are refreshed annually, and interim updates are made when material events occur, such as major capacity expansions, sharp metal price swings, or policy changes affecting food packaging. Before delivery, a final pass is completed so clients receive the latest updated view.
Mordor Intelligence's Asia and Africa Food Cans Market Size Compared Against Other Published Estimates
Published market sizes for food cans in Asia and Africa can differ even when they sound similar, because the boundaries around metal versus total packaging, the point of value capture, and the time window for price normalization are not always the same. Differences also come from how firms treat trade flows, currency conversion timing, and whether they validate application mix changes that shift average can pricing.
Trade direction checks and food processing output signals are the evidence that keep Mordor Intelligence tied to the actual can demand pool in Asia and Africa, which is why the estimate focuses on metal food cans supplied into food packing rather than broader packaging spend.
Benchmark comparison
| Source | Market Size | Gaps in Research Methodology |
|---|---|---|
| Mordor Intelligence | USD 7.91 B (2026) | |
| Packaging Market Insights A | USD 6.08 B (2025) | This figure is built by adding separate regional snapshots and then scaling forward with a long horizon CAGR, which can undercount intra-regional trade and may apply a narrower definition of food can formats and end uses. |
| Industry Portal B | USD 0.01 B (2022) | The published value appears to mix units or cover a limited sub-scope (such as a specific can type or a short list of countries), so the number is not comparable to a full Asia and Africa market value in USD. |
The spread in the table is mainly explained by scope alignment and normalization choices, not by small math differences. When geography, included can formats, and the value capture point are made explicit, the resulting total stays traceable to practical signals like demand drivers, trade patterns, and price movement.
Key Questions Answered in the Report
How fast is the Asia and Africa food cans market expected to grow by 2031?
The market is projected to expand at a 6.49% CAGR, reaching USD 10.83 billion in 2031 based on the current USD 7.91 billion valuation in 2026.
Which material captures the largest share within Asia and Africa’s food can segment?
Steel and tin cans lead with 56.15% share due to cost efficiency and established supply chains.
What is the primary growth driver behind canned pet food demand?
Rising pet ownership and premiumization trends in China and emerging African economies propel an 8.44% CAGR for canned pet food.
How significant is Asia’s contribution to regional food-can revenues?
Asia accounts for 60.55% of sales and is forecast to grow at a 6.92% CAGR through 2031 on the back of urbanization and export-oriented seafood processing.
Which technology dominates can construction in the region?
Two-piece draw-and-iron cans command 66.94% share, favored for their manufacturing efficiency and lightweight properties.