
Market Overview
| Study Period | 2020 - 2031 |
|---|---|
| Forecast Data Period | 2026 - 2031 |
| Base Year Market Size (2025) | USD 24.39 Billion |
| Market Size (2026) | USD 26.16 Billion |
| Market Size (2031) | USD 37.15 Billion |
| Growth Rate (2026 - 2031) | 7.26 % |
| Market Concentration | Medium |
Major Players *Disclaimer: Major Players sorted in no particular order Image © Mordor Intelligence. Reuse requires attribution under CC BY 4.0. | |
ASEAN Taxi Market Analysis by Mordor Intelligence
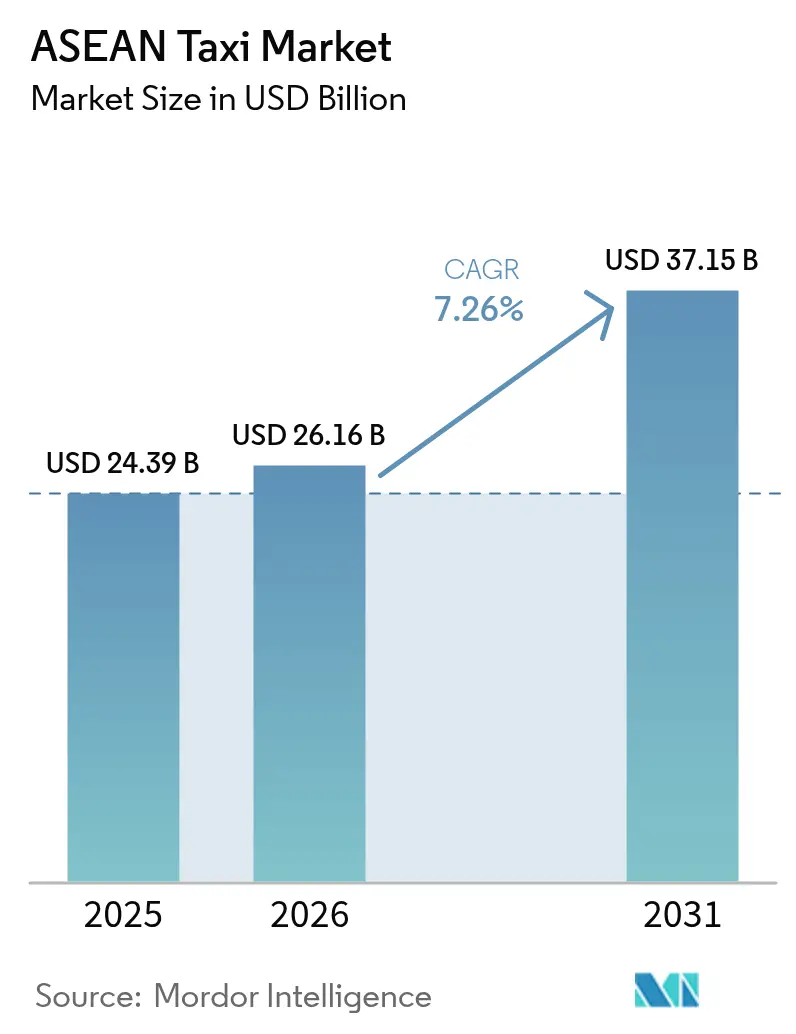
The ASEAN taxi market size is expected to grow from USD 24.39 billion in 2025 to USD 26.16 billion in 2026 and is forecast to reach USD 37.15 billion by 2031 at 7.26% CAGR over 2026-2031. Rapid urbanization, expanding smartphone ownership, and growing preference for cash-free mobility underpin this trajectory across Southeast Asia’s heterogeneous economies. Platform-integrated services are displacing street-hail models because real-time matching, transparent pricing, and centralized payments improve vehicle utilization and rider trust. Governments are modernizing legacy taxi legislation to legitimize app-based operations while regulating fares and driver accreditation, stabilizing growth expectations. Competitive differentiation now rests on electrification, multimodal linkages, and subscription-based corporate mobility programs, each amplifying demand for value-added services within the ASEAN taxi market.
Key Report Takeaways
- By booking type, online booking commanded 62.11% of the ASEAN taxi market share in 2025 and is forecast to climb at a 7.72% CAGR through 2031.
- By service type, platform-integrated metered taxis delivered 43.55% of the ASEAN taxi market share in 2025, whereas shared shuttle services posted the highest projected CAGR at 7.63% to 2031.
- By vehicle body style, sedans held 42.76% of the ASEAN taxi market share in 2025; SUVs and MPVs exhibit the fastest momentum, advancing at an 8.48% CAGR through 2031.
- By vehicle class, economy vehicles generated 70.84% of the ASEAN taxi market share in 2025, while premium and executive classes are set for an 8.29% CAGR through 2031.
- By end-user, corporate accounts represented 47.02% of the ASEAN taxi market share in 2025; airport services lead growth with an 8.16% CAGR through 2031.
- By country, Indonesia dominated with a 37.10% of the ASEAN taxi market share in 2025, whereas Vietnam registered the strongest forecast growth at an 8.22% CAGR through 2031.
Note: Market size and forecast figures in this report are generated using Mordor Intelligence’s proprietary estimation framework, updated with the latest available data and insights as of 2026.
Market Trends and Insights
Drivers Impact Analysis of ASEAN Taxi Market*
| Driver | (~) % Impact on CAGR Forecast | Geographic Relevance | Impact Timeline |
|---|---|---|---|
| Smartphone and E-Wallet Penetration Enabling App-Based Bookings | +1.5% | Global ASEAN, led by Singapore, Thailand | Short term (≤ 2 years) |
| Rapid Urbanization and Worsening Congestion | +1.2% | Indonesia, Philippines, Vietnam core markets | Medium term (2-4 years) |
| Corporate Mobility-Subscription Demand Surge | +1.1% | Business districts across major ASEAN cities | Short term (≤ 2 years) |
| Taxi-Fleet Electrification Incentives (E-Taxis) | +0.9% | Vietnam, Indonesia, Thailand with EV policies | Long term (≥ 4 years) |
| Government Support for Regulated Ride-Hailing Frameworks | +0.8% | Thailand, Indonesia, Philippines regulatory zones | Long term (≥ 4 years) |
| Multimodal Integration with Mass-Transit Networks | +0.7% | Singapore, Bangkok, Kuala Lumpur metro areas | Medium term (2-4 years) |
| Source: Mordor Intelligence | |||
Rapid Urbanization and Worsening Congestion
As urban congestion tightens its grip on ASEAN megacities, cities like Jakarta grapple with pronounced peak-hour slowdowns. In Manila, traffic toll manifests as significant productivity losses, underscoring the demand for dependable point-to-point mobility. Taxis are indispensable, particularly during seasonal challenges like flooding and when public transport falters. Meanwhile, ride-hailing platforms distinguish themselves by adeptly rerouting drivers, curbing travel uncertainties—this edge positions them favorably against conventional street-hail services in tech-savvy urban areas.
Corporate Mobility-Subscription Demand Surge
Across ASEAN, corporations are increasingly turning to mobility subscriptions, drawn by the allure of cost savings and enhanced operational flexibility. In a notable shift, companies are moving away from owning fleets and opting for platform-based services. This trend is underscored by providers like GoCorp, which have reported robust growth. The public sector isn't lagging, with Bacolod City prominently utilizing Grab for official travel. This move has allowed the city to enjoy streamlined billing and efficient compliance tracking benefits. As hybrid work models gain traction, the demand for flexible ride services intensifies, making subscription-based taxi services an attractive and scalable solution for businesses.
Taxi-Fleet Electrification Incentives (E-Taxis)
Thailand offers up to THB 100,000 per electric car, and Vietnam’s Xanh SM operates 30,000 e-taxis domestically before launching abroad[1]“Investor Relations Presentation 2024,”, VinFast, vinfastauto.com. Indonesia mandates a 20% electric composition in ride-hailing fleets by 2030. Electric vehicles cut fuel outlays by 60% and meet municipal air-quality goals, reinforcing government momentum behind cleaner fleets. ComfortDelGro in Singapore aims for full electrification by 2040 and is already running autonomous electric pilots, underscoring technology convergence within the ASEAN taxi market.
Government Support for Regulated Ride-Hailing Frameworks
Policy makers now view ride-hailing as integral to job creation, tax revenue, and digital-economy growth. Thailand authorized taxi-operated ride-hailing apps in 2024, providing traditional fleets a technology pathway adoption [2]“Ride-Hailing Regulation Update 2024,”, Ministry of Transport Thailand, mot.go.th. Indonesia capped platform commissions at 20% to safeguard driver earnings, which tempered public protests and stabilized service quality. Singapore’s Platform Worker Bill mandates social protections like insurance and CPF contributions, signaling government commitment to equitable gig-work conditions[3]“Platform Worker Bill Debates 2024,”, Parliament of Singapore, parliament.gov.sg. Such balanced regulation lowers operational risk and sustains investor confidence in the ASEAN taxi market.
Restraints Impact Analysis of ASEAN Taxi Market*
| Restraint | (~) % Impact on CAGR Forecast | Geographic Relevance | Impact Timeline |
|---|---|---|---|
| Heavy Traffic Lowers Driver Utilization and Reliability | -0.9% | Jakarta, Manila, Bangkok metropolitan areas | Short term (≤ 2 years) |
| Rising Platform Commission Fees Squeeze Driver Earnings | -0.8% | Indonesia, Philippines platform-dominated markets | Medium term (2-4 years) |
| Licensing Caps and Quota Restrictions | -0.6% | Singapore, Thailand traditional taxi sectors | Long term (≥ 4 years) |
| Preference For Motorcycle Taxis Over Cars in Key Cities | -0.5% | Indonesia, Philippines urban core areas | Medium term (2-4 years) |
| Source: Mordor Intelligence | |||
Heavy Traffic Lowers Driver Utilization and Reliability
In ASEAN megacities, severe traffic congestion undermines driver productivity and service reliability. Jakarta's peak-hour slow speeds curtail trip volumes and escalate fuel costs. Meanwhile, Bangkok and Manila grapple with significant economic setbacks caused by gridlock. Prolonged delays deter drivers from taking longer trips, particularly when return fares remain unpredictable. While ride-hailing platforms provide routing optimizations, they remain hampered by physical bottlenecks during rush hours, further entrenching the structural constraints of the region's taxi market.
Licensing Caps and Quota Restrictions
Across ASEAN, taxi fleet expansion is stymied by licensing caps and quota restrictions. In Singapore, stringent license quotas have curtailed the active fleet size. Meanwhile, Thailand and Malaysia grapple with permit limits and sluggish approval processes. This inflexible supply leads to fare surges during peak demand, eroding consumer trust and hindering market growth. Absent adaptable licensing frameworks, the ASEAN taxi sector falters in addressing escalating urban mobility demands.
*Our forecasts treat driver/restraint impacts as directional, not additive. The impact forecasts reflect baseline growth, mix effects, and variable interactions.
ASEAN Taxi Market Segment Analysis
By Booking Type:
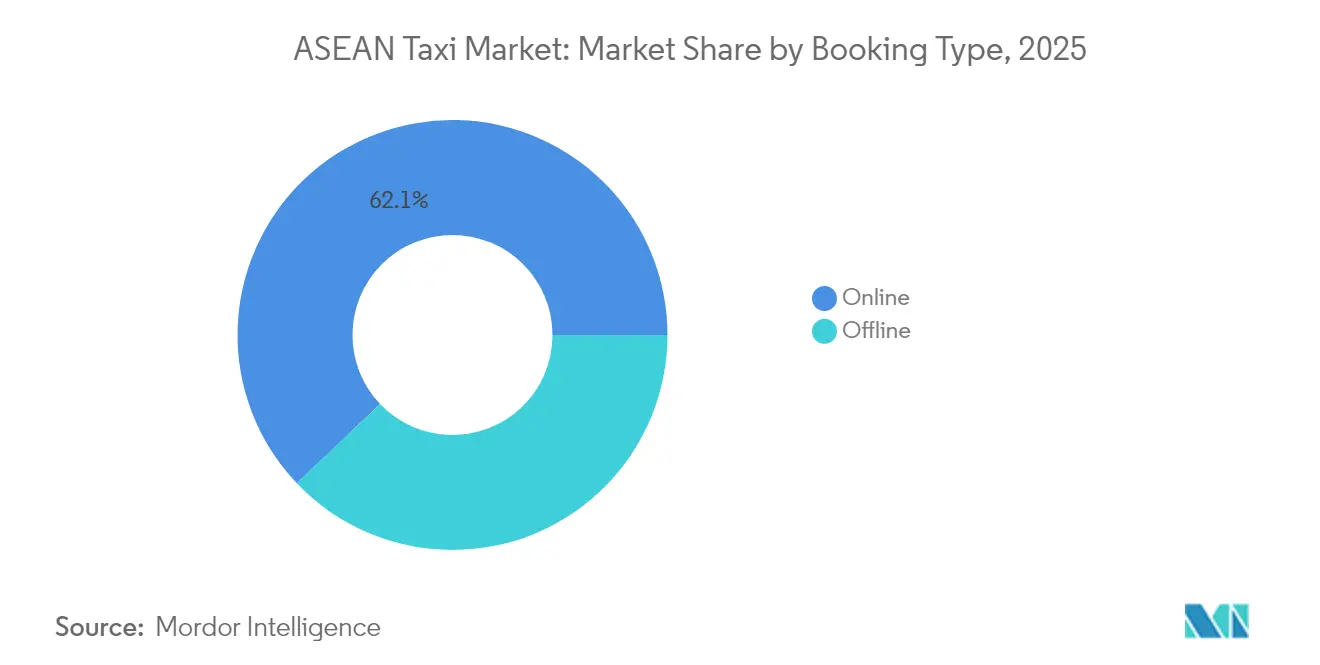
Digital Transformation AcceleratesOnline channels captured 62.11% of the ASEAN taxi market share in 2025 and are growing at a CAGR of 7.72% through 2031, reflecting widespread smartphone adoption in core ASEAN cities. User propensity for real-time tracking and cashless settlement continues to pull demand from offline call centers and street-hail services, which still cater to tourists unfamiliar with local apps. Offline bookings hold a 37.89% share yet shrink annually as 4G networks extend to secondary towns.
The ASEAN taxi market benefits from traditional fleets launching proprietary apps in Thailand and Malaysia, a shift that blurs the distinction between online and offline categories. Hybrid models allow meter-based pricing while offering digital convenience, which sustains ridership among older demographics who favor regulated fares. Offline’s continued relevance at airports and hotels signals that high-touch service can coexist with digital convenience.


By Service Type:
Platform Integration Reshapes OperationsPlatform-integrated metered taxis delivered 43.55% of the ASEAN taxi market share in 2025. The ASEAN taxi market share associated with this hybrid model leverages regulated meters to preserve fare transparency while using apps for dispatch, resulting in higher trip density. Traditional operators that remain offline face declining occupancy rates as consumers rank real-time location sharing and digital wallets as must-have features.
Shared shuttle services post the fastest 7.63% CAGR to 2031, propelled by corporate cost-control mandates and sustainability targets. B2B clients prefer fixed-route pickups that yield consistent occupancy and lower emissions per passenger. The segment’s growth marginally tempers demand for solo rides during peak office hours, yet overall market value still climbs as enterprises shift from owned fleets to subscription mobility.
By Vehicle Body Style:
SUVs Drive Premium GrowthSedans continued to dominate with 42.76% of the ASEAN taxi market share in 2025 because established taxi pools across Singapore and Kuala Lumpur favor their fuel economy and moderate maintenance costs. Platform data show sedans still clock the highest daily trip count. Yet SUVs and MPVs outpace all other body styles with an 8.48% CAGR through 2031, reflecting rising family and group travel, and the mobility needs of business delegations carrying bulkier luggage.
Hatchbacks remain prevalent in price-sensitive clusters such as Cebu and Ho Chi Minh City, where narrow streets and cost constraints favor compact frames. Operators increasingly weigh total cost of ownership against revenue potential when selecting vehicle body style, a calculus that shapes future fleet mix within the ASEAN taxi market.
By Vehicle Class Type:
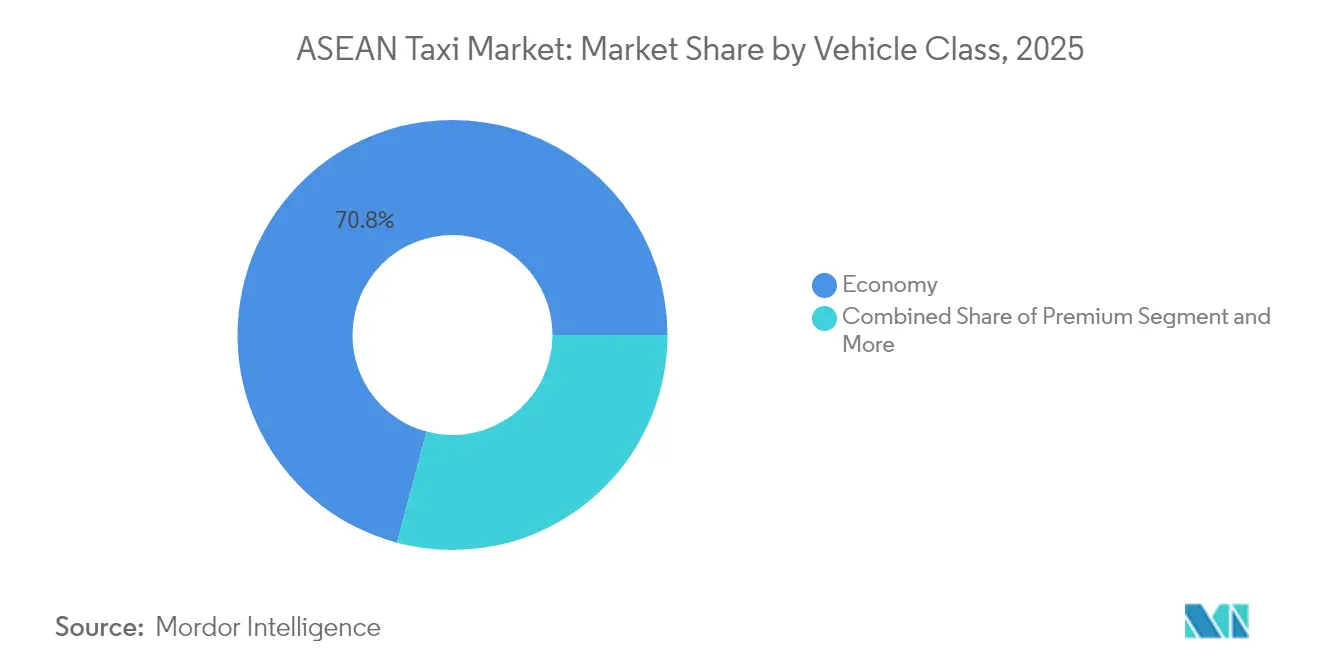
Premium Segment AcceleratesEconomy cars comprised 70.84% of the ASEAN taxi market share in 2025. This class ties directly to everyday commuting among middle-income riders who view taxis as an affordable adjunct to buses and rail. Platforms optimize route pools to sustain low fares that anchor this base of the ASEAN taxi market.
Premium and executive vehicles clock an 8.29% CAGR through 2031 as companies reopen travel budgets and tourists seek higher comfort. Leather seating, in-car Wi-Fi, and professional attire justify tariffs that sit 30-50% above economy rides. Luxury and business class niches remain small yet highly profitable, capturing events and VIP transfers at airports and hotels.
By End-User:
Corporate Leadership with Airport AccelerationCorporate clients controlled 47.02% of the ASEAN taxi market share in 2025 because centralized billing and analytics simplify expense management. The ASEAN taxi market size for enterprise mobility could approach USD 17.47 billion by 2031, driven by subscription models that replace gray car fleets. Hybrid work schedules raise variability in daily trip counts, favoring on-demand services over leased vehicles.
Airport rides are on the fastest trajectory, with an 8.16% CAGR to 2031, benefiting from tourism rebounds and the resumption of international events. Premium pricing, regulatory exclusivity, and captive demand elevate profitability. Tourist and individual segments sustain base volume but show lower ticket sizes, especially where mass transit extensions now serve downtown airport corridors.
Geography Analysis
Indonesia Taxi Market
Indonesia led the ASEAN taxi market with a 37.10% share in 2025, based on its residents and rapid uptake of digital payments, which now support nearly every ride-hailing transaction. Urbanization concentrates demand in Jakarta, Surabaya, and Medan, while commission caps at 20% protect driver margins and sustain fleet supply. The ASEAN taxi market size attributable to Indonesia could scale further as electrification subsidies and data-driven congestion pricing improve fleet economics.
Vietnam Taxi Market
Vietnam is the growth pacesetter with an 8.22% CAGR through 2031. Rising disposable income, government EV incentives, and Ho Chi Minh City’s metro rollout enhance multimodal integration. Xanh SM’s plan to electrify half its fleet by 2027 exemplifies the national ambition to lead green mobility.
ASEAN Taxi Market
Varied regulatory and infrastructure dynamics shape ASEAN taxi markets. Bangkok’s dedicated BTS taxi lanes have improved wait times, boosting spillover demand for metered cabs. In contrast, Singapore’s shrinking fleet is tightening supply but enabling premium pricing and trials of autonomous vehicles, keeping the city at the forefront of innovation. The Philippines is expanding capacity with new TNVS slots, signaling policy support for growth, while Malaysia continues to face delays in license processing, limiting expansion in secondary cities. Together, these trends reflect a region balancing innovation, demand, and regulatory constraints.
Regulatory Landscape
Across ASEAN, taxi and ride-hailing rules are converging on formal licensing, fare guardrails, and platform accountability, although country-level quotas and market-access conditions still differ. In Singapore, this shift is anchored by the Point-to-Point Passenger Transport Industry Act and related subsidiary legislation. The framework requires larger operators (at least 800 vehicles) to hold a Ride-Hail Service Operator Licence (RSOL) or Car-Pool Service Operator Licence (CSOL), and it includes Quality of Service (QoS) monitoring for licensed operators.
Cross-border mobility is also moving into a more structured regulatory track, led by Singapore and Malaysia. Singapore introduced a dedicated licensing regime for cross-border ride-hail services via the Point-to-Point Passenger Transport Industry (Amendment) Regulations 2026, effective March 6, 2026, with further amendments effective May 4, 2026. The Land Transport Authority (LTA) also awarded GrabCar the first Cross-border Ride-hail Service Operator Licence (CRSOL) on April 30, 2026 (three-year validity). In parallel, Singapore LTA and Malaysia APAD enhanced the Cross-Border Taxi Scheme effective May 4, 2026, including a quota increase from 200 to 300 taxis per country and wider drop-off permissions, which expands regulated supply while tightening compliance in both jurisdictions.
Value Chain Analysis
The ASEAN taxi value chain starts with vehicle and energy inputs (OEMs, dealers/lessors, fuel and charging networks), followed by operator onboarding (driver recruitment, licensing, training, and vehicle inspections). Dispatch and transaction enablement then run through super-apps and fleet systems, covering matching, pricing/meter integration, and e-wallet and card payments, before trip fulfillment and after-sales operations (maintenance, insurance/claims, customer support, and compliance reporting). Platform operators and aggregators such as Grab and GoTo increasingly sit at the center of demand generation and payments, while legacy fleets are adopting hybrid models by connecting regulated metered services to app-based booking.
Electrification and regulation are changing upstream sourcing and midstream fleet economics. Singapore has committed to end new registrations of ICE taxis by 2030, which pushes fleets and lessors toward EV procurement and charging partnerships. Indonesia is also promoting a more integrated domestic EV supply chain supported by local xEV manufacturing and battery materials. On service delivery, frameworks such as Thailand allowing taxi-operated ride-hailing apps (authorized in 2024) and Indonesia maintaining tariff floors and commission rules re-balance bargaining power among drivers, fleets, and platforms. This elevates recurring compliance, insurance, and data reporting needs across the chain.
Competitive Landscape
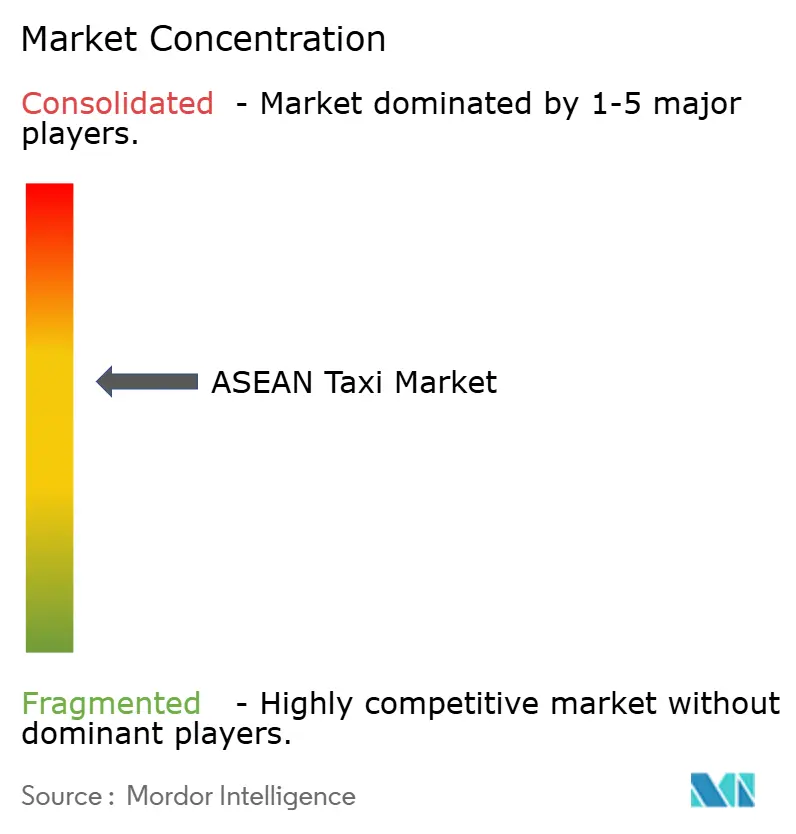
The ASEAN taxi market is moderately concentrated; Grab and GoTo have established regional dominance. Both firms bundle food delivery, payments, and micro-insurance to deepen user retention. Autonomous pilots with partners like Pony.ai position incumbents for future cost reductions via driverless fleets. Electric vehicle rollouts are also accelerating as firms tap state subsidies, which reduce operating costs and align with corporate ESG mandates.
Traditional operators respond through digital pivots. ComfortDelGro migrated its Singapore fleet to an in-house app and plans full electrification by 2040, showcasing how incumbents leverage regulatory familiarity to remain competitive. Regional mid-tier players like Mai Linh in Vietnam invest in EV partnerships with VinFast that lower battery leasing costs and shorten charging downtimes.
Challengers exploit pricing gaps; inDrive waives commissions to recruit drivers in the Philippines and Indonesia, though sustainability remains uncertain without ancillary revenue streams. Corporate subscription services and multimodal passes tied to mass-transit operators offer additional white-space opportunities as enterprises and commuters seek integrated solutions within the ASEAN taxi market.
ASEAN Taxi Industry Leaders
Grab Holdings Inc.
Gojek (GoTo Group)
ComfortDelGro Taxi
Blue Bird Group
Mai Linh Group
- *Disclaimer: Major Players sorted in no particular order
ASEAN Taxi Market Companies Covered in this Report
- Grab Holdings Inc.
- Gojek (GoTo Group)
- ComfortDelGro Taxi
- Blue Bird Group
- Mai Linh Group
- Vinasun Corp.
- TADA Mobility
- Ryde Technologies
- Trans-Cab Services
- SMRT Taxis (Strides)
- Sunlight Taxi
- Public Cab Sdn Bhd
- MyCar
- inDrive
- Maxim Taxi
- Thai Taxi Radio
- Uber Technologies Inc.

Market Opportunities and Future Outlook
Cross-border, platform-managed taxi bookings are emerging as a defined expansion lane as regulators shift from ad hoc arrangements to licensed operations. Singapore and Malaysia enhanced the Cross-Border Taxi Scheme effective May 4, 2026, raising the quota to 300 taxis per country and broadening drop-off rules. Singapore also issued the first Cross-border Ride-hail Service Operator Licence (CRSOL) to GrabCar on April 30, 2026, which provides a clearer commercial pathway for app-based cross-border taxi demand management, compliance reporting, and service standardization.
Electrified taxi operations and the charging ecosystem offer a separate monetization and partnership whitespace, particularly where fleets face fuel-cost volatility and cities continue to prioritize air-quality targets. In the Philippines, Grab launched GrabTaxi Electric in Metro Manila with local EV taxi operators and later partnered with ACMobility and EVOxCharge (July 2026) to expand charging access through a network of 600-plus stations, addressing uptime and operating-cost barriers that can slow EV taxi scaling. Policy actions are also shaping unit economics and product design: Indonesia signaled tighter commission and driver-protection requirements under Presidential Regulation No. 27/2026, referenced by platform actions ahead of July 2026, while Thailand’s Ministry of Transport proposed an EV action plan that includes public-transport taxis. Malaysia entered a new EV policy phase in July 2026 emphasizing local assembly and components, which pushes fleet buyers and platform partners to align vehicle sourcing with incentive eligibility and local supply availability.
Recent Industry Developments in ASEAN Taxi Market
- July 2026: Grab partnered with ACMobility and EVOxCharge in the Philippines to expand EV charging access for GrabTaxi Electric and GrabCar Electric driver-partners via discounted rates across 600-plus charging stations. The move reduces downtime risk and helps fleet operators translate EV purchase decisions into daily operational availability, especially in Metro Manila where utilization determines earnings.
- May 2026: Grab commenced its Cross-Border SG-JB (Beta) pilot on May 4, 2026, enabling pre-booked taxi travel between Singapore and designated areas in Johor, including Johor Bahru, Iskandar Puteri, Forest City, Kulai, and Senai. The pilot operationalizes the new bilateral regulatory framework and tests a scalable template for compliant cross-border booking, pricing, and customer support on a single platform.
- December 2024: PT Xanh SM Green And Smart Mobility rolled out its electric taxi service, Xanh SM, in Indonesia, extending the Vietnam-born all-electric taxi model into another major ASEAN market. This expansion broadened competitive pressure on incumbents around EV fleet economics and accelerated the need for charging access and fleet-financing partnerships.


ASEAN Taxi Market Report Scope and Research Methodology
Market Definition and Coverage
For this study, the market covers passenger transport trips delivered as taxi services across ASEAN, including street hail, dispatch, and app-based bookings. Revenue is measured on a per-trip basis and captured at the point of service delivery.
Scope exclusions: We exclude public bus and rail fares, vehicle sales and leasing, standalone food and parcel delivery, and pure car rental without a driver.
Segments Covered in This Report
- By Booking Type
- Online
- Offline
- By Service Type
- Traditional Metered Taxi
- Platform-Integrated Metered Taxi
- Shared/Shuttle (Corporate/B2B)
- By Vehicle Body Style
- Sedan
- Hatchback
- SUVs & MPVs
- By Vehicle Class Type
- Economy
- Premium/Executive
- Luxury/Business
- By End-User
- Corporate
- Tourist
- Airport
- Others (Individual etc.)
- By Country
- Singapore
- Indonesia
- Malaysia
- Thailand
- Philippines
- Vietnam
- Rest of ASEAN
Data Sources, Market Sizing, and Validation
Desk Research
Desk research was used to set base demand and price guardrails before interviews started, so our assumptions stayed anchored to what is observable in public data. We reviewed mobility and transport statistics and policy notes from sources such as ASEANstats, the World Bank, national transport regulators, and national statistics offices across key ASEAN countries.
We also incorporated supporting signals that help explain taxi usage and pricing, including tourism arrival data, airport and urban mobility publications, and fuel price series from energy agencies, plus academic papers on urban transport demand. Company annual reports, exchange filings, and investor decks were checked for revenue mix cues and fleet activity narratives, and a paid subscription for company financials and news was used to keep corporate events and disclosures consistent in the model. These sources are illustrative, and other public documents were used for data collection, cross-checking, and clarification.
Primary Interviews and Surveys
Primary interviews and short surveys were run with a spread of taxi operators, fleet owners, dispatch and platform-linked stakeholders, driver groups, and ecosystem participants such as insurers and financiers who see utilization and cost movement early. Because this is a regional market, we ensured views were balanced across major ASEAN geographies so differences in regulation, metering rules, and app penetration were captured and then used to adjust the model assumptions.
Distribution of primary research fieldwork respondents
| Company type | Respondent position |
|---|---|
| Top tier: 34% | CXOs: 14% |
| Mid tier: 47% | Functional/Unit leaders: 32% |
| Smaller Players: 19% | Managers: 54% |
Market-Sizing & Forecasting
Sizing started with a top-down demand pool build that reconstructs annual taxi revenue from trip volumes and realized fares, then aligned to country totals and rolled up to ASEAN. In practice, we built country-level trip activity using indicators such as urban population and commuting intensity, airport passenger throughput and tourism arrivals, smartphone and app usage proxies, and regulatory signals that influence supply, including licensed fleet counts, permit rules, and fare-meter structures.
To keep totals realistic, selective bottom-up approximations were used as a check, including sampled operator revenue ranges from public filings, fleet utilization discussions from interviews, and a simple ASP times volume cross-check by major city clusters when data was available. Where bottom-up inputs were missing, gaps were handled by applying interview-validated utilization bands and fare ranges to licensed supply, then stress-tested against fuel prices and wage pressures that affect fare pass-through.
For forecasting, scenario analysis was used because taxi demand in ASEAN is sensitive to policy shifts and platform behavior, not only macro growth. The forward view was shaped through country-level drivers such as tourism recovery paths, electrification and fleet renewal pace, changes in commission and incentive intensity, and expected fare revisions. Assumptions were reviewed and corrected through primary expert feedback before finalizing the trajectory.
Data Validation & Update Cycle
Model outputs were checked against independent signals, and any odd jumps were investigated before final numbers were signed off. We compared implied trips per capita, average fare movement, and revenue per active vehicle against normal ranges described by interviewees, then re-ran the model when implied values drifted.
A multi-step review was followed, including peer review of assumptions, logic checks for country roll-ups, and variance checks across historical years so one-off events did not get carried forward as a trend. When a material event occurs, such as a major regulatory change or a sudden pricing shift, we re-contact sources to confirm direction and magnitude. Reports are refreshed annually, and a final pre-delivery review is performed so clients receive an updated view based on the latest available information.
Mordor Intelligence's Asean Taxi Market Sizing Compared With Other Published Estimates
Published market numbers for ASEAN taxi often differ because the market can be defined in more than one practical way, and assumptions about trip volumes and fare levels can move totals quickly. Differences also show up when some studies mix taxi with adjacent mobility services, or when currency timing and inflation treatment are not clearly stated.
Some external estimates bundle ride-hailing platform services broadly or apply a single regional revenue per user proxy across ASEAN, which can overstate markets where metered taxi rules limit pricing flexibility. In Mordor Intelligence's model, taxi revenue is counted only when it is tied to passenger trips delivered within ASEAN and supported by checks on licensed supply, utilization, and country-specific fare structures, with base-year values refreshed to align with the latest observable signals.
Benchmark comparison
| Source | Market Size | Gaps in Research Methodology |
|---|---|---|
| Mordor Intelligence | USD 24.39 B (2025) | |
| Regional Consultancy A | USD 22.70 B (2024) | Uses a different base year and tends to generalize ASEAN demand with a single proxy, which can undercount country-level fare revisions and rebound effects in tourism-heavy corridors. |
| Industry Portal B | USD 26.16 B (2026) | Cites a forward-year figure as a headline size, which shifts the comparison year and may not separate price-led growth from underlying trip volume changes. |
The spread in the table mainly comes from year selection and what gets bundled into the taxi revenue pool. By tying the model to trip activity, licensed supply, and fare mechanics at the country level, the final size stays traceable to clear inputs and can be repeated with the same steps when new data points arrive.


Key Questions Answered in the Report
How large will ASEAN taxi revenues be by 2031?
The ASEAN taxi market is projected to reach USD 37.15 billion by 2031, reflecting a 7.26% CAGR from 2026-2031.
Which country is expanding fastest?
Vietnam shows the strongest trajectory with an expected 8.22% CAGR through 2031, boosted by EV incentives and rising disposable income.
What booking model leads today?
Online app-based booking holds a 62.11% revenue share due to 80%+ smartphone penetration in major cities.
Are electric taxis economically viable?
Government subsidies cut purchase costs, while operators report operational savings of about 60% compared with gasoline cars, improving total cost of ownership for EV taxis.
Why are SUVs gaining popularity in fleets?
Higher seating, extra luggage space, and perceived safety help SUVs and MPVs grow at an 8.48% CAGR, outpacing sedans.
Page last updated on:


 Your data is secure and never sold or shared.


