
Market Overview
| Study Period | 2020 - 2031 |
|---|---|
| Forecast Data Period | 2026 - 2031 |
| Base Year Market Size (2025) | USD 5.29 Billion |
| Market Size (2026) | USD 6.11 Billion |
| Market Size (2031) | USD 12.56 Billion |
| Growth Rate (2026 - 2031) | 15.51% CAGR |
| Market Concentration | Medium |
Major Players *Disclaimer: Major Players sorted in no particular order Image © Mordor Intelligence. Reuse requires attribution under CC BY 4.0. | |
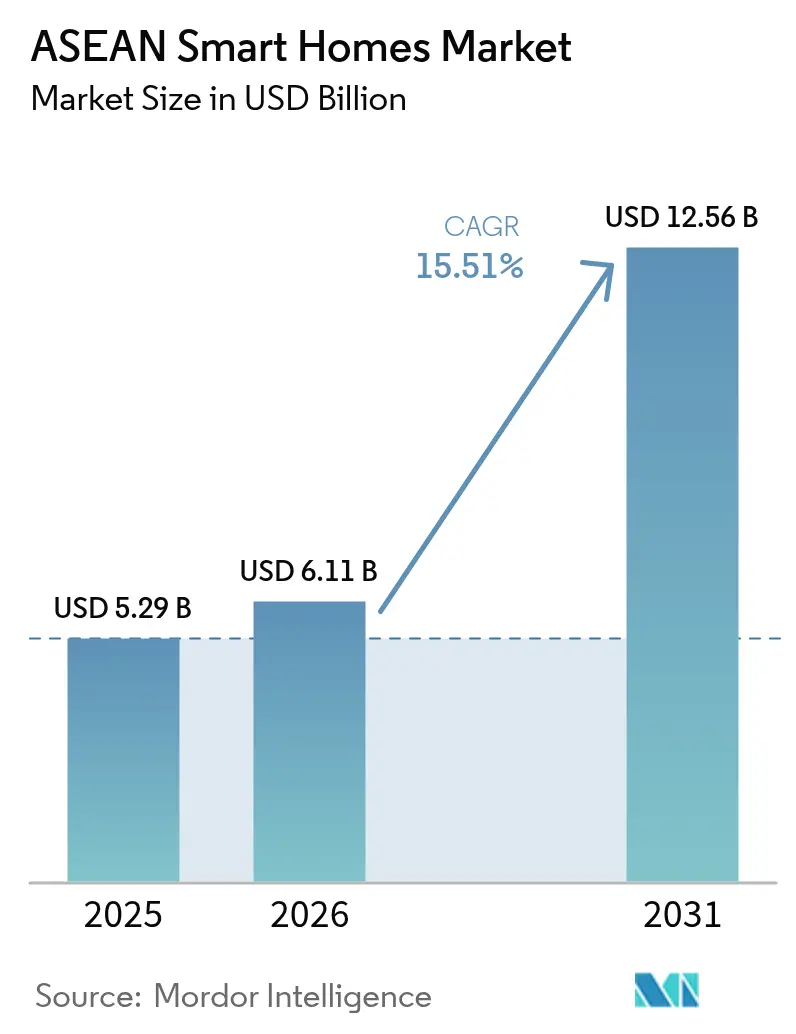
ASEAN Smart Homes Market Analysis by Mordor Intelligence
The ASEAN Smart Homes market size is expected to grow from USD 5.29 billion in 2025 to USD 6.11 billion in 2026 and is forecast to reach USD 12.56 billion by 2031 at 15.51% CAGR over 2026-2031. Large-scale cloud investments by Google, AWS, and other hyperscalers are strengthening the backbone that supports device ecosystems and data-intensive services, while government energy-efficiency incentives, 5G rollout, and cross-brand protocol standardization deepen the addressable base for connected living. Infrastructure commitments such as Google’s USD 2 billion Malaysian data-center project and AWS’s USD 5 billion Thailand region lower latency for cloud-managed devices and expand developer toolkits. [1]Amazon Web Services, “AWS Launches Infrastructure Region in Thailand,” press.aboutamazon.com Consumers’ growing focus on safety, comfort, and energy savings, combined with telecom-bundled offerings and the roll-out of Matter-ready hardware, positions the ASEAN smart homes market for broad-based uptake across income tiers and housing types. Interoperability gains reduce vendor lock-in, while aggressive price competition from regional brands compresses margins but widens consumer choice.
Key Report Takeaways
- By product category, safety, security, and access control devices led with 31.45% revenue share in 2025; HVAC and energy-management devices are forecast to expand at a 16.78% CAGR to 2031.
- By communication protocol, Wi-Fi maintained 38.55% of the ASEAN smart homes market share in 2025, while Thread and Matter protocols are projected to grow at 16.55% CAGR through 2031.
- By sales channel, online retail and marketplaces captured 45.92% share of the ASEAN smart homes market size in 2025; telco/ISP bundles are advancing at a 16.90% CAGR through 2031.
- By installation type, retrofit installations held 59.35% share of the ASEAN smart homes market size in 2025, and new-build integrated solutions are set to expand at 17.02% CAGR between 2026-2031.
- By country, Indonesia commanded 30.55% of the ASEAN smart homes market share in 2025, while Vietnam is forecast to grow at 16.30% CAGR through 2031.
Note: Market size and forecast figures in this report are generated using Mordor Intelligence’s proprietary estimation framework, updated with the latest available data and insights as of 2026.
ASEAN Smart Homes Market Trends and Insights
Drivers Impact Analysis*
| Driver | (~) % Impact on CAGR Forecast | Geographic Relevance | Impact Timeline |
|---|---|---|---|
| Government-backed energy-efficiency incentives | +3.2% | Singapore, Thailand, Malaysia with spillover to Indonesia | Medium term (2-4 years) |
| Rising urban middle-class disposable income | +4.1% | Indonesia, Vietnam, Philippines with moderate gains in Thailand, Malaysia | Long term (≥ 4 years) |
| Smartphone and broadband penetration surge | +2.8% | Vietnam, Philippines, Indonesia with established presence in Singapore, Malaysia | Short term (≤ 2 years) |
| Matter protocol enabling cross-brand IoT | +2.3% | Global with early adoption in Singapore, Malaysia | Medium term (2-4 years) |
| Security and safety concerns in dense cities | +1.9% | Singapore, Malaysia, urban centers in Indonesia, Thailand | Short term (≤ 2 years) |
| Telco-bundled IoT subscription models | +1.7% | Indonesia, Thailand, Malaysia with emerging presence in Vietnam | Medium term (2-4 years) |
| Source: Mordor Intelligence | |||
Government-backed Energy-efficiency Incentives
Singapore’s Climate-Friendly Households Programme gives every HDB household SGD 400 vouchers for energy-efficient appliances and sets an influential benchmark that neighboring markets monitor closely. [2]National Environment Agency, “$300 Climate Vouchers For All HDB Households,” nea.gov.sg Thailand’s Building Energy Code and Malaysia’s National Semiconductor Strategy provide similar regulatory nudges that elevate demand for connected HVAC and energy-management devices. Utilities in multiple countries have begun piloting time-of-use tariffs, rewarding homes equipped with smart thermostats and load controllers. Integration of Home Energy Management Systems into Singapore’s Punggol Northshore estates demonstrates how bake-in infrastructure shortens payback periods and boosts user confidence. Collectively, these measures move smart energy devices from nice-to-have to default specifications, lifting the ASEAN smart homes market outlook for the medium term.
Rising Urban Middle-class Disposable Income
ASEAN’s expanding urban middle class drives a shift from basic appliances to feature-rich, connected products. Vietnam’s home-appliance spend is on course to touch USD 13 billion by 2025, growing over 10% annually. Indonesian developers now position smart homes as standard rather than premium, reinforcing consumer perception that connected living is part of modern housing. Regional firms such as Vietnam’s Lumi, which operates a 6,000 m² IoT factory and serves 70,000 customers, illustrate how localized design, language support, and climate-appropriate hardware create defensible niches against multinational brands. Rising disposable income thus unlocks multi-device purchases and subscription upgrades, increasing lifetime customer value for vendors.
Smartphone and Broadband Penetration Surge
Declining mobile-data tariffs and aggressive fiber roll-outs give ASEAN one of the world’s highest ratios of smartphone use to PC ownership, making phones the de facto smart home hub. Thailand’s IoT market is projected to reach USD 2.19 billion by 2030 as 5G coverage boosts low-latency applications. Vietnam’s ICT sector grew 14% in 2024 to USD 10.2 billion, translating bandwidth upgrades into addressable demand for connected devices. Telkomsel’s IndiHome bundle combines broadband with starter smart-home kits, multiplying attach rates and familiarizing first-time buyers with entry-level automation. As connectivity improves even in secondary cities, device control moves seamlessly from dedicated hubs to smartphones, cutting acquisition friction.
Matter Protocol Enabling Cross-brand IoT
Matter’s promise of interoperability is gaining tangible traction: Google and MediaTek’s Filogic MT7903 chipset integrates native Thread to simplify manufacturer onboarding. LG already enables users to orchestrate 600 million devices through Google Home, exemplifying full-house experiences over single-brand silos. Tuya’s 200-plus Matter certifications and Apple Wallet–ready smart locks show how the protocol lets smaller manufacturers compete on user experience rather than proprietary ecosystems. Clearer standards spur confident purchasing, widening the ASEAN smart homes market as consumers avoid the fear of obsolescence.
Restraints Impact Analysis*
| Restraint | (~) % Impact on CAGR Forecast | Geographic Relevance | Impact Timeline |
|---|---|---|---|
| High upfront device and install cost | -2.8% | Vietnam, Philippines, Indonesia with moderate impact in Thailand | Short term (≤ 2 years) |
| Ecosystem fragmentation and legacy protocol lock-in | -1.9% | Global with acute impact in markets with diverse device ecosystems | Medium term (2-4 years) |
| Data-localisation compliance costs | -1.2% | Indonesia, Vietnam with emerging requirements in Thailand, Malaysia | Long term (≥ 4 years) |
| Limited certified installer base beyond tier-1 cities | -1.5% | Indonesia, Philippines, Vietnam with moderate impact in Thailand | Medium term (2-4 years) |
| Source: Mordor Intelligence | |||
High Upfront Device and Install Cost
Component inflation and tariff pressures have lifted BOM costs just as price-sensitive ASEAN consumers weigh discretionary upgrades. Manufacturers diversifying production into Malaysia and Vietnam to reduce duty exposure incur short-term capex that can raise end-user prices, slowing adoption in entry-level segments. Bulk-purchase government subsidies partially offset sticker shock, yet many households still start with single devices rather than full-suite installs. Vendors respond with stripped-down SKUs, but these pared features sometimes dilute the seamless experience that anchors recurring revenue models, tempering near-term uptake.
Ecosystem Fragmentation and Legacy Protocol Lock-in
Early adopters who invested in Zigbee-only or proprietary ecosystems face costly transitions to Matter-ready products. Thread 1.4 specification will ease multi-border-router interoperability, but full roll-out is unlikely before 2026, prompting some buyers to defer purchases until the ecosystem stabilizes. Manufacturers must balance firmware support for legacy fleets with R&D spend on multi-protocol chips, stretching engineering budgets and complicating SKU roadmaps. The resulting uncertainty marginally dampens ASEAN smart homes market momentum during the protocol transition window.
*Our forecasts treat driver/restraint impacts as directional, not additive. The impact forecasts reflect baseline growth, mix effects, and variable interactions.
Segment Analysis
By Product Type: Security Dominance Meets Energy Innovation
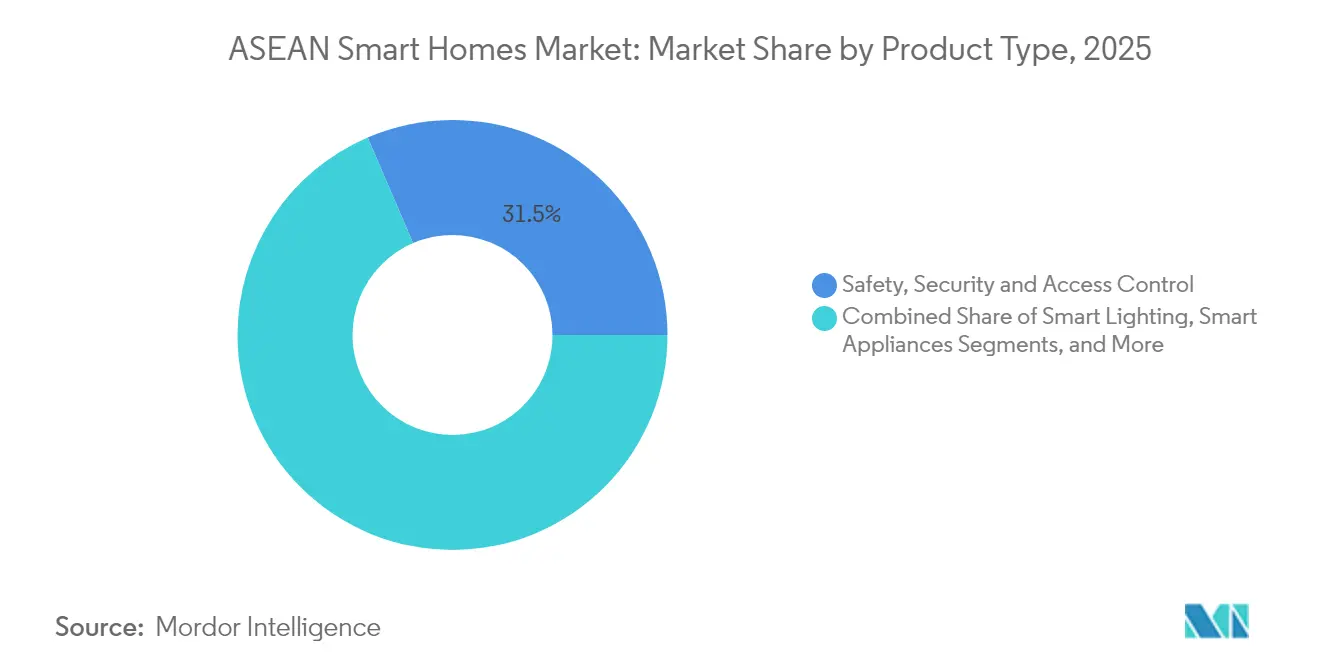
Safety, security, and access control devices accounted for 31.45% of the ASEAN smart homes market in 2025, reflecting dense urban living and rising consumer focus on personal safety. The segment enjoys strong retrofit demand, as door locks, cameras, and sensors can be installed without structural changes. HVAC and energy-management devices register the quickest pulse, expanding at 16.78% CAGR as utilities launch variable tariffs and governments tie appliance rebates to energy-star ratings. Smart lighting remains an established gateway category; Philips Hue’s AI-enhanced offerings illustrate growing convergence between ambiance, security, and automation. Entertainment hubs face substitution pressure from smartphone-based control panels, yet multi-room setups still favor dedicated bridges for latency-sensitive streaming. Emerging niches such as smart water valves and leak detectors address resilience in water-stressed markets.
Philips Hue’s generative-AI assistant exemplifies how legacy lighting brands extend into whole-home security, while Tuya’s AI-enabled pet-health feeders highlight category blurring that keeps the ASEAN smart homes market vibrant. Competitive intensity varies: mature devices like motion sensors are commoditizing, but AI-enabled cameras and energy-optimizing HVAC controls sustain premium pricing. As user trust in cloud analytics rises, vendors that bundle software dashboards with hardware achieve higher stickiness and recurring service revenue.


By Communication Protocol: Wi-Fi Leadership Faces Thread Challenge
Wi-Fi underpins 38.55% of connected devices in 2025, benefiting from ubiquitous router presence and straightforward user onboarding. Power consumption and congested 2.4 GHz bands, however, open space for Thread’s low-energy mesh to grow at 16.55% CAGR. Zigbee maintains a foothold in cost-sensitive, multi-sensor deployments, especially for lighting. Bluetooth Low Energy powers proximity-based functions such as door unlocks, but rarely manages entire homes. Proprietary sub-GHz protocols persist in long-range security peripherals yet lose share as multi-protocol chips become mainstream. Google–MediaTek’s Thread-native chipset signals the silicon ecosystem’s pivot toward standardized stacks, reducing development overhead and boosting cross-vendor interoperability. Silicon Labs’ support for native Matter-over-Thread smart locks further validates the protocol’s viability in high-security use cases. As chipset prices fall, ASEAN manufacturers integrate dual-band Wi-Fi/Thread radios, granting end users future-proof flexibility.
By Sales Channel: Online Retail Meets Telco Innovation
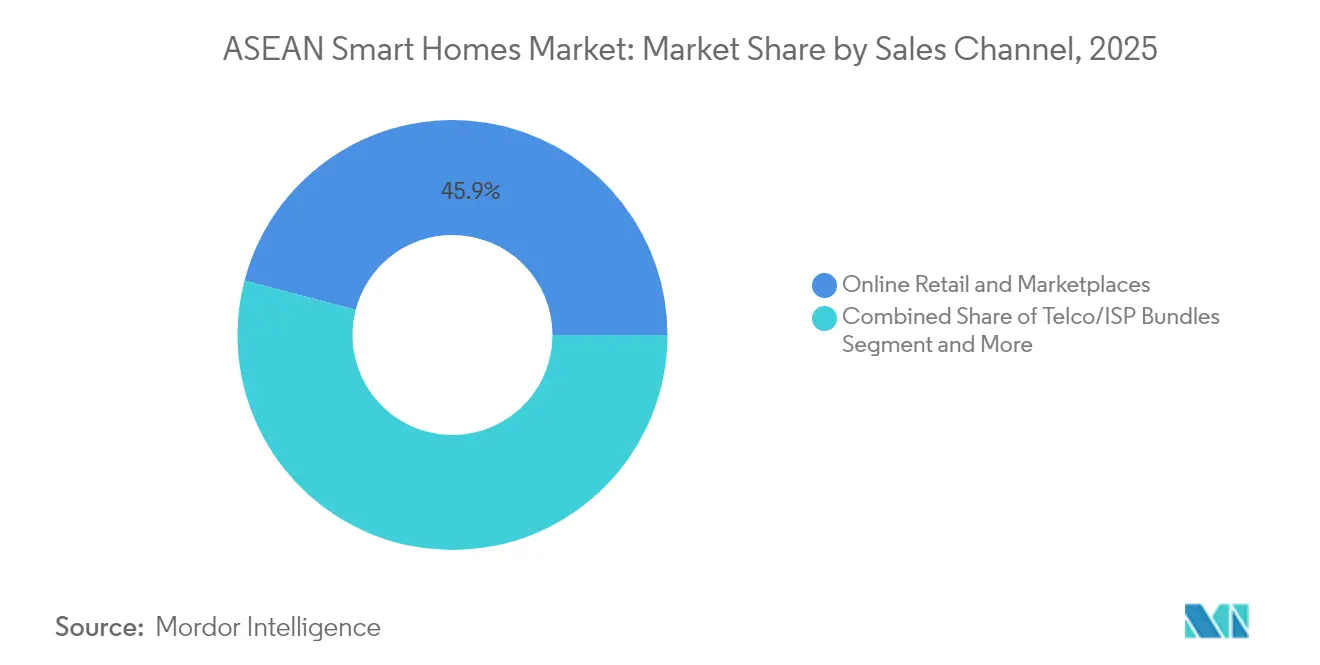
Online marketplaces retained 45.92% of 2025 sales as consumers leverage price comparison tools and user reviews prior to purchase. Telco/ISP bundles, however, expand fastest at 16.90% CAGR, converting connectivity customers into recurring smart-home subscribers. Operators package routers, cloud storage, and starter kits, lowering upfront hardware cost via installment billing. Brick-and-mortar electronics chains still command premium product displays where experiential demos close high-ticket security or HVAC sales. Value-added integrators thrive in luxury condominiums, offering bespoke design and maintenance contracts. Grab’s decision to ride AWS cloud infrastructure indicates how super-apps may soon cross-sell home automation alongside mobility and payments, widening omnichannel competition. Channel evolution thus intertwines hardware, connectivity, and service layers, expanding the ASEAN smart homes market playbook.
By Installation Type: Retrofit Reality Meets New-Build Vision
Retrofit installations dominate with a 59.35% share in 2025 due to the substantial existing housing stock across Indonesia, the Philippines, and Vietnam. DIY-friendly sensors, smart bulbs, and plug-in energy monitors provide low-risk entry paths. New-build integrated solutions advance at 17.02% CAGR as developers realize smart capabilities differentiate properties and accelerate presales. Indonesia’s 3 million-home construction plan embeds conduits and wired backbones so that smart hubs can be added cost-effectively during finishing. Singapore’s Punggol Northshore estates integrate smart switches and energy dashboards from day one, demonstrating lifetime cost savings that convince financiers and end buyers alike. Falling wireless relay costs now let retrofits mimic many wired benefits, but new builds still capture higher average selling prices as bundled ecosystems present an upgrade-free operating environment.
Geography Analysis
Indonesia leads the ASEAN smart homes market with a 30.55% share in 2025, propelled by a 270 million population and the government’s aggressive housing push. The USD 2.5 billion Qatari investment in affordable housing expands greenfield opportunities where smart wiring can be embedded during construction. Local production of sensors and hubs in Jakarta’s manufacturing corridors lowers logistics costs and buffers tariff shocks, improving price competitiveness. Telkomsel’s IndiHome bundles shift focus from connectivity ARPU to device attach rates, accelerating market penetration.
Vietnam, though smaller, delivers the fastest CAGR at 16.30%, with the smart home market expected to jump from USD 440.2 million in 2026 to USD 804.8 million by 2030. Domestic champions like Lumi tailor products to humid subtropical climates and local language apps, capturing loyalty. Strong ICT growth and a 24% rise in electronics e-commerce sales, even as sellers consolidate, signal sustained digital appetite. Government 5G trials in Hanoi and Ho Chi Minh City will further ease latency concerns for cloud-controlled devices.
Thailand and Malaysia benefit from cloud-region launches by AWS and Google, which reduce latency and support AI-heavy edge applications. AWS’s USD 5 billion Thailand region is expected to generate 11,000 jobs annually and inject USD 10 billion into GDP. Malaysia’s twin Google investments position Kuala Lumpur as a regional data-hub magnet. Singapore, already top in per-capita adoption, pushes sustainability with SGD 400 appliance rebates that drive upgrades rather than first-time installs. The Philippines, while lagging in fixed broadband, benefits from mobile-first device control and growing remittance-driven spending power, pointing to volume upside once fiber penetration improves.
Regulatory Landscape
Regulation for ASEAN smart homes remains country-specific, with Singapore and Malaysia providing the clearest compliance anchors for consumer IoT devices. In Singapore, SS 702:2024 sets safety and performance requirements for smart plugs used in homes, and IMDA published an updated IoT Cyber Security Guide (Version 2, Oct 2025) that aligns security practices for connected devices and deployments.
Cybersecurity assurance is also becoming a practical market-entry requirement in Singapore through the Cyber Security Agency of Singapore (CSA) Cybersecurity Labelling Scheme (CLS) for consumer IoT devices. CSA has announced plans to raise cybersecurity labelling requirements for residential routers from CLS Level 1 to Level 2 by end-2027. In Malaysia, MCMC and MTSFB have issued technical codes and specifications touching IoT privacy governance (2025) and functional safety alignment (draft published July 2025), adding compliance overhead for device makers and cloud-managed service providers operating across multiple ASEAN markets.
Value Chain Analysis
The ASEAN smart homes value chain covers silicon and module suppliers (including multi-protocol Wi-Fi/Thread radios), device OEM/ODM manufacturing and assembly (with capacity shifting into Malaysia and Vietnam), and platform and cloud layers that include hyperscalers and smart home software stacks. Downstream distribution is shaped by online marketplaces and telco/ISP bundles. In-country onboarding and assurance steps, such as Singapore device safety references (SS 702:2024) and security guidance from IMDA, alongside CSA cybersecurity labelling for consumer IoT, increasingly sit between manufacturing and retail. This influences SKUs, documentation, and testing flows.
Connectivity and ecosystem orchestration are concentrated among public agencies and telecom groups that affect both deployment scale and integration depth. ASEAN programs such as the ASEAN Digital Masterplan 2025 emphasize standards harmonization and digital infrastructure as enablers for cross-border scale, while national bodies such as Singapore IMDA/CSA and Malaysia MDEC/MCMC provide technical guidance, validation, and ecosystem partnership frameworks. Malaysia-based ecosystem collaboration activity involving MDEC and digital infrastructure players (such as edotco) reinforces how partnerships, sandboxes, and compliance validation help move smart home offerings from devices into managed services.
Competitive Landscape
Competitive Landscape
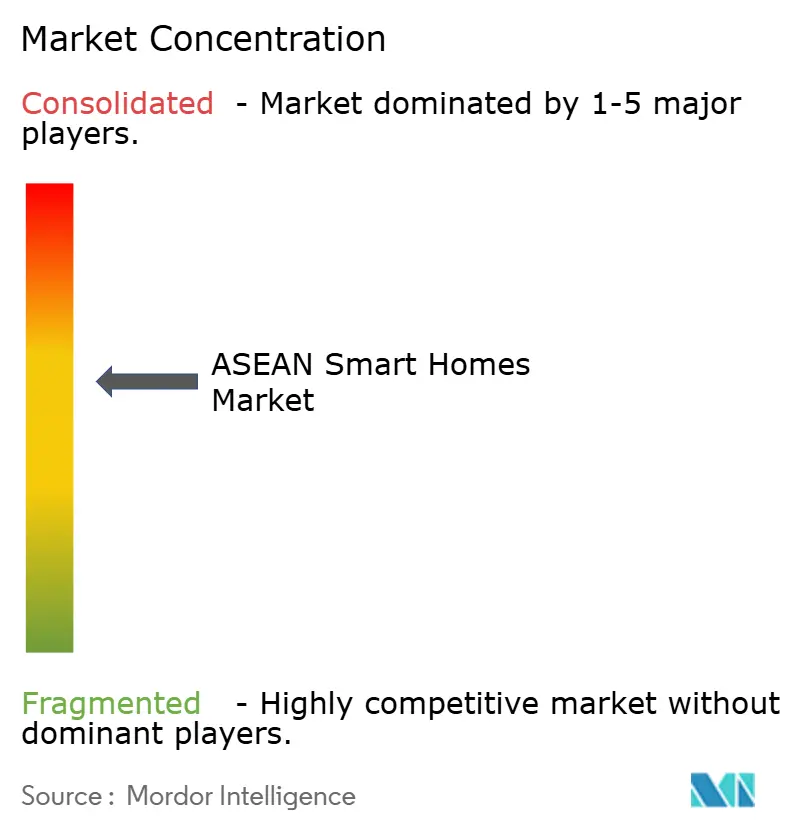
The ASEAN smart homes market remains moderately fragmented, yet ecosystem convergence is steadily consolidating share among platform leaders. Amazon, Google, Samsung, and Xiaomi exploit cloud, voice, and device ecosystems to lock in users. Xiaomi surpassed CNY 100 billion in Q4 2024 IoT and appliance revenue by packaging premium-feel products at mass-market prices, an approach that resonates in cost-sensitive ASEAN segments. Samsung allies with Aqara to integrate sensors into SmartThings, bridging legacy and Matter worlds and easing migration friction.
Regional specialists thrive by localizing for language, climate, and after-sales support. Vietnam’s Lumi deploys in-country assembly and a 150-strong distributor network to ensure rapid installation and maintenance. Thailand’s AiTAN targets commercial estates with 10,000-device deployments through a Tuya partnership that brings white-label flexibility. Channel innovation also shapes competition: ISPs leverage home-grown billing relationships, while e-commerce giants boost private-label device visibility through algorithmic promotions.
Supply-chain diversification remains a moving target; component makers shift capacity from China to ASEAN yet grapple with scale-up timelines that raise input costs in the interim. Firms that secure local assembly incentives in Vietnam or Malaysia gain tariff advantages and faster shipping windows. Strategic moves such as Google’s Thread chipset collaboration with MediaTek and Philips Hue’s AI security launch show how R&D alliances accelerate roadmap execution and create feature moats. Vendors that offer unified dashboards spanning lighting, HVAC, and security win higher customer lifetime value, nudging the market toward ecosystem stickiness and raising competitive barriers.
ASEAN Smart Homes Industry Leaders
Amazon.com Inc. (Ring/Echo)
Google LLC (Nest)
Samsung Electronics Co. Ltd (SmartThings)
Xiaomi Corp. (Aqara)
Signify N.V. (Philips Hue)
- *Disclaimer: Major Players sorted in no particular order

Market Opportunities and Future Outlook
Interoperability and cybersecurity assurance are becoming product-differentiation levers and commercial gating items across ASEAN, creating room for Matter-ready devices, compliant firmware lifecycles, and local test-and-certification support services. Singapore is a clear pull-through point, with SS 702:2024 tightening safety expectations for smart plugs and CSA raising residential router cybersecurity labelling by end-2027, which in turn pushes brands and channels toward secure-by-design devices and clearer consumer trust signals.
Telecom-led platforms and energy-linked bundles are also widening use cases beyond standalone gadgets. In the Philippines, PLDT Home, Meralco, and MSpectrum formed a June 2026 partnership around broadband, residential solar energy, and smart-home management, linking smart home control to household energy optimization. Regionally, True Digital Group’s work with VNPT Technology and T3 Technology on an AI home platform (MoU formalized in Dec 2025), plus TrueOnline’s AI-powered integration platform, points to active movement toward subscription and ecosystem-led distribution, where smart hubs, apps, and service layers support attach rates across security, lighting, and energy-management devices.
Recent Industry Developments
- July 2026: Amazon began phasing out its e-commerce fulfillment services in Singapore and ended Amazon Fresh grocery delivery operations in the market. The change reduces a direct retail and last-mile channel that could support device merchandising and fast replacement cycles for smart home peripherals. It also shifts more device distribution leverage toward regional marketplaces, telco bundles, and brick-and-mortar electronics chains.
- April 2026: Samsung expanded SmartThings integration with IKEA Matter-over-Thread devices, including compatible smart bulbs and plugs. This strengthens cross-brand interoperability at the platform layer and supports broader multi-vendor deployments without locking households into single-brand stacks. The update also reinforces Matter and Thread as practical purchase criteria rather than roadmap features.
- October 2024: Google began construction of a USD 2 billion data center in Selangor, Malaysia. The project adds regional cloud capacity that supports latency-sensitive smart home services, device management, and AI-driven features delivered through cloud backends. It also expands the infrastructure base that local developers and smart home platforms use to scale across ASEAN.


Research Methodology Framework and Report Scope
Market Definition and Coverage
For this study, the ASEAN smart homes market is defined as revenues earned from connected home devices and systems used in residences that automate, monitor, or optimize functions like security, energy, comfort, entertainment, and appliances across ASEAN.
Scope exclusions: We exclude commercial building automation deployments and residential construction services that are not tied to smart home device or system revenue.
Segmentation Overview
- By Product Type
- Smart Lighting
- HVAC and Energy-Management Devices
- Safety, Security and Access Control
- Smart Appliances
- Entertainment and Connectivity Hubs
- Water and Utility-Management Devices
- By Communication Protocol
- Wi-Fi
- Zigbee
- Bluetooth/BLE
- Z-Wave
- Thread and Matter
- Proprietary/Others
- By Sales Channel
- Online Retail and Marketplaces
- Telco/ISP Bundles
- Home-Improvement and Electronics Stores
- Value-added Service Integrators
- By Installation Type
- Retrofit
- New-Build Integrated
- By Country
- Indonesia
- Thailand
- Malaysia
- Vietnam
- Singapore
- Philippines
- Others
Data Sources, Market Sizing, and Validation
Desk Research
Desk research was used to set the market boundary and build the starting dataset for ASEAN demand signals and price direction. We reviewed official and public statistics and standards references such as national ICT and telecom regulator releases across ASEAN, ITU indicators, World Bank development metrics, and ISO or IEC smart home related standards notes.
To keep the model grounded, we also used public trade and customs statistics where available, energy efficiency and appliance labeling program information, and smart city or digital economy policy documents published by ASEAN governments. Company annual reports, investor presentations, and reputable press were then used to cross-check product mix changes, channel expansion, and common pricing behavior. We also used internal paid subscriptions for company financials and news screening, and a patent database to understand where device capability is improving and where ASP pressure may show up. These desk sources are illustrative only, and other references were used for data collection, validation, and clarification.
Primary Interviews and Surveys
Primary work focused on validating what is actually selling in ASEAN homes and how buyers decide between DIY devices and professionally installed systems. We spoke with a mix of manufacturers and distributors, installers and integrators, and online and offline channel participants, and also collected input from informed end users across key ASEAN markets. We used the feedback to tighten adoption assumptions and the pricing curves used for the forecast.
The interviews were also used to confirm which categories are growing faster (for example, security bundles and smart appliances), how promotion cycles affect realized ASPs, and where interoperability standards are improving attach rates over time.
Distribution of primary research fieldwork respondents
| Company type | Respondent position | Region |
|---|---|---|
| Top tier: 35% | CXOs: 15% | |
| Mid tier: 50% | Functional/Unit leaders: 28% | |
| Smaller Players: 15% | Managers: 57% |
Market-Sizing & Forecasting
Our sizing starts from a top-down demand pool build that links households and connected-home readiness to category adoption in the five covered ASEAN countries, and then translates adoption into value using typical price bands. To reduce the risk of drift, we corroborate totals with selective bottom-up approximations, including sampled category volumes by channel, installer run-rate checks, and a reasonableness roll-up of supplier revenue exposure where disclosure exists.
Key inputs that were tracked (illustrative) include household counts and urbanization trends, broadband and mobile internet penetration, smart speaker and hub adoption as an ecosystem proxy, mix shifts between security, energy management, and appliances, and the share of purchases occurring through e-commerce versus offline retail. We also monitor how installation type changes the ticket size, since professionally installed packages usually carry higher bundled values than DIY device purchases.
For forecasting, we relied on scenario analysis supported by short cycle indicators, because adoption in smart homes can move quickly with pricing promotions and platform standard changes. Growth paths were stress-tested using country-level affordability trends, device price erosion patterns, and expert views on interoperability and installer availability, and then adjusted when gaps existed due to limited public disclosure in smaller markets.
Data Validation & Update Cycle
Validation is done through multiple checks so that one dataset does not overly drive the outcome. We compare model outputs against independent signals like country-level connectivity trends, category shipment and import direction where available, and channel expansion cues, and then investigate large variances before sign-off.
If a metric shifts meaningfully, such as an ASP drop in a promotion-heavy year or a protocol change that accelerates adoption, we re-contact relevant experts and rerun the sensitive parts of the model. Reports are refreshed annually, with interim updates when material events occur, and right before delivery an analyst performs a final pass to ensure the latest available inputs are reflected.
Mordor Intelligence's Asean Smart Homes Market Size Compared With Other Published Estimates
Published market sizes for ASEAN smart homes can differ even when they appear to be describing the same topic, because the underlying timing and pricing logic often varies more than readers expect. Differences usually come from what gets counted as smart home revenue, how country coverage is handled within ASEAN, and how quickly assumptions are refreshed when device pricing and channel mix shift.
A refresh-led gap shows up when currency conversion timing, promotion-driven ASP declines, and category mix changes are not re-checked close to publication. In this study, recent retail pricing behavior and channel-driven realized ASPs were revalidated shortly before finalizing the current-year number, which is a key reason the estimate published by Mordor Intelligence lands where it does versus other figures.
Benchmark comparison
| Source | Market Size | Gaps in Research Methodology |
|---|---|---|
| Mordor Intelligence | USD 6.11 B (2026) | |
| Industry Research Outlet A | USD 4.80 B (2024) | Often presented as a Southeast Asia view with a different base year, and the value can reflect earlier currency timing and older ASP assumptions before recent promotion cycles in key ASEAN e-commerce channels. |
| Regional Consultancy B | USD 2.64 B (2025) | May use a narrower component boundary (for example, devices-only or selected categories) and may not fully account for bundled system values that are common in professionally installed security and energy packages. |
The spread in estimates is mainly explained by timing, pricing refresh, and what is included as smart home revenue rather than by a single modeling trick. When the scope is kept consistent across the five ASEAN countries and ASP logic is updated using recent channel feedback, the market size becomes easier to trace back to clear drivers and to replicate year after year.


Key Questions Answered in the Report
What is the current value of the ASEAN smart homes market?
The ASEAN smart homes market stands at USD 6.11 billion in 2026 and is projected to reach USD 12.56 billion by 2031.
Which product category leads the market today?
Safety, security and access control devices dominate with 31.45% revenue share, driven by urban safety concerns.
Why are telco bundles gaining traction?
Telco/ISP bundles spread hardware costs over monthly bills and leverage existing customer relationships, resulting in a 16.90% CAGR through 2031.
How significant is Thread and Matter adoption in ASEAN?
Thread- and Matter-enabled devices are growing at 16.55% CAGR as chipset vendors such as MediaTek embed native support, easing interoperability barriers.
Which country is growing fastest?
Vietnam is the fastest-rising market, expanding at 16.30% CAGR thanks to urbanization, rising incomes and local brand innovation.
What key barrier still limits adoption?
High upfront device and installation costs remain the largest obstacle, subtracting an estimated 2.8 percentage points from forecast CAGR until hardware prices fall further.
Page last updated on:






