
Market Overview
| Study Period | 2020 - 2031 |
|---|---|
| Forecast Data Period | 2026 - 2031 |
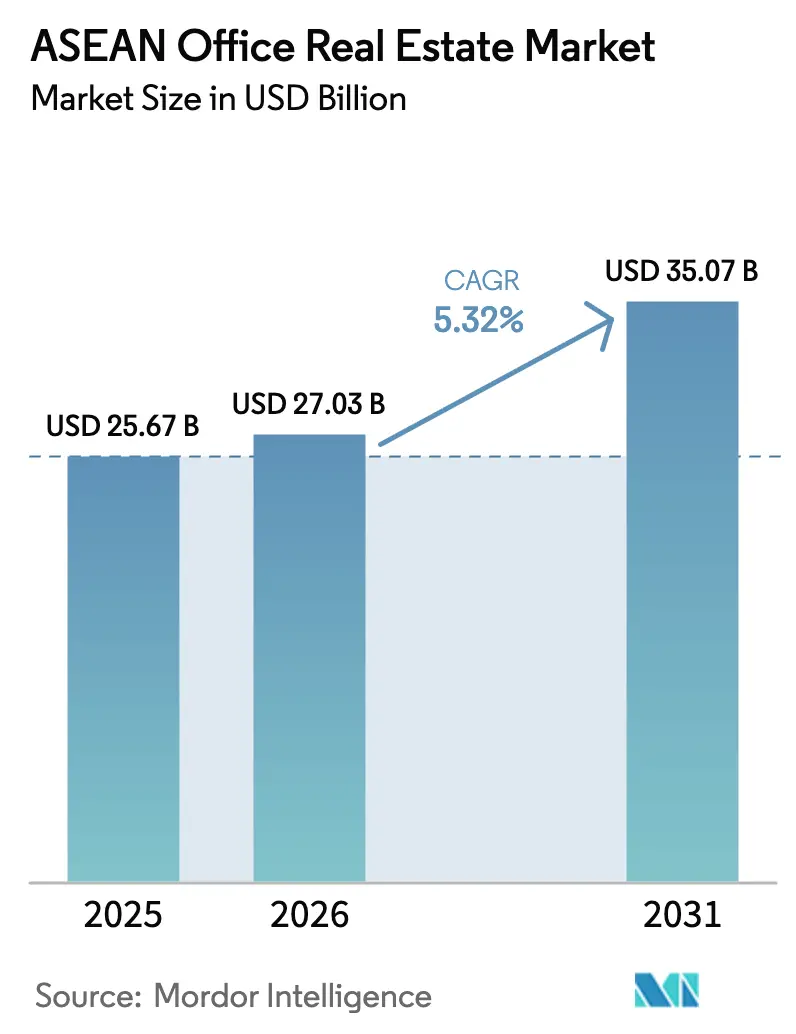
| Base Year Market Size (2025) | USD 25.67 Billion |
| Market Size (2026) | USD 27.03 Billion |
| Market Size (2031) | USD 35.07 Billion |
| Growth Rate (2026 - 2031) | 5.32 % |
| Market Concentration | Low |
Major Players *Disclaimer: Major Players sorted in no particular order Image © Mordor Intelligence. Reuse requires attribution under CC BY 4.0. | |
ASEAN Office Real Estate Market Analysis by Mordor Intelligence
The ASEAN office real estate market size was valued at USD 25.67 billion in 2025 and estimated to grow from USD 27.03 billion in 2026 to reach USD 35.07 billion by 2031, at a CAGR of 5.32% during the forecast period (2026-2031). Demand momentum is sustained by record foreign direct investment of USD 230 billion in 2023, which has tilted regional corporate footprints toward Southeast Asian capitals. Flight-to-quality preferences keep Grade A offices at the center of leasing strategies, while hybrid work policies push decision-makers to prioritize flexible layouts, digital infrastructure, and green certifications. Multinational tenants in banking, insurance, technology, and professional services continue to consolidate into a smaller number of premium addresses, reinforcing rent resilience in core districts. At the same time, limited prime supply pipelines in Singapore, Bangkok, and Jakarta restrain vacancy growth and support the ASEAN office real estate market’s medium-term pricing power. Government incentives that accelerate digital transformation and sustainability investment complement these trends by widening the tenant base and raising building specifications[1].
Key Report Takeaways
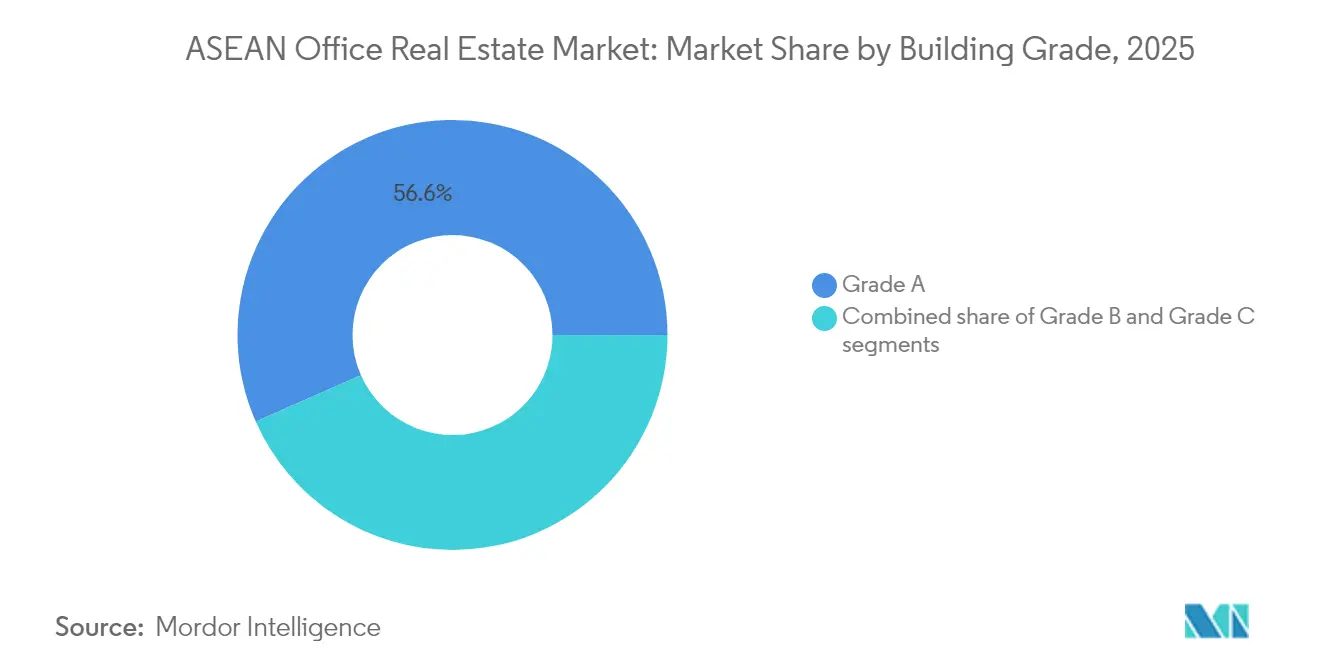
- By building grade, Grade A space led with 56.60% revenue share in 2025; it is projected to advance at a 6.05% CAGR through 2031.
- By transaction type, rentals commanded 69.70% of ASEAN office real estate market share in 2025, while sales are set to log the fastest 6.20% CAGR to 2031.
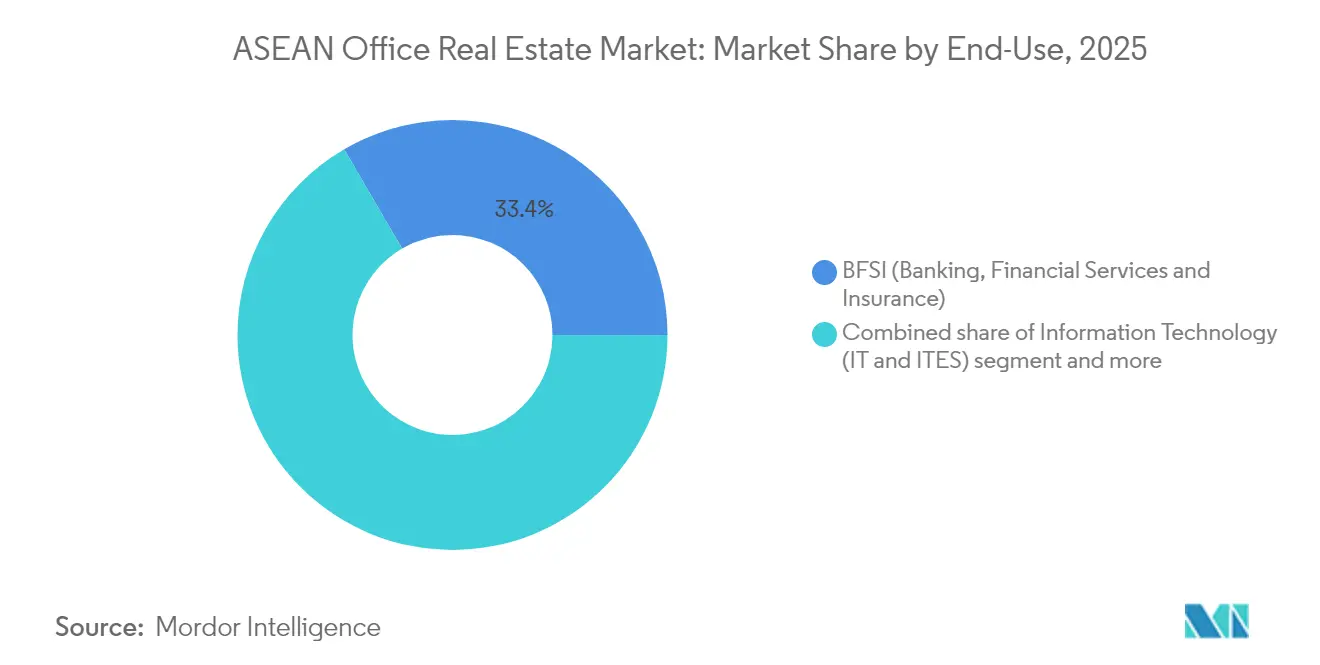
- By end use, BFSI occupiers held 33.40% of the 2025 ASEAN office real estate market size, whereas IT & ITeS segment revenues are forecast to rise at a 6.40% CAGR to 2031.
- By geography, Indonesia accounted for 47.40% of 2025 revenue, and Vietnam is expected to expand at a 6.72% CAGR between 2026-2031.
Note: Market size and forecast figures in this report are generated using Mordor Intelligence’s proprietary estimation framework, updated with the latest available data and insights as of 2026.
ASEAN Office Real Estate Market Trends and Insights
Drivers Impact Analysis*
| Driver | ( ~ ) % Impact on CAGR Forecast | Geographic Relevance | Impact Timeline |
|---|---|---|---|
| Sustained foreign investment in Vietnam, Indonesia, and the Philippines driving office demand | +1.5% | Vietnam, Indonesia, Philippines | Long term (≥ 4 years) |
| Gradual economic recovery across Southeast Asia improving corporate leasing sentiment | +1.2% | Indonesia, Thailand, Malaysia, Philippines | Medium term (2-4 years) |
| Limited new prime office supply in city cores supporting rental stability | +0.9% | Singapore, Bangkok CBD, Jakarta CBD | Medium term (2-4 years) |
| Hybrid work adoption increasing demand for flexible, well-located Grade A office spaces | +0.8% | Singapore, Malaysia, Thailand, urban centers | Short term (≤ 2 years) |
| Sustainability and green leasing priorities influencing tenant preferences | +0.6% | Singapore, Malaysia, Thailand | Long term (≥ 4 years) |
| Technology upgrades in commercial buildings enhancing operational efficiency | +0.4% | Global ASEAN markets | Medium term (2-4 years) |
| Source: Mordor Intelligence | |||
Sustained Foreign Investment in Vietnam, Indonesia and the Philippines Driving Office Demand
Vietnam captured 48.6% year-on-year FDI growth in January 2025, with processing and manufacturing projects taking 66.9% of inflows whitecase.com. Each new plant requires procurement, logistics and legal functions that gravitate to downtown Ho Chi Minh City towers, where Grade A vacancy dipped to 19.4% in 2024 cbrevietnam.com. Jakarta remains the natural hub for regional headquarters targeting ASEAN’s largest domestic market, while Metro Manila benefits from continued BPO contract wins. Foreign corporates attract a halo of auditors, consultants and IT vendors, reinforcing net absorption in the ASEAN office real estate market[2].
Gradual Economic Recovery Across Southeast Asia Improving Corporate Leasing Sentiment
Southeast Asia’s GDP is projected to grow 4.5% in 2025, underpinned by consumer spending and public infrastructure programs. Lease tenures are lengthening as firms abandon the stop-gap strategies adopted during the pandemic and commit to larger footprints in Manila, Jakarta, and Kuala Lumpur. Tourism-led services rebound is adding professional services employment that depends on well-equipped offices. Banks and insurers are enlarging client-facing space to capture cross-border trade flows accelerated by supply-chain realignment. Stronger cash flows let companies secure premium floors early, fostering a ripple effect of occupancy gains across upper-tier buildings in the ASEAN office real estate market.
Limited New Prime Office Supply in City Cores Supporting Rental Stability
Developers, squeezed by higher borrowing costs, are rolling out fewer speculative CBD projects. Singapore’s pipeline below 2027 stands at less than 2 million sq ft, fueling landlord pricing confidence even after 12 successive quarters of rent growth. Bangkok and Jakarta witness similar constraints as zoning and land scarcity limit large-scale additions. The scarcity of fresh Grade A stock sustains occupancy above 90% in top-tier towers, buffers cash yields for REITs and positions the ASEAN office real estate market for steady landlord-favored negotiations through mid-decade.
Hybrid Work Adoption Increasing Demand for Flexible, Well-Located Grade A Office Spaces
Forty-three percent of Asia-Pacific employers hit peak utilization rates above 80% despite smaller average daily attendance, proving that when staff come in, they value superior locations and collaboration zones. Hybrid policies, hence, reward towers with campus-style amenities, touch-free access, smart ventilation, and wellness facilities. Rents in such properties trade at USD 8.8 per sq ft per month in Singapore’s CBD, a 12% premium over non-certified peers. The bifurcation pushes older inventory toward obsolescence, while the ASEAN office real estate market channels both capital expenditure and tenancy into trophy assets clustered around mass-transit nodes.
Restraints Impact Analysis*
| Restraint | ( ~ ) % Impact on CAGR Forecast | Geographic Relevance | Impact Timeline |
|---|---|---|---|
| Interest rate pressures and funding constraints slowing new office project launches | -0.9% | Regional, particularly affecting development financing | Medium term (2-4 years) |
| High vacancy rates persist in older buildings due to occupier flight to quality | -0.7% | Singapore business parks, Jakarta non-CBD, older Bangkok developments | Short term (≤ 2 years) |
| Global economic uncertainty causing multinational firms to delay long-term leasing decisions | -0.5% | Singapore, Malaysia, Thailand (MNC-dependent markets) | Short term (≤ 2 years) |
| Regulatory inconsistency across ASEAN markets complicating regional expansion | -0.3% | Cross-border operations, particularly Vietnam, Indonesia | Long term (≥ 4 years) |
| Source: Mordor Intelligence | |||
Interest Rate Pressures and Funding Constraints Slowing New Office Project Launches
Asia-Pacific real estate investment volumes shrank 27% in 2024 as financing costs jumped and lenders tightened underwriting standards. Developers now require higher pre-commit levels or joint-venture equity for greenfield projects, pushing delivery timelines beyond 2028. While constrained pipelines support rent stability, they also cap market expansion potential in second-tier cities. The capital crunch, therefore, moderates the ASEAN office real estate market’s attainable CAGR during the forecast window.
High Vacancy Rates Persist in Older Buildings Due to Occupier Flight to Quality
Vacancy at Singapore’s Changi Business Park approached 40% in 2024 after large occupiers shed surplus space, underlining the widening gap between premium and secondary stock. Similar patterns in Jakarta and Bangkok reveal that buildings without sustainability credentials or modern cooling systems struggle to attract tenants. Owners face steep retrofit costs that erode returns, prompting sales or conversion to alternative uses. Near-term oversupply in legacy towers keeps headline vacancy elevated, tempering headline growth in the broader ASEAN office real estate market
*Our forecasts treat driver/restraint impacts as directional, not additive. The impact forecasts reflect baseline growth, mix effects, and variable interactions.
Segment Analysis
By Building Grade: Premium Assets Capture Value
Grade A assets contributed 56.60% of 2025 revenue, reaffirming their status as the backbone of the ASEAN office real estate market. These towers cluster in CBD corridors with mass-transit access and advanced digital infrastructure that meet global tenant criteria. Higher air-quality systems, column-free floorplates, and extensive ESG disclosures keep occupancy near 90%. Investors gravitate toward this tier to secure stable cash flows and hedge regulatory risk. Upgrades such as on-site renewable generation and smart-glass facades further embed Grade A properties into corporate sustainability roadmaps, underpinning a 6.05% CAGR outlook that outpaces the overall industry.
Grade B supply sits under competitive stress as tenants migrate upward. Landlords are compelled to unlock capital for retrofits or accept lower rents, shrinking yield differentials with Grade A. Some Grade C buildings exit the leasing pool altogether through conversion into co-living, education or data-center use-cases. In markets like Singapore and Kuala Lumpur, government incentives for deep-retrofit programs offer a lifeline, yet only the most centrally located structures can justify the required capex. Consequently, revenue concentration in prime assets is expected to intensify, reinforcing a core-plus investment narrative within the ASEAN office real estate market.

By Transaction Type: Rental Flexibility Dominates
Rentals accounted for 69.70% of the ASEAN office real estate market size in 2025 as corporates demanded agility amid evolving hybrid policies. Shorter lease tenures and expansion-contraction clauses give CFOs the headroom to recalibrate footprints quickly without heavy upfront capital. Flexible-space providers partner with landlords to curate turnkey suites, boosting service revenues and amenity depth. This model supports high building utilization on collaboration days and maintains predictable cashflows for owners.
Sales transactions, although forming a smaller base, are projected to log the highest 6.20% CAGR as owner-occupiers and core funds pivot to long-run value capture. Supply-constrained CBDs encourage blue-chip tenants to lock in future premises, while inflation-hedging motives spur pension funds toward direct buys. The rental-to-ownership mix hence diversifies, but flexibility will still define most new leases signed across the ASEAN office real estate market through 2031.
By End Use: Financial Services Lead, Technology Accelerates
BFSI (Banking, Financial Services and Insurance) organizations held 33.40% ASEAN office real estate market share in 2025, anchored by Singapore’s global finance hub positioning and Malaysia’s Islamic finance depth. Banks prioritize power-redundant buildings with robust cybersecurity infrastructure to run trading floors and digital banking labs. Regional regulators demand strict data-residency compliance, steering lenders to grade-A towers equipped with dedicated server rooms and secure fiber links. These specifications keep BFSI demand sticky in prime quarters even as branch footprints shrink elsewhere.
Information Technology and IT-enabled Services will expand at a market-leading 6.40% CAGR, buoyed by USD 60 billion of data-center capital set to flow into Southeast Asia by decade-end. Global hyperscalers, platform firms, and AI developers require adjacent office clusters to host engineering, sales, and policy teams. Governments nurture the ecosystem through skills programs such as Microsoft’s plan to train 2.5 million citizens in AI by 2025, translating into a steady pipeline of tech-sector occupiers throughout the ASEAN office real estate market.
Geography Analysis
Indonesia retains leadership with 47.40% 2025 revenue, underpinned by its USD 1.4 trillion economy and policy continuity that anchors manufacturing expansion. Government transport megaprojects are knitting Greater Jakarta into a unified labor catchment, boosting demand for well-connected Grade A floors. CBD occupancy hovered near 70% through 2024 while net absorption improved as oil-and-gas, telecom, and e-commerce groups recommitted to in-office collaboration. The city’s tightening green-building code is expected to nudge owners toward retrofits, further consolidating value in the upper tier of the ASEAN office real estate market.
Vietnam, forecast to grow at 6.72% CAGR, benefits from rapid FDI acceleration that feeds office uptake far beyond headline manufacturing projects. Ho Chi Minh City’s vacancy compression to 19.4% illustrates how support functions for export plants turn quickly into inner-city space requirements. Favorable credit-growth ceilings and a young digital workforce intensify corporate interest, prompting developers to fast-track premium towers in Thu Thiem and District 7. Hanoi experiences a similar pivot as multinational R&D centers emerge around Diplomatic District clusters, signaling durable depth across the ASEAN office real estate market.
Singapore, Thailand, Malaysia and the Philippines collectively offer mature yet distinct stories. Singapore’s supply-tight CBD keeps rents at USD 8.8 per sq ft per month even as hybrid adoption stabilizes. Malaysia positions Kuala Lumpur and the Johor-Singapore Special Economic Zone for cross-border synergies that could add USD 26 billion output annually. Thailand courts automotive and chipmakers through reduced corporate taxes in Eastern Economic Corridor zones, while the Philippines leverages English-speaking talent to deepen BPO clusters in Metro Manila and Cebu. Together these geographies provide the stability and scale that global investors seek when allocating to the ASEAN office real estate market.
Regulatory Landscape
Regulation in the ASEAN office real estate market is country-specific, with Singapore acting as the reference point for institutional-grade compliance because it is a regional capital hub and a listing venue for major office REITs. In Singapore, land use and development are governed under the Planning Act and administered by the Urban Redevelopment Authority (URA), while building control and codes are overseen by the Building and Construction Authority (BCA). For listed commercial vehicles, REIT managers are licensed under the Securities and Futures Act (SFA) and supervised by the Monetary Authority of Singapore (MAS), which sets requirements on business conduct, governance, and AML/CFT controls that shape acquisition, leasing, and disclosure practices for office-heavy portfolios.
A 2026 implementation theme is the alignment and tightening of governance requirements for REIT managers and registered business trusts, following MAS consultations on amendments to the Business Trusts Regulations and related collective investment scheme rules. These changes increase the compliance burden around board composition and director tenure, reinforcing the premium placed on institutional governance among managers and sponsors active across ASEAN. Across the region, differences in foreign ownership and land acquisition frameworks continue to add friction to cross-border expansion, so developers and asset managers often structure entry through local partnerships or regulated fund and REIT platforms.
Value Chain Analysis
The ASEAN office real estate value chain starts with site origination (land tender or private sale) and entitlement, followed by development and construction, leasing and tenant fit-out, and long-term operations and capital recycling. In mature markets such as Singapore, planning and approvals (URA, BCA) influence product design, green building specifications, and delivery timelines, while tenant requirements increasingly extend to digital infrastructure and sustainability reporting. Leasing intermediaries and property consultants support pre-commitments and churn management, and building operations increasingly rely on specialist facilities management and energy optimization providers as landlords pursue asset enhancement initiatives (AEIs) to defend Grade A positioning.
Capital formation and ownership are concentrated in listed and regulated vehicles, along with integrated developer-operators. REIT platforms (for example, CapitaLand Integrated Commercial Trust and Keppel REIT) act as core holders and operators of stabilized offices, while sponsors and developers (such as CapitaLand, UOL Group, City Developments, Frasers Property, and Keppel) source projects, execute development, and recycle assets into funds and REITs. Strategy has increasingly tilted toward partnerships and asset-light models to manage funding constraints, while using sustainability upgrades and portfolio pruning to preserve occupancy and financing access across ASEAN gateways.
Competitive Landscape
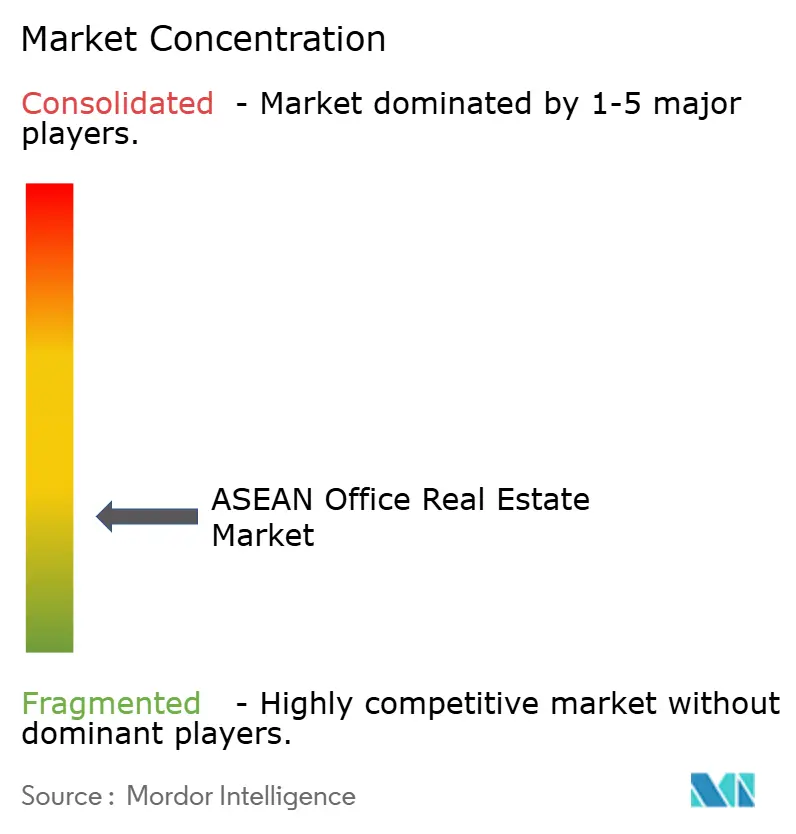
The ASEAN Office Real Estate Market is moderately fragmented, with diversified conglomerates, listed REITs, and local champions each carving niches. CapitaLand Group, UOL Group, and City Developments draw on integrated development, asset management, and hospitality arms to recycle capital quickly and capture end-to-end value streams. Mid-tier developers specialize in single-city portfolios or mixed-use precincts, often partnering with pension funds that require operating expertise. Flexible-space operators such as IWG and WeWork collaborate with landlords to activate under-utilized floors, adding subscription revenue and enhancing building stickiness within the ASEAN office real estate market.
Strategic moves center on portfolio pruning and upgrade. CapitaLand Ascendas REIT deployed USD 543.6 million in May 2025 to acquire two prime assets, signaling confidence in core CBD rent trajectories. Developers offload non-performing assets to recycle proceeds into ESG-compliant towers, while institutional investors increase direct stakes to hedge inflation. Cross-border diversification is also visible; Mapletree Investments opened an Abu Dhabi office in 2024 to source Middle-East capital and co-investment deals, balancing exposure across economic cycles. As capital requirements scale, smaller players either form joint ventures or exit, intensifying consolidation.
Technology and sustainability are the next battlegrounds. Leading landlords roll out digital twins, tenant apps, and energy analytics across portfolios, reducing operating costs and elevating user experience. Portfolio-wide net-zero roadmaps enhance access to green loans and sustainability-linked bonds, cutting weighted average cost of capital by up to 30 basis points. Competitive differentiation will therefore hinge less on sheer floorplate supply and more on integrated service, data transparency, and carbon footprint in the ASEAN office real estate market.
ASEAN Office Real Estate Industry Leaders
-
CapitaLand
-
UOL Group Limited
-
City Developments Limited
-
Frasers Property Limited
-
Keppel Management Ltd.
- *Disclaimer: Major Players sorted in no particular order
Market Opportunities and Future Outlook
The main opportunity is in upgrading and repositioning office stock toward Grade A, green-certified, and mixed-use formats as occupiers consolidate into fewer premium locations and older buildings face higher vacancy and retrofit needs. Evidence of this flight-to-quality and capital rotation is visible in large transactions and repositioning activity in Singapore, including CapitaLand Integrated Commercial Trust signing an agreement in April 2026 to acquire Paragon for S$3.9 billion, and CapitaLand opening Geneo at Singapore Science Park in May 2026 as a S$1.4 billion life sciences and innovation hub. Together, these moves point to demand for high-spec, amenitized workplaces tied to innovation clusters, with retail and medical components that can broaden footfall and stabilize income.
Cross-border expansion and regional platform-building also create whitespace, especially where Southeast Asian capitals are absorbing new corporate functions linked to investment inflows and supply-chain realignment. Singapore-based groups have continued to deepen their presence in Vietnam across commercial and logistics portfolios (as reflected in 2026 reporting on developers expanding in Vietnam), which supports ASEAN office strategies that combine CBD office exposure with adjacent ecosystem assets. On the capital markets side, changes to governance requirements for REIT managers implemented in 2026 in Singapore raise the bar for institutional management and disclosures, which can favor scaled operators with established compliance and reporting capabilities while encouraging smaller owners to partner, divest, or recapitalize to fund modernization.
Recent Industry Developments
- July 2026: CapitaLand Ascendas REIT announced the divestment of the Kim Chuan Telecommunications Complex in Singapore for S$200.4 million, with completion expected in H2 2026. The divestment of a non-core asset in Singapore office portfolio. The move enables capital recycling to redeploy into higher-yield assets and data-center opportunities.
- July 2026: Frasers Property Limited led a consortium that won the Bayshore precinct mixed-use site redevelopment in Singapore for S$2.13 billion. The opportunity represents a major mixed-use site acquisition affecting Singapore office and adjacent uses. It strengthens land bank and integration with commercial and residential components to support premium leasing demand.
- May 2026: CapitaLand officially opened Geneo, a S$1.4 billion life sciences and innovation hub at Singapore Science Park. The development marks a major new office and innovation hub in Singapore. It diversifies portfolio into life sciences and tech enabled assets and supports higher value tenancy demand.
Research Methodology Framework and Report Scope
Market Definition and Coverage
This market covers the value of office real estate activity across ASEAN, measured through realized and expected transactions and leasing economics for office buildings within the covered countries, expressed in USD and tracked over the study period.
Scope exclusions: we exclude non-office property types (such as retail, industrial, hospitality, and residential) and informal workspace arrangements that are not reported as office real estate transactions.
Segmentation Overview
- By Building Grade
- Grade A
- Grade B
- Grade C
- By Transaction Type
- Rental
- Sales
- By End Use
- Information Technology (IT & ITES)
- BFSI (Banking, Financial Services and Insurance)
- Business Consulting & Professional Services
- Other Services (Retail, Lifesciences, Energy, Legal)
- By Country
- Indonesia
- Vietnam
- Thailand
- Philippines
- Malaysia
- Singapore
- Rest of ASEAN
Data Sources, Market Sizing, and Validation
Desk Research
Desk research starts with public indicators that track how office demand and supply are moving across ASEAN, and we use them to set realistic bounds before building the model. Useful reference points include official macro and labor series from national statistics offices and central banks, plus urban planning releases and building approvals where they are published.
To anchor market behavior, we also review non-paywalled materials such as exchange filings and annual reports of listed property owners, stock exchange announcements, and investor presentations that discuss occupancy, rental reversion, and development pipelines. Where available, we cross-check with statistics from regional organizations such as ASEANstats and multilateral sources such as the World Bank and IMF for currency, inflation, and growth assumptions, since these inputs drive rent normalization in USD. Patent and standards sources are used only in a limited way for building systems context, and shipment-level import and export databases can help sanity-check construction input cycles when local disclosure is thin. The sources named here are illustrative, and other public documents and datasets were also used for collection, checks, and clarifications.
Primary Interviews and Surveys
Primary inputs came from interviews and surveys with market participants who see leasing, asset transactions, and project decisions firsthand, so our assumptions could be stress-tested against real deal behavior. We spoke with landlords and property managers, brokers and advisory teams, developers, and larger occupiers, with coverage balanced across core ASEAN markets and secondary cities where office absorption is still emerging.
Distribution of primary research fieldwork respondents
| Company type | Respondent position |
|---|---|
| Top tier: 31% | CXOs: 12% |
| Mid tier: 48% | Functional/Unit leaders: 42% |
| Smaller Players: 21% | Managers: 46% |
Market-Sizing & Forecasting
Sizing is built using a top-down approach where office stock, new supply, and occupied space are reconstructed country by country, and then converted into value using rental and transaction benchmarks that match local market practice. To keep totals realistic, we corroborate the outputs with selective bottom-up checks, such as sampled rent per square foot benchmarks multiplied by occupied area, and channel checks on deal flow for key districts.
The model is guided by practical fingerprints that tend to explain most of the movement in ASEAN offices, including vacancy and net absorption, new completions and pipeline timing, grade mix shifts, and the pace of rent resets during lease renewals. We also include inflation, interest rates, and currency timing because USD reporting can change year on year even when local rents look steady. For forecasting, scenario analysis is used around demand recovery and new supply delivery, then the selected path is aligned with what interviewees describe for leasing sentiment, pre-commitment levels, and tenant downsizing or expansion plans. Where country or city disclosure is incomplete, we fill gaps using proxy indicators (like building permits and listed owner disclosures) before applying conservative normalization factors, which are then rechecked in validation.
Data Validation & Update Cycle
Validation is done through triangulation across independent signals, so no single dataset drives the final number. Our team runs variance checks between implied rents, occupancy, and stock changes, and any outliers are reviewed again to confirm whether they reflect one-off deals, policy changes, or reporting noise.
Before sign-off, the model is reviewed in steps, with assumptions challenged and recalculated where sensitivities look unusually high, followed by targeted re-contacts when a key input moves beyond expected ranges. Reports are refreshed annually, and interim updates are made when material events occur, such as rate shocks, major completions, or sharp currency swings. Right before delivery, an analyst performs a final pass so clients receive the most current view available at that time.
Mordor Intelligence's Asean Office Real Estate Market Size Compared Against Other Published Estimates
Published market values for ASEAN office real estate can differ quite a bit because underlying definitions are not always consistent, and timing assumptions can shift the USD value materially. Differences usually come from what is counted as market value (rent flow versus asset sales), how vacancy and renewals are treated, and whether local currency figures are converted using annual averages or a single point in time.
A common gap driver is refresh cadence and currency timing. For example, a model updated after a policy rate change or a sharp FX move can produce a different USD total even if local leasing is stable, and those update steps are handled through scheduled assumption resets and variance checks in Mordor Intelligence.
Benchmark comparison
| Source | Market Size | Gaps in Research Methodology |
|---|---|---|
| Mordor Intelligence | USD 27.03 B (2026) | |
| Regional Consultancy A | USD 30.80 B (2026) | Often aggregates prime CBD rent cycles with broader suburban stock using fewer vacancy and renewal adjustments, which can lift the implied occupied rent pool in a given year. |
| Industry Association B | USD 24.90 B (2025) | Typically relies on member-reported transactions and may undercount markets with lower disclosure, and it may use a different USD conversion convention for local rents and sales values. |
Looking at the spread, the higher figure is usually explained by more aggressive occupancy and rent reset assumptions, while the lower figure tends to reflect partial coverage and conservative conversion choices. Our approach stays traceable because each country total is tied back to stock, occupancy, and rent or transaction inputs, and then checked again for currency and timing consistency before the final roll-up.
Key Questions Answered in the Report
What is the current size of the ASEAN office real estate market?
The market stands at USD 27.03 billion in 2026 and is forecast to reach USD 35.07 billion by 2031.
Which country holds the largest ASEAN office real estate market share?
Indonesia leads with 47.40% of 2025 revenue thanks to its large domestic economy and Jakarta’s dominant CBD.
Which segment is growing fastest in the ASEAN office real estate market?
IT & ITeS demand is projected to expand at a 6.40% CAGR through 2031 as global tech firms upscale Southeast Asian operations.
How is hybrid work influencing office demand?
Hybrid policies concentrate demand in flexible, well-amenitized Grade A towers, driving rent premiums of around 12% for certified buildings.
What is the outlook for office supply in core ASEAN CBDs?
Limited speculative pipelines in Singapore, Bangkok and Jakarta point to continued landlord pricing power over the next four years.
Why are sustainability features important for office assets?
Green-certified buildings attract higher rents, lower operating costs and enable tenants to meet corporate ESG commitments, enhancing long-term asset value.