
Market Overview
| Study Period | 2020 - 2031 |
|---|---|
| Forecast Data Period | 2026 - 2031 |
| Base Year Market Size (2025) | USD 4.55 Billion |
| Market Size (2026) | USD 5.99 Billion |
| Market Size (2031) | USD 23.58 Billion |
| Growth Rate (2026 - 2031) | 31.55 % |
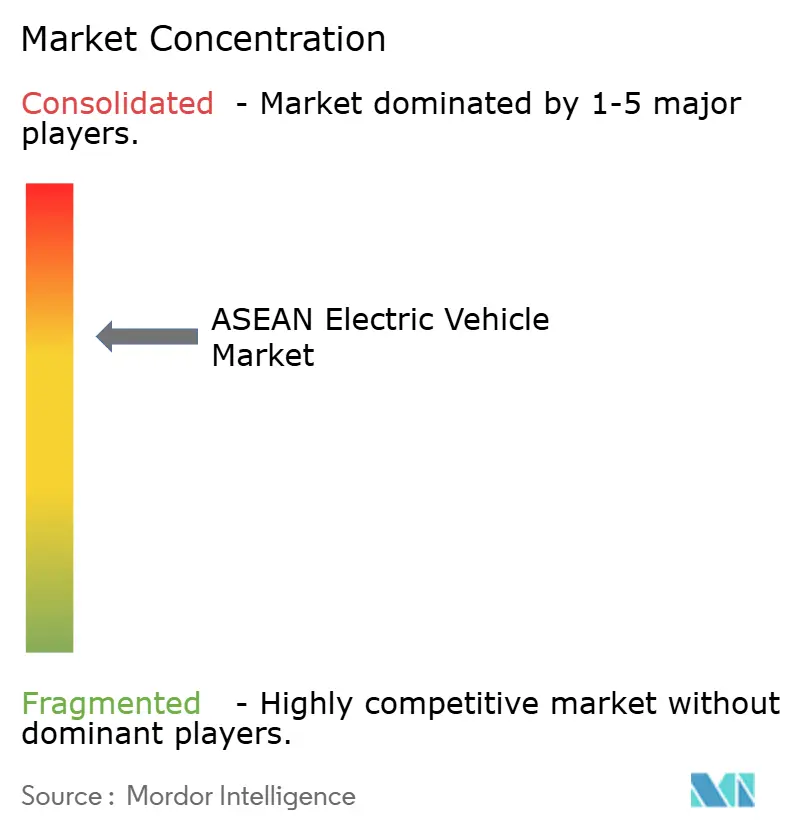
| Market Concentration | Medium |
Major Players *Disclaimer: Major Players sorted in no particular order Image © Mordor Intelligence. Reuse requires attribution under CC BY 4.0. | |
ASEAN Electric Vehicle Market Analysis by Mordor Intelligence
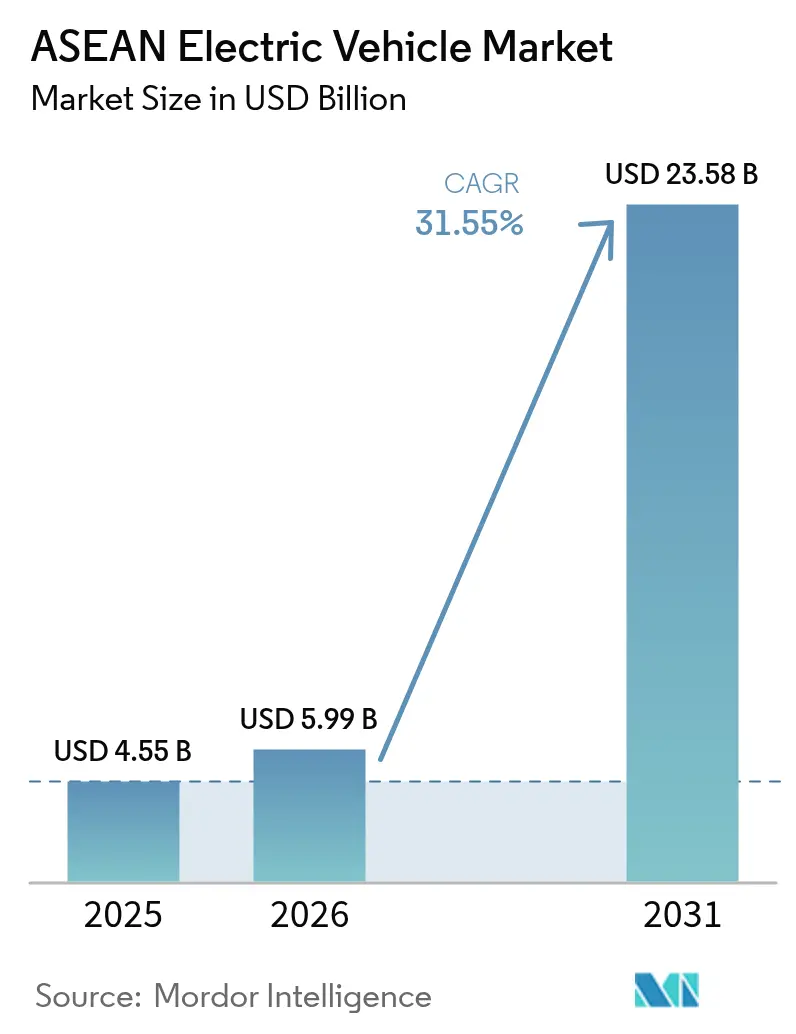
The ASEAN electric vehicle market size is expected to grow from USD 4.55 billion in 2025 to USD 5.99 billion in 2026 and is forecast to reach USD 23.58 billion by 2031 at 31.55% CAGR over 2026-2031. Spirited government incentives, abundant nickel reserves that underpin local battery supply chains, and the rapid build-out of public and private charging infrastructure anchor this trajectory. Thailand’s EV3.5 subsidy program, Indonesia’s luxury-tax exemptions, and Vietnam’s multi-year registration-fee waivers widen consumer access while compelling original-equipment manufacturers (OEMs) to localize production. Chinese automakers leverage aggressive pricing and early-mover manufacturing investments to dominate early market share positions while Japanese, Korean, and regional brands accelerate catch-up strategies. Grid integration initiatives under the ASEAN PowerGrid and maturing battery-swap ecosystems for two-wheelers open fresh revenue pools across services, software, and second-life battery streams.
Key Report Takeaways
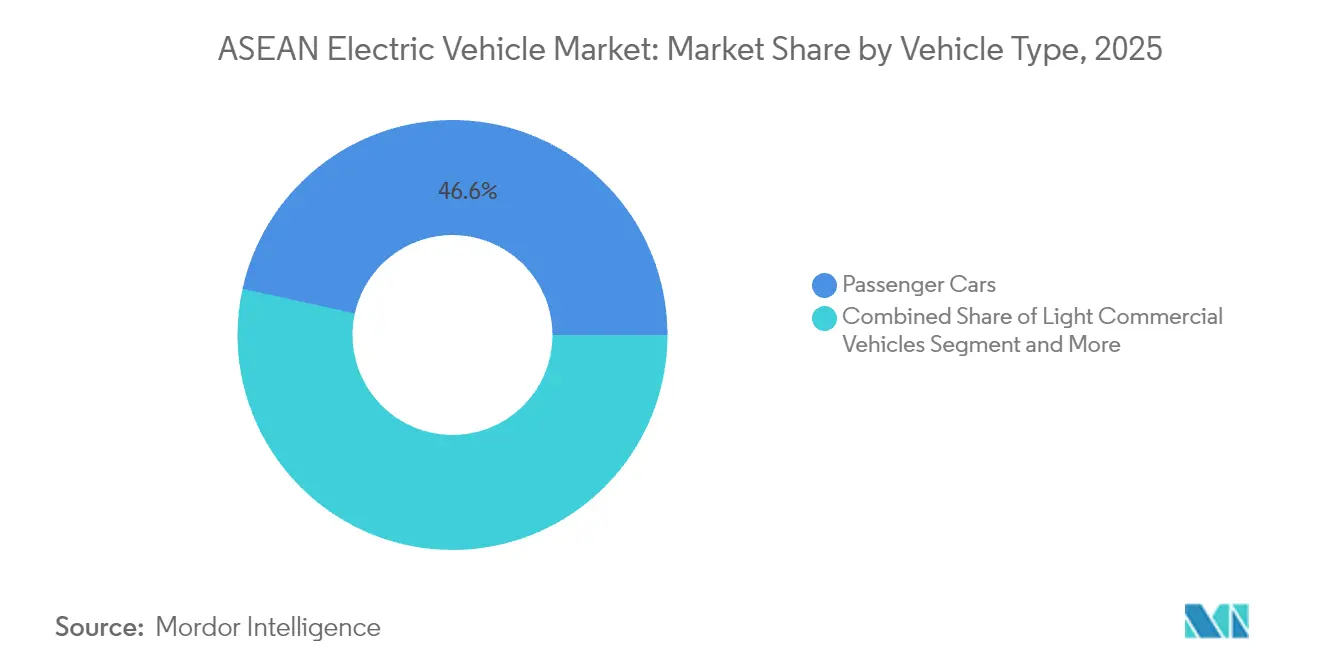
- By vehicle type, passenger cars led with 46.55% share of the ASEAN electric vehicle market size in 2025, whereas two- and three-wheelers are poised to grow at a 32.40% CAGR to 2031.
- By drive-train, battery electric vehicles captured 85.70% share of the ASEAN electric vehicle market size in 2025, while fuel-cell electric vehicles are advancing at a 38.90% CAGR during 2026-2031.
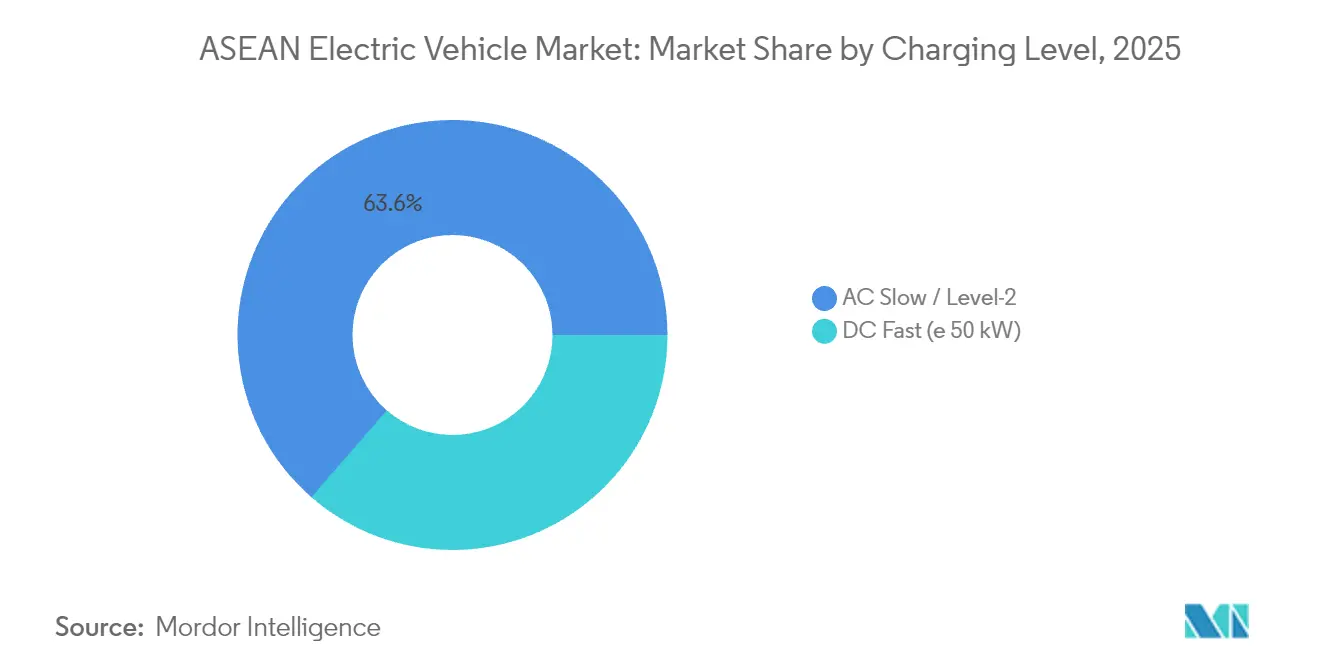
- By charging level, AC slow/Level-2 installations held 63.60% of the ASEAN electric vehicle market size in 2025; DC fast-charging points are forecast to rise at a 32.85% CAGR through 2031.
- By end-user, personal and household customers accounted for 75.10% of the ASEAN electric vehicle market size in 2025, yet commercial fleets are on track for a 33.60% CAGR to 2031.
- By country, Thailand commanded 38.95% of the ASEAN electric vehicle market share in 2025; Indonesia is projected to expand at a 33.10% CAGR through 2031.
Note: Market size and forecast figures in this report are generated using Mordor Intelligence’s proprietary estimation framework, updated with the latest available data and insights as of 2026.
ASEAN Electric Vehicle Market Trends and Insights
Drivers Impact Analysis*
| Driver | (~) % Impact on CAGR Forecast | Geographic Relevance | Impact Timeline |
|---|---|---|---|
| Government EV Purchase Incentives | +8.5% | Thailand, Indonesia, Vietnam, Philippines | Short term (≤ 2 years) |
| OEM Localization Commitment | +7.1% | Thailand, Indonesia, Malaysia | Medium term (2-4 years) |
| Rapid DC Charging Rollout | +6.2% | Thailand, Indonesia, Malaysia, Singapore | Medium term (2-4 years) |
| Nickel Battery Supply Advantage | +5.8% | Indonesia, Philippines | Long term (≥ 4 years) |
| Zero-Tariff EV Trade | +4.3% | ASEAN-wide | Short term (≤ 2 years) |
| Two-Wheeler Battery Swap | +3.9% | Vietnam, Indonesia, Thailand | Medium term (2-4 years) |
| Source: Mordor Intelligence | |||
Government Purchase and Excise-Tax Incentives
Aggressive fiscal programs underpin early adoption across the ASEAN electric vehicle market. Thailand channels 34 billion baht in subsidies that require local assembly for eligibility, a policy mirrored by Indonesia’s 0% luxury tax and 1% VAT on battery electric vehicles through 2025. Vietnam has extended registration-fee exemptions until 2027, while Malaysia targets a 20% EV sales mix by 2030 via purchase-tax relief and import-duty waivers. The Philippines mandates a 5% EV share in government and corporate fleets under the Electric Vehicle Industry Development Act, further reducing landed costs through zero-tariff imports. These coordinated instruments have lifted Thailand’s EV sales and turbocharged Vietnam’s electric-motorcycle sales volumes[1].
OEM Localization Commitments
The ASEAN electric vehicle market is shifting from import-led to locally manufactured supply. BYD’s USD 1 billion Indonesian hub coming online in late 2025 will produce 150,000 vehicles annually, while Hyundai’s USD 1.55 billion complex near Jakarta adds 250,000-unit capacity. Thailand has secured over USD 3 billion in Chinese OEM pledges, anchored by Great Wall Motor and Chery. VinFast’s outward expansion includes new lines in Indonesia and India, and Geely enters via a joint venture with PT Handal Indonesia Motor to scale 100 retail outlets in three years. These factories meet rising local-content thresholds, compress logistics costs, and seed component ecosystems across batteries, power electronics, and software.
Rapid Roll-Out of DC Fast-Charging Corridors
Charging density moves from bottleneck to catalyst as policymakers and utilities co-invest in public networks. Thailand operates 3,720 public stations as of March 2025 and targets 12,000 by 2030, complemented by 1,450 battery-swap kiosks. Indonesia counts 1,582 public chargers across 1,131 sites after a 157% annual build-out, while home-charger installations climbed 334% to 14,524 units in 2024. Singapore maintains one charger for every three EVs and plans for 60,000 points by 2030, the region’s highest per-capita ratio. Malaysia’s February 2025 guidelines codify technical and safety norms to support 10,000 stations. Vietnam’s VinFast leads with 150,000 ports yet still faces a shortfall estimated by the International Energy Agency at up to 350,000 additional units by 2040 [2].
Nickel-Rich Battery Supply Advantage
Indonesia’s ban on unprocessed ore exports diverts global battery investment toward its domestic refining parks. The country controls about 52% of worldwide nickel reserves and seeks 140 GWh of cell capacity by 2030, aiming for a top-three global ranking by 2027. POSCO’s USD 441 million refinery will launch in North Maluku in 2025, while Zhejiang Huayou Cobalt will replace LG Energy in the USD 7.7 billion Project Titan. Downstream integration shortens lead times, lowers cathode costs, and anchors battery exports to Thailand, Vietnam, and the Philippines. Manila explores similar pathways but weighs the environmental trade-offs of intensified mining against the economic upside.
Restraints Impact Analysis*
| Restraint | (~) % Impact on CAGR Forecast | Geographic Relevance | Impact Timeline |
|---|---|---|---|
| High EV Price Gap | -4.8% | ASEAN-wide; notably Indonesia, Philippines | Short term (≤ 2 years) |
| Patchy Tier-2 Charging | -3.2% | Indonesia, Philippines, Myanmar, Cambodia, Laos | Medium term (2-4 years) |
| Grid Instability, Peak Loads | -2.7% | Indonesia, Philippines, Vietnam | Long term (≥ 4 years) |
| Diesel Pickup Cultural Preference | -1.9% | Thailand, Malaysia, Indonesia | Long term (≥ 4 years) |
| Source: Mordor Intelligence | |||
High Retail Price Gap Vs. ICE
Entry-level EVs across ASEAN are often priced at twice that of comparable internal-combustion models, curbing mass-market uptake. Indonesia’s penetration reached 9.1% in 1H 2025 despite a 267% sales spike, as the remaining sticker premium deters cost-sensitive buyers. Thailand’s premium-car sub-segment experienced softening demand once incentives tapered, revealing elasticity to subsidy removal. Freight operators highlight elevated upfront costs for medium-duty trucks, even though battery-swap pilots hint at 30-40% lifetime savings. Continual price compression depends on localized battery packs and scale economics from new regional plants [3].
Patchy Charging Outside Tier-1 Cities
Metropolitan clusters capture most infrastructure investment, whereas rural corridors trail in charger density. Indonesia’s 1,582 public units mainly serve Java and Bali, leaving archipelago provinces underserved. Vietnam’s network remains concentrated in Ho Chi Minh City and Hanoi despite soaring electric-motorcycle adoption, intensifying range anxiety in provincial areas. The Philippines operates 912 chargers for more than 110 million residents and targets 7,300 by 2028, yet execution risks persist around land-use and permitting. Reliability audits show higher fault rates at public-sector stations, underscoring the maintenance burden on cash-strapped local agencies.
*Our forecasts treat driver/restraint impacts as directional, not additive. The impact forecasts reflect baseline growth, mix effects, and variable interactions.
Segment Analysis
By Vehicle Type: Two-Wheelers Drive Electrification
Passenger cars delivered 46.55% of the ASEAN electric vehicle market in 2025, yet electric motorcycles posted a sales jump in Vietnam in 1H 2025, powered by VinFast’s 488% domestic surge. Two- and three-wheelers are rewriting the growth script, projecting a growth of 32.40% CAGR by 2031. Indonesia and Thailand replicate this momentum through ride-hail incentives that waive parking fees and license-plate charges. The light-commercial segment gains traction as e-commerce fulfillment fleets log 20-30% fuel savings, nudging logistics operators toward electrification mandates. Medium and heavy trucks lag while waiting for higher-density batteries and fiscal levers that neutralize upfront differentials.
Urban delivery riders cite the convenience of battery-swap networks that compress refueling to under two minutes. Vietnam targets 1 million zero-emission motorcycles by 2030, an ambition linked to congestion-charge exemptions in Hanoi. Singapore pilots electric ride-hail permits that prioritize emissions-free vehicles at high-density airport ranks, enhancing driver economics. Buses and coaches benefit from municipal procurement targets, with Singapore aiming for 50% electric buses by 2030 and Vietnam’s Nghe An province mandating fully electric additions from 2025. Collectively, these policies accelerate modal diversification within the ASEAN electric vehicle market.

By Drive-Train Technology: BEV Dominance with FCEV Emergence
Battery electric vehicles maintained 85.70% ASEAN electric vehicle market share in 2025 and anchor most OEM roadmaps through 2031. Lower battery prices, rising energy density, and expanded charging corridors reinforce consumer confidence. Plug-in hybrids carve out a transition niche in Thailand where public skepticism over highway charger availability lingers. Toyota leverages brand equity by bundling home-charger installation and extended warranties, insulating hybrid residual values.
Fuel-cell electric vehicles register the highest 2026-2031 CAGR at 38.90% from a small base. Indonesia’s PLN opened the sub-region’s first hydrogen station in Jakarta in 2024 and plans 22 green-hydrogen plants producing 203 tons yearly. Singapore tests hydrogen buses on dedicated lanes near port zones, and Malaysia’s Petronas evaluates blue-hydrogen blending for commercial fleets. A pan-ASEAN working group is drafting fuel-cell safety codes to align with UN Regulation 134, a prerequisite for scaled imports. This technology pluralism cushions the ASEAN electric vehicle market against raw-material volatility.
By Charging Level: DC Fast-Charging Acceleration
AC slow chargers dominate household and workplace settings but face saturation limits. Their installed base represented 63.60% of 2025 infrastructure, supported by packaged incentives from utilities that discount off-peak energy. Demand for 150-kW and above DC nodes grows as ride-hail, taxi, and intercity bus operators compress turnaround times, propelling a 32.85% CAGR. Thailand prioritizes highway rest-stop rollouts, using grant-matching schemes to attract private capital.
Indonesia’s PLN app integrates charger reservation, payment, and diagnostic alerts, galvanizing user trust. Singapore enforces interoperability through a national backend that pools data from all charge-point operators to optimize future grid upgrades. Malaysia stipulates that new high-rise developments allocate 15% of parking bays to EV charging to avert retrofit challenges. Dynamic-pricing pilots in Thailand’s Provincial Electricity Authority show that time-of-use spreads of 40% between peak and valley can shift 22% of overnight charging load, easing distribution strain.
By End-User Type: Commercial Fleet Transformation
Household buyers captured 75.10% of the ASEAN electric vehicle market size in 2025, thanks to rising model availability and generous incentives. Corporations now accelerate fleet overhauls to hit ESG targets and secure fuel-expense savings, delivering a 33.60% CAGR outlook for commercial segments. Grab and Lazada pilot electric two-wheelers with battery-swap subscriptions that halve operating costs per mile compared with gasoline scooters.
Municipal transit agencies lock in bulk orders for electric buses under sovereign-bond-backed procurement, ensuring vendor financing at favorable rates. The Philippines’ Electric Vehicle Industry Development Act aims a 5% electric share for all government and corporate fleets, creating predictable demand for mid-range sedans and vans. Indonesia showcased 395 electric cars and 90 motorcycles during the 2025 ASEAN Summit, signaling official endorsement. Extended-warranty packages and telematics-based insurance discounts further strengthen the commercial value proposition.
Geography Analysis
Thailand sustains leadership in the ASEAN electric vehicle market, holding 38.95% share in 2025 on the back of its “Detroit of Asia” manufacturing cluster and the EV3.5 incentive that blends subsidies with local-content rules. Domestic sales climbed 40% in 2025, supported by 3,720 public chargers and the goal for 30% of all vehicle production to be electric by 2030. The revised 2025 subsidy now awards 1.5 credits for each exported EV, incentivizing OEMs to leverage Thailand as a regional export hub.
Indonesia shows the steepest trajectory, tracking a 33.10% CAGR through 2031, fuelled by its 52% share of global nickel reserves and a USD 1.3 billion BYD plant coming online in 2025. Policy relief like 0% luxury tax, 1% VAT, and duty-free parts imports persists until the end of 2025. The Indonesia Battery Corporation orchestrates joint ventures that target 140 GWh cell capacity by 2030, elevating the country to a pivotal supply-chain node.
Vietnam leads two-wheeler electrification, with electric-motorcycle volumes up 99.2% in H1 2025. Hanoi and Ho Chi Minh City roll out congestion-zone exemptions and low-interest loans for small-format EVs. Malaysia’s sales jumped from 850 units in 2021 to 14,800 in 2024 due to import-duty waivers and a 10,000-charger roadmap. Singapore posts the highest adoption rate at 19% of new cars in 2023, anchored by dense charging and carbon taxes on high-emission vehicles. The Philippines capitalizes on zero-tariff imports under EVIDA, while Brunei, Cambodia, Laos, and Myanmar craft foundational policies around fiscal stimuli and grid readiness, completing the mosaic of the ASEAN electric vehicle market.
Regulatory Landscape
ASEAN policy direction increasingly emphasizes regional alignment on safety and ecosystem standards, anchored by the ASEAN Leaders Declaration on Developing a Regional EV Ecosystem (2023) and the ASEAN Guidelines for Light Electric Vehicles (LEV) approved in 2024. Safety convergence has focused on UNECE regulations used by member states as reference points, including UN Regulation No. 100 (battery safety) and UN Regulation No. 138 (AVAS). This supports cross-border market access and procurement consistency alongside work by bodies such as ASEAN NCAP on EV safety and infrastructure policy alignment.
At the national level, incentives are being tightened to favor localization. Thailand continues to operate under the EV3 and EV3.5 frameworks, extending key deadlines into January 2026 (EV3 domestic registration) and January 2028 (EV3.5). The country uses export credits where one locally produced EV for export counts as 1.5 units toward production obligations, while maintaining an import-to-local production compliance structure (1:2) with flexibility via exports. Indonesia has moved to end incentives for CBU imported EVs effective January 1, 2026, and is raising Domestic Component Level (TKDN) requirements from 40% toward 60%, reinforcing the shift from import facilitation to locally built EV and battery supply chains.
Value Chain Analysis
The ASEAN EV value chain is increasingly organized around a regional division of labor spanning upstream raw materials, midstream battery production, and downstream vehicle assembly and distribution. Indonesia anchors the upstream through nickel resources and industrial parks targeting cell and precursor production, while Thailand leverages established automotive clusters and logistics to scale multi-brand EV assembly under incentive schemes that tie benefits to local production. Malaysia complements this with electronics manufacturing depth and CKD assembly pathways, which have become more relevant as policy screens prioritize localization for market access.
Downstream assembly and go-to-market are being reinforced by local manufacturing milestones and broader ecosystem build-out. In Malaysia, Stellantis commenced local assembly of the Leapmotor C10 at its Gurun plant (June 2026), and EP Manufacturing Berhad (EPMB) started full production of BAIC vehicles in Malacca (January 2026), with MG assembly ramp plans also indicated at the same hub in 2026. Across the region, core-component dependence on China, Japan, and South Korea remains a constraint for batteries, power electronics, and advanced software, while gaps in skilled labor, R&D intensity, and charger density outside Tier-1 corridors continue to affect cost, reliability, and scale economics for OEMs, charging operators, and fleet integrators.
Competitive Landscape
Chinese brands hold a commanding early lead in Thailand’s 2025 battery-electric segment and Indonesia’s first-half registrations. BYD scales rapidly with the Atto 3 and Dolphin models, complemented by Denza for premium buyers. Great Wall Motor introduces the Ora Good Cat, leveraging Thailand’s free-trade zone advantages. Japanese incumbents answer with hybrid-dominated portfolios while fast-tracking dedicated EV lines; Toyota will commence Indonesian production in 2026, and Isuzu readies an electric pickup tailored to Southeast Asian duty cycles.
Strategic alliances shape market positioning. SAIC partners with Huawei on smart-cockpit software to capture digital-native consumers, whereas Hyundai collaborates with LG Energy Solution on integrated battery packs for Indonesian models. Grab’s fleet-electrification accord with BYD secures preferential pricing and embedded telematics, creating a platform lock-in. Battery recycling emerges as a white-space play, with Singapore’s TES partnering with local utilities to pilot closed-loop programs by 2026.
Price competition narrows margins, prompting OEMs to layer subscription-based services such as autonomous-driving over-the-air updates and energy-management apps. Regulatory convergence across ASEAN on safety and emissions standards lowers certification costs but raises compliance thresholds, favoring capital-rich players. Scale efficiencies, localized chemistries, and digital ecosystems thus converge to redefine winners in the ASEAN electric vehicle market.
ASEAN Electric Vehicle Industry Leaders
-
BYD Co. Ltd.
-
SAIC Motor / MG Motor
-
Hyundai Motor Company
-
Wuling Motors
-
VinFast Auto Ltd.
- *Disclaimer: Major Players sorted in no particular order
Market Opportunities and Future Outlook
Localization-focused policy shifts create whitespace for CKD programs, component localization, and supplier localization services across Thailand, Indonesia, and Malaysia. Thailand’s Board of Investment reported more than USD 4.1 billion in EV supply-chain investments across 198 projects as of July 2026, including 18 BEV projects and 57 battery and energy storage projects. This supports opportunities in pack assembly, thermal management, power electronics, and testing and certification services tied to UNECE-aligned requirements. Malaysia’s revised CBU EV import criteria implemented in July 2026, including minimum CIF value and motor-output thresholds, also strengthens the commercial case for local assembly, homologation, and localization of high-run-rate parts.
Battery-linked incentives and upstream integration open additional opportunities in Indonesia, where policy tools are being used to steer demand and investment toward locally advantaged chemistries and supply chains. In June 2026, Indonesia announced plans for a VAT-borne-by-government (PPN DTP) approach for electric cars that differentiates coverage by battery type, which gives OEMs and suppliers a clearer planning pathway aligned with domestic industrial priorities. On the manufacturing side, Indonesia continues to attract large-scale OEM commitments, including VinFast’s officially inaugurated Subang facility in West Java (December 2025), tied to a total planned USD 1 billion investment and a stated 350,000-unit annual capacity target. That strengthens opportunities for tier suppliers, logistics providers, charging operators, and aftersales networks scaling alongside new plants.
Recent Industry Developments
- July 2026: Malaysia implemented revised import criteria for fully built-up (CBU) electric vehicles, including minimum CIF value and motor output thresholds. The change shifts competitive advantage toward locally assembled models and accelerates CKD program economics for brands targeting price-sensitive segments. It also raises the importance of local homologation, supplier localization, and assembly capacity planning.
- April 2026: MG Motor Malaysia launched the locally assembled (CKD) MGS5 EV in Malaysia, following the first CKD line-off at the PEPS JV facility in Melaka in March 2026. The initiative expands locally built EV offerings and supports faster lead times and pricing flexibility compared with CBU imports. It also strengthens Malaysia’s role as a staging point for right-hand-drive ASEAN markets under tightening import screens.
- August 2024: Hyundai committed 1 billion baht (USD 28 million) toward a Thailand plant planned for 2026 production under the EV3.5 scheme. The investment aligns with Thailand’s incentive structure that ties benefits to local manufacturing and export-linked compliance. It supports deeper localization of components and reinforces Thailand’s position as a regional EV assembly and export hub.
Research Methodology Framework and Report Scope
Market Definition and Coverage
For this study, the ASEAN electric vehicle market covers the sales value of road vehicles in ASEAN that use an electric motor for propulsion, including battery electric and plug-in electric options, and counted where the vehicle is sold in the region.
Scope exclusions: We exclude non-road electric mobility (such as rail and marine), and we also exclude charging services and charging equipment revenue from the market value.
Segmentation Overview
- By Vehicle Type
- Two and Three Wheelers
- Passenger Cars
- Light Commercial Vehicles
- Medium and Heavy Commercial Vehicles
- Buses and Coaches
- By Drive-train Technology
- Battery Electric Vehicles (BEV)
- Plug-in Hybrid Electric Vehicles (PHEV)
- Fuel-Cell Electric Vehicles (FCEV)
- Hybrid Electric Vehicles (HEV)
- By Charging Level
- AC Slow / Level-2
- DC Fast (≥ 50 kW)
- By End-User Type
- Personal / Household
- Commercial Fleet and Logistics
- Government and Public Transport
- By Country
- Indonesia
- Thailand
- Malaysia
- Vietnam
- Philippines
- Singapore
- Myanmar
- Cambodia
- Laos
- Brunei
Data Sources, Market Sizing, and Validation
Desk Research
Desk research helped us set the boundaries and build an initial demand and supply picture for EVs across ASEAN. We mainly relied on public sources that provide consistent time series, such as national transport and road agencies for registrations, customs statistics for vehicle and battery imports, and central bank or national statistics offices for currency and inflation signals used in price normalization.
We also checked policy and adoption signals through official energy and environment agencies, alongside multilateral sources such as the International Energy Agency and World Bank indicators for macro drivers that affect vehicle affordability. Company annual reports, investor decks, and reputable press were used to validate capacity announcements, model launches, and localization plans, and those were translated into measurable inputs for the model. Where needed, we referenced paid subscriptions for company financials and intelligence, shipment-level trade views, and patent databases to verify timelines and technology direction. The desk sources listed here are illustrative, and we reviewed additional public documents to collect, validate, and clarify specific data points.
Primary Interviews and Surveys
Primary work was used to pressure test what we observed in public data, especially around EV model mix changes, pricing moves, and how incentives are actually applied at the transaction level. We spoke with a mix of vehicle OEM ecosystem participants, component suppliers, charging and fleet operators, and local market experts across the main ASEAN demand centers to close gaps and confirm assumptions before finalizing the model.
Distribution of primary research fieldwork respondents
| Company type | Respondent position |
|---|---|
| Top tier: 36% | CXOs: 12% |
| Mid tier: 47% | Functional/Unit leaders: 35% |
| Smaller Players: 17% | Managers: 53% |
Market-Sizing & Forecasting
The sizing model starts from a top-down build that reconstructs the EV value pool using country-level vehicle sales and registrations, import and local assembly signals, and an EV penetration pathway by vehicle category. After building the demand pool, we convert it into value using average selling prices, adjusted for incentives, taxes, and mix shifts across two and three wheelers, passenger cars, and commercial vehicles.
To keep results grounded, we corroborated totals with selective bottom-up checks, including sampling model-wise price points, multiplying typical volumes by observed adoption by country, and validating the implied revenue split between battery electric and plug-in powertrains. Key inputs we tracked include EV unit sales and registrations by country, incentive eligibility rules and their effective uptake, charging rollouts that support usage confidence, battery pack cost direction that affects vehicle pricing, and the share of fleet procurement versus personal buyers. For forecasting, we used scenario analysis to reflect policy timing differences across ASEAN and the pace at which model availability and affordability change. Those scenarios were then aligned to expert views captured in the primary discussions. When bottom-up information was missing in smaller countries, gaps were handled using proxy adoption ratios tied to comparable markets and then checked against trade and registration signals.
Data Validation & Update Cycle
Validation is done through cross-checks so no single data series drives the full outcome. We compare modeled value and the implied unit trajectory against independent signals such as registrations, trade flows, and publicly visible price movements, and we investigate outliers before sign-off.
We also run a multi-step internal review where another analyst checks assumptions, formulas, and country rollups. Reports are refreshed annually, and interim updates are made when material events occur, such as major incentive changes, sudden FX shifts, or large OEM capacity announcements that can move near-term volumes. Before delivery, we run a fresh pass on the latest available indicators so the most current view is reflected.
Mordor Intelligence's Asean Electric Vehicle Market Size Compared With Other Published Estimates
Published estimates for ASEAN EV value often diverge because the underlying scope and time alignment are not the same, even when the titles look similar. Differences typically come from what is counted as an EV, which countries are grouped under ASEAN in the model, and whether prices are captured before or after incentives.
In a refresh-led read, the biggest gaps show up when the FX conversion timing window, fast-moving ASP shifts, and incentive changes are not updated in the same month or quarter, which can create spreads even if unit assumptions are close. By locking the price build to transaction-level incentive treatment, and rechecking the FX window and mix-driven ASP movement during each annual refresh, the resulting figure is kept stable and traceable, consistent with the approach used in Mordor Intelligence.
Benchmark comparison
| Source | Market Size | Gaps in Research Methodology |
|---|---|---|
| Mordor Intelligence | USD 5.99 B (2026) | |
| Industry Association A | USD 0.86 B (2023) | Uses an earlier base year and a narrower value pool that reads like an adoption and ecosystem view, which can undercount newer passenger EV sales surges and price inflation after 2023. |
| Industry Association A | USD 3.54 B (2028) | Forward figure is tied to a longer-horizon adoption narrative and may not apply the same ASP progression and FX timing checks country by country, which can shift the value outcome materially. |
The table shows that timing, scope boundaries, and how pricing is refreshed can move the market value by several billion dollars. By using observable demand signals and then validating them with interview-led checks on incentives, mix, and FX timing, we can keep the estimate repeatable and easier to audit when assumptions are updated.
Key Questions Answered in the Report
How large is the ASEAN electric vehicle market in 2026?
The ASEAN electric vehicle market size stands at USD 5.99 billion in 2026, with a forecast 31.55% CAGR to 2031.
What is driving two-wheeler electrification in Southeast Asia?
Battery-swapping networks, supportive fiscal incentives, and high urban motorcycle density push two-wheelers toward a 32.40% CAGR through 2031.
How fast are DC fast-chargers being deployed?
DC fast-charging points are slated to grow at a 32.85% CAGR, underpinned by Thailand’s 12,000-station target and Indonesia’s rapid public-network expansion.
What hurdles still impede mass adoption?
A lingering retail-price premium over ICE models, patchy rural infrastructure, grid-stability concerns, and cultural loyalty to diesel pickups remain key challenges.