
Market Overview
| Study Period | 2020 - 2031 |
|---|---|
| Forecast Data Period | 2026 - 2031 |
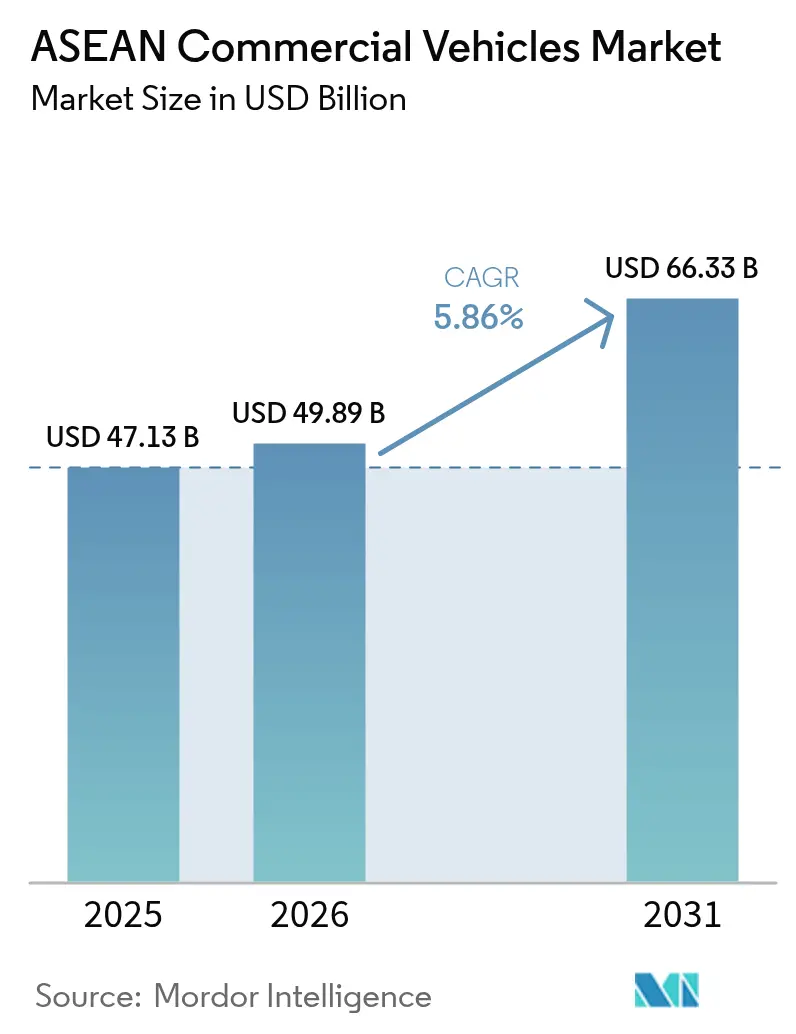
| Base Year Market Size (2025) | USD 47.13 Billion |
| Market Size (2026) | USD 49.89 Billion |
| Market Size (2031) | USD 66.33 Billion |
| Growth Rate (2026 - 2031) | 5.86 % |
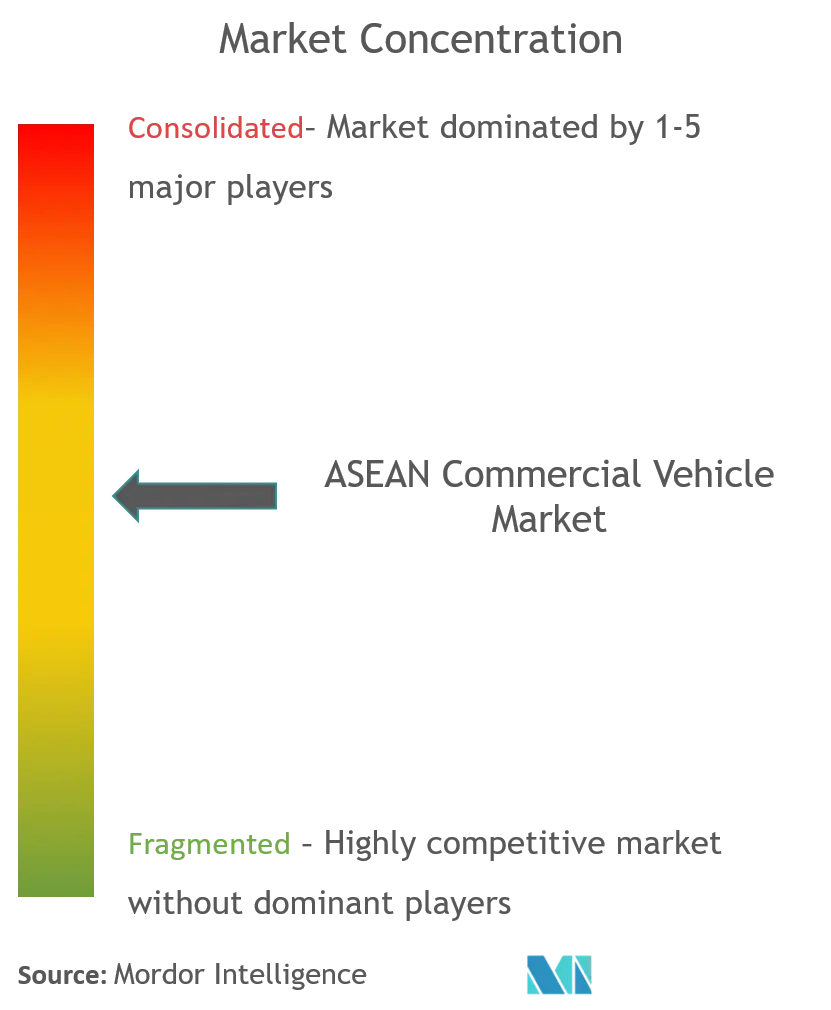
| Market Concentration | Medium |
Major Players *Disclaimer: Major Players sorted in no particular order Image © Mordor Intelligence. Reuse requires attribution under CC BY 4.0. | |
ASEAN Commercial Vehicles Market Analysis by Mordor Intelligence
The ASEAN commercial vehicles market size was valued at USD 47.13 billion in 2025 and estimated to grow from USD 49.89 billion in 2026 to reach USD 66.33 billion by 2031, at a CAGR of 5.86% during the forecast period (2026-2031). Surging infrastructure spending, the rapid digitalization of cross-border trade, and accelerating fleet electrification position the region as a pivotal production and consumption hub. Regional customs harmonization trims border-crossing times, while e-commerce platforms reconfigure last-mile distribution patterns and lift demand for agile light-duty models. Simultaneously, member states tighten emissions rules in line with Euro VI, prompting accelerated powertrain upgrades. Chinese OEMs deepen localization, leveraging cost advantages and tariff-free intra-ASEAN trade to erode the dominance of long-entrenched Japanese brands.
Key Report Takeaways
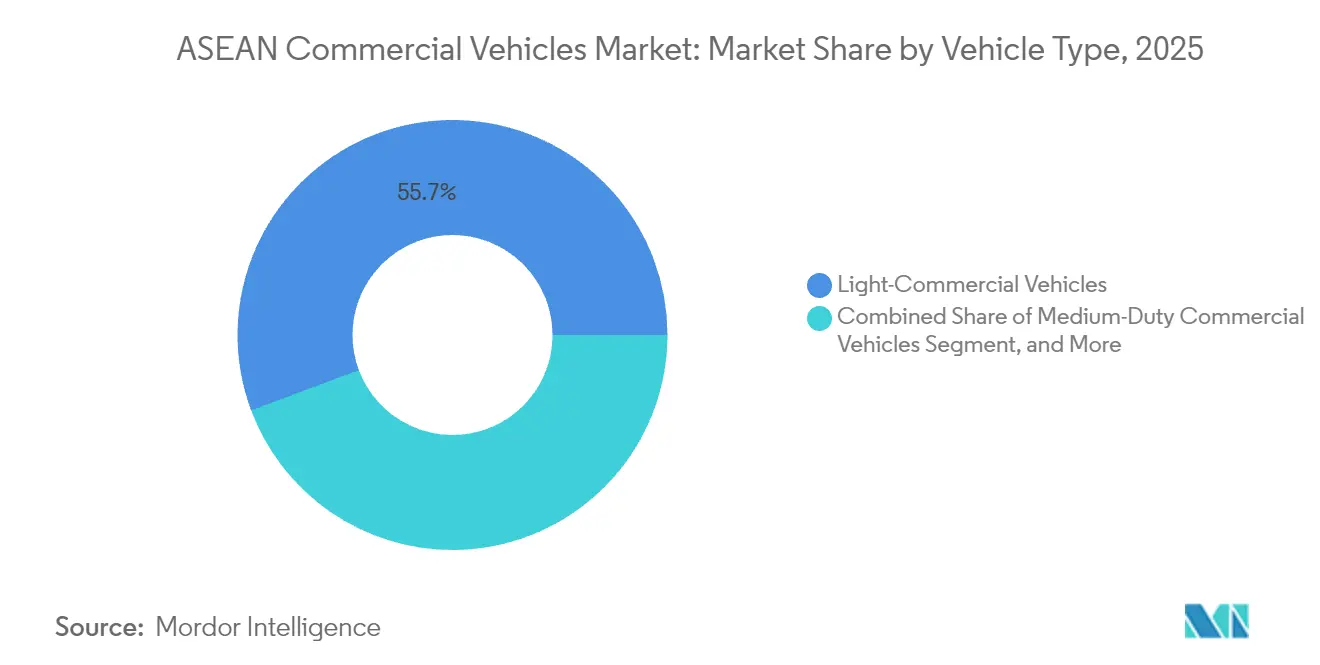
- By vehicle type, light commercial vehicles led with 55.70% of ASEAN commercial vehicles market share in 2025, while heavy-duty trucks trail at mid-single-digit CAGR growth
- By propulsion, internal-combustion models held 93.85% share of the ASEAN commercial vehicles market size in 2025; battery electric postings are projected to expand at a 10.12% CAGR through 2031
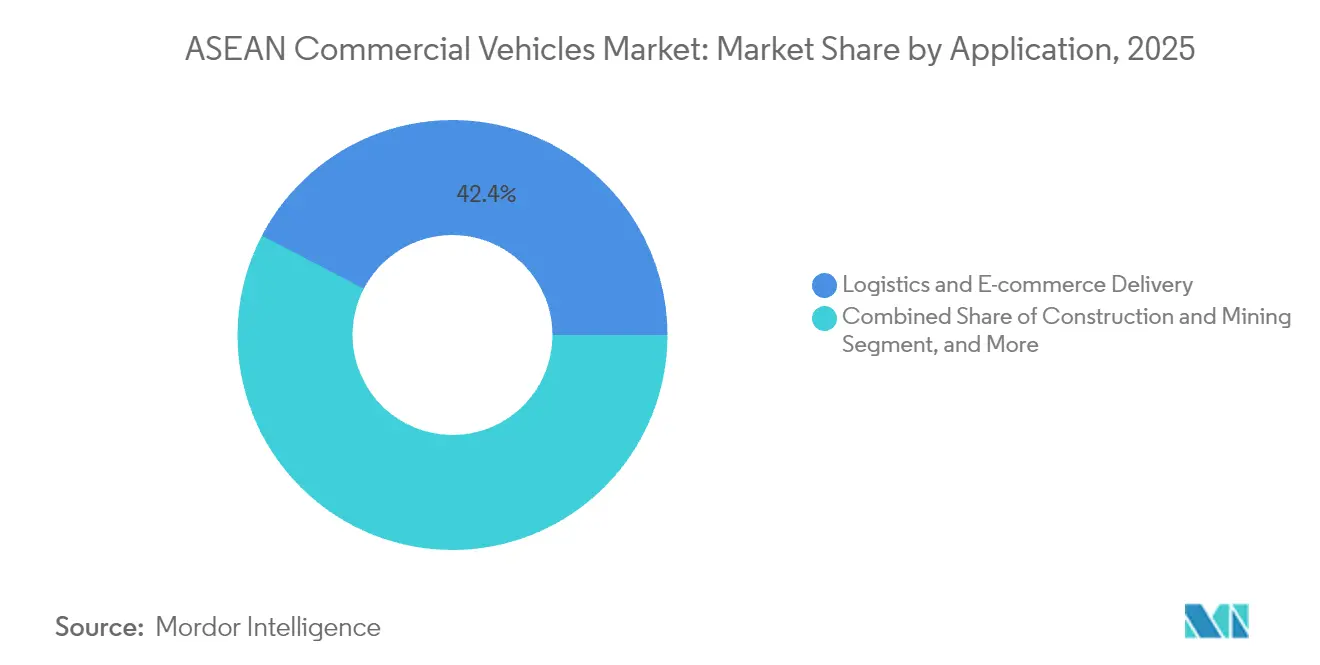
- By application, logistics and e-commerce captured 42.35% share of the ASEAN commercial vehicles market size in 2025; public transportation is poised for a 9.20% CAGR to 2031
- By body configuration, rigid trucks and vans accounted for 45.10% of the ASEAN commercial vehicles market size in 2025, while refrigerated bodies will rise at 10.05% CAGR
- By geography, Thailand commanded 37.70% revenue share in 2025; Singapore is forecast to grow at 10.08% CAGR through 2031
Note: Market size and forecast figures in this report are generated using Mordor Intelligence’s proprietary estimation framework, updated with the latest available data and insights as of 2026.
ASEAN Commercial Vehicles Market Trends and Insights
Drivers Impact Analysis*
| Driver | (~) % Impact on CAGR Forecast | Geographic Relevance | Impact Timeline |
|---|---|---|---|
| E-Commerce Boom and Last-Mile Logistics | +1.2% | Thailand, Indonesia, Vietnam | Short term (≤ 2 years) |
| Infrastructure Mega-Projects Pipeline | +0.9% | Thailand, Indonesia, Malaysia, Vietnam | Medium term (2-4 years) |
| Intra-ASEAN Trade Growth | +0.8% | Regionwide | Medium term (2-4 years) |
| Localization By Chinese EV-CV OEMs | +0.7% | Thailand, Indonesia, Malaysia | Short term (≤ 2 years) |
| Cold-Chain Demand Surge | +0.5% | Vietnam, Thailand, Indonesia | Long term (≥ 4 years) |
| Carbon-Credit / Green-Fleet Mandates | +0.4% | Singapore, Thailand, Malaysia | Long term (≥ 4 years) |
| Source: Mordor Intelligence | |||
E-commerce Boom and Last-Mile Logistics
Explosive online retail growth has redrawn shipment profiles, pushing fleet operators to favour compact vans, pickups, and two-wheeler cargo carriers that can slip through congested urban cores. Courier networks doubled service points across Thailand during 2024, underscoring operators’ urgency to narrow fulfilment windows. Purpose-built electric light trucks featuring modular cargo bays are gaining traction, especially where access restrictions penalise diesel vehicles. Partnerships between ride-hailing platforms and local assemblers have yielded sub-USD 1,000 battery-swappable motorbikes that cut idle time and extend asset life. Demand also tilts toward temperature-controlled micro-delivery units as social-commerce platforms heighten fresh-food throughput. Collectively, these shifts amplify procurement of light commercial platforms and open opportunities for telematics suppliers that can optimise multi-drop routing.
Infrastructure Mega-Projects Pipeline
Across Thailand, Indonesia, Malaysia, and Vietnam, more than USD 43 trillion in road and bridge spending is earmarked through 2035, equal to 63% of Asia-Pacific transport allocations[1]. Highway upgrades and quarry expansions lift immediate orders for tipper trucks, concrete mixers, and heavy-duty mining haulers. Port-centric logistics corridors spawning around Laem Chabang and Klang also boost container tractors. While project approvals create a steady baseline, delays tied to land acquisition or fiscal constraints introduce quarterly demand swings that compel OEMs to pursue modular body programmes and flexible shift patterns. Suppliers of drivetrain durability solutions and on-site maintenance services benefit as fleet owners prioritise uptime over outright acquisition cost.
Intra-ASEAN Trade Growth
The ASEAN Customs Transit System now recognises a single electronic declaration for vehicles traversing multiple borders, trimming paperwork and curbing dwell times[2]. Cross-border fleets, therefore, require tractors outfitted with geo-fencing, security locks, and cold-chain certification to comply with varying national rules. Manufacturing bases in Thailand and Indonesia leverage zero-tariff ASEAN Free Trade Area provisions to export semi-knockdown kits across the bloc, spurring intra-company logistics demand. While freight flows rise with economic integration, lingering bottlenecks at Johor and Poipet crossings reveal the need for digital queue management and harmonised axle-load rules.
Localization by Chinese EV-CV OEMs
Over the past two years, Chinese entrants led by BYD and Foton have funnelled more than USD 1.4 billion into Thai and Indonesian assembly. Local output circumvents import duties, benefits from region-wide tariff exemptions, and qualifies for green-fleet incentives. BYD alone captured over one-third of Thailand’s battery-electric commercial sales after launching a USD 486 million Rayong plant in 2024. High-energy-density battery lines accelerate regional supply-chain maturity and drive down pack costs, forcing incumbent Japanese brands to fast-track their electrification roadmaps. Chinese localisation also nurtures local tier-2 suppliers that gain access to new thermal management and in-wheel motor technologies.
Cold-Chain Demand Surge
Rising per-capita incomes and digital grocery adoption escalate the need for temperature-controlled transport. Vietnam’s cold-storage throughput gap of 17.6 million tons drives orders for small refrigerated vans that can navigate dense districts. Pharmaceutical distribution mandates, especially for mRNA vaccines and biologics, further propel demand for ATP-certified bodies with remote temperature logging. Local conversion houses partner with insulation panel providers and HVAC specialists to cut lead times and meet stricter food-safety rules. OEMs that integrate chiller units at the factory gate gain an edge as fleet managers prioritise warranty alignment and single-point servicing.
Restraints Impact Analysis*
| Restraint | (~) % Impact on CAGR Forecast | Geographic Relevance | Impact Timeline |
|---|---|---|---|
| Stricter Euro VI-Equivalent Standards | -0.8% | Thailand, Indonesia, Malaysia, Philippines | Medium term (2-4 years) |
| EV-CV Charging and TCO Barrier | -0.6% | Indonesia, Philippines | Short term (≤ 2 years) |
| Fragmented Advanced-Powertrain After-Sales | -0.4% | Regionwide | Medium term (2-4 years) |
| SME Credit Tightening for Fleet Renewal | -0.5% | Thailand, Malaysia, Indonesia | Short term (≤ 2 years) |
| Source: Mordor Intelligence | |||
Stricter Euro VI-Equivalent Standards
Thailand enforced Euro 5 diesel specifications in January 2024 and signalled Euro VI compliance no later than 2030, moves mirrored by Cambodia and the Philippines[3]. While environmental gains are clear, the upgrades inflate engine and exhaust-after-treatment costs by 15-20%, squeezing margins for low-volume assemblers. Disparities in diesel sulphur content across member states complicate calibration work, lengthening homologation cycles. OEMs with selective catalytic reduction portfolios stand to gain volume, but smaller players risk exit as capital-expenditure demands outstrip balance-sheet capacity.
EV-CV Charging & TCO Barrier
Despite triple-digit growth, Indonesia recorded battery-electric penetration below 5% in 2024, as fast-charging density lags metro sprawl. Thailand added fewer than 600 public chargers by mid-2024, producing range anxiety that deters small freight operators. Battery packs still represent over 35% of vehicle cost, extending payback beyond typical three-year leasing horizons. Pilot battery-swapping schemes, championed by Isuzu and Mitsubishi, target urban delivery routes yet face land-lease and standards-harmonisation hurdles. Without bundled finance and energy-as-a-service contracts, wide-scale electric truck adoption remains aspirational.
*Our forecasts treat driver/restraint impacts as directional, not additive. The impact forecasts reflect baseline growth, mix effects, and variable interactions.
Segment Analysis
By Vehicle Type: Light Commercial Dominance Amid Electrification
Light commercial vehicles held 55.70% of ASEAN commercial vehicles market share in 2025, buoyed by parcel-delivery momentum and municipal restrictions on heavy diesels. Segment revenue is projected to compound at 6.65% annually through 2031, outpacing the broader ASEAN commercial vehicles market. Chinese challengers introduce battery-electric pickups that undercut traditional offerings by 20%, while Japanese incumbents counter with mild-hybrid upgrades. Urban consolidation centres proliferate around Bangkok and Ho Chi Minh City, catalysing demand for panel vans equipped with factory-fitted shelving and telematics bundles.
The medium-duty cohort serves construction logistics and waste-management niches, relying on improved torque curves and automated transmissions to navigate congestion. Heavy-duty tractors remain vital for intra-ASEAN freight corridors, yet their growth moderates as rail pipelines gain traction on mainland routes. Consequently, chassis makers exploring lightweight composites and aerodynamics enhancements secure competitive advantage in fuel-efficiency-obsessed fleets seeking quick returns on capital.

By Propulsion: ICE Dominance Faces Electric Disruption
Internal-combustion engines represent 93.85% of the ASEAN commercial vehicles market size in 2025, but their share erodes as policy incentives tilt fleet economics. Battery-electric models, starting from a low base, are expected to post a 10.12% CAGR to 2031, doubling their contribution within the ASEAN commercial vehicles market. Thailand’s EV3.5 scheme grants excise waivers that reduce OEM landed costs, accelerating model-line additions. Indonesia’s aspirational target of 600,000 electric vehicles by 2030 stimulates vendor finance packages tied to nickel-rich domestic battery supply.
Plug-in hybrids occupy a bridging role where duty concessions favour low-carbon yet range-extending solutions. Fuel-cell prototypes surface mainly in cross-border haulage pilots between Malaysia and Singapore, leveraging short hydrogen corridors co-developed with port authorities. For ICE holdouts, Euro VI hardware and synthetic-diesel compatibility become selling points as customers weigh future resale value against near-term capital outlay.
By Application: Logistics Leadership Drives Market Evolution
Logistics and e-commerce generated 42.35% of the ASEAN commercial vehicles market size in 2025 and remain the largest demand pool. Route-planning software integration, rising load-factor expectations, and delivery-time guarantees push operators toward connected light vans and micro-trucks. Public transportation fleets are forecast to expand at 9.20% CAGR as Jakarta, Manila, and Kuala Lumpur scale electric bus tenders aligned with net-zero roadmaps. Construction and mining underpin stable heavy-duty demand, especially in limestone and nickel extraction zones tied to the battery value chain.
Agricultural mechanisation drives sporadic spikes in medium-duty orders during harvest cycles, while municipal utilities endorse CNG refuse trucks to meet urban-air quality benchmarks. Cold-chain plays emerge across pharmaceuticals and perishable foods, recruiting reefer-equipped bodies with advanced insulation composites. Subsequent aftermarket opportunities arise in telematics retrofits and door-to-door warranty programmes.
By Body Configuration: Rigid Trucks Lead Specialized Growth
Rigid trucks and vans captured 45.10% of the ASEAN commercial vehicles market size in 2025, favoured for versatility and easier licensing. Manufacturers extend wheelbase offerings to accommodate high-volume e-commerce parcels and refrigeration kits. The refrigerated segment, growing at 10.05% CAGR, benefits from bulk vaccine distribution and temperature-sensitive seafood exports from Vietnam’s Mekong Delta. Tractor-trailer combinations gain incremental tailwinds from ASEAN Customs Transit digitisation, yet face axle-load harmonisation delays that complicate cross-border fleet planning.
Tipper and dump configurations feed infrastructure mega-projects, with alloy-bodied units shaving tare weight by 400 kg to carry higher payloads. Bus and coach output rebounds as cross-provincial tourism resumes, supported by duty-free battery imports for city buses in Indonesia. Manufacturers investing in quick-swap battery decks and low-floor chassis secure early-mover status among transit agencies seeking universal design compliance.
Geography Analysis
Thailand commands 37.70% of the ASEAN commercial vehicles market share in 2025, sustained by its 1.8 million-unit vehicle output and dense supplier clusters. The government’s EV3.5 incentive package grants excise rebates that draw Chinese OEMs such as BYD and Foton into USD 1.4 billion of localized assembly, deepening the nation’s electrification ecosystem. Nonetheless, higher interest rates and an 11-month sales slide leave dealers carrying elevated inventory, pressuring discount margins. Mandatory Euro 5 diesel from January 2024 adds compliance costs yet positions Thailand as a regulatory benchmark for the wider ASEAN commercial vehicles market.
Indonesia represents the volume opportunity in the ASEAN commercial vehicles market, despite a 15.8% production decline to 215,362 units in 2023. Toll-road expansion and a target to deploy 41,000 e-buses by 2024 reinforce long-term demand for heavy and public-transport chassis. Fleet owners favour rugged drivetrains that withstand archipelagic road conditions, but nickel-rich battery supply chains are prompting pilot electric truck orders tied to mining logistics. Singapore, although small, shows the fastest growth at a 10.08% CAGR through 2031 as its diesel registration ban, effective in 2025, drives wholesale fleet electrification. High purchasing power and dependable grid capacity make the city-state a proving ground for over-the-air software and autonomous delivery pilots.
Vietnam’s Q1 2025 light-vehicle sales jumped 24%, and new entrants such as Chery and Geely have commissioned CKD plants that lift domestic commercial chassis output. The government’s industrial policy supports VinFast’s move into electric trucks, positioning the country to capture a larger slice of the ASEAN commercial vehicles market size that is set to climb to USD 66.33 billion by 2031. Malaysia enjoys trade-corridor advantages between Thailand and Singapore, yet peak-hour bans on Klang Valley highways from February 2025 redirect demand toward smaller rigid trucks. The Philippines leverages duty-free EV imports and tax holidays to attract assembly projects, while Cambodia’s new Toyota Tsusho pickup line illustrates nascent localisation spreading across smaller economies.
Regulatory Landscape
ASEAN commercial-vehicle regulation is tightening on emissions and safety while moving toward regional harmonization. Thailand enforced Euro 5 diesel specifications in January 2024 and signaled Euro VI compliance no later than 2030, while ASEAN members are increasingly aligning technical rules through the ASEAN Mutual Recognition Arrangement (APMRA) for Automotive Products, built around recognition of testing and inspection results based on 19 UN ECE regulations.
In 2026, national rulemaking also centered on compliance digitalization and operating constraints. Singapore expanded demand-side support for electrification via the Heavy Vehicle Zero Emission Scheme (HVZES) from January 2026 for heavy goods vehicles and buses above 3,500 kg MLW, and mandated UN R51-03 Phase 2 noise compliance for newly registered goods vehicles from April 2026. Vietnam also introduced additional import and technical requirements, including reported use of the national single-window system (VNSIS) for heavy truck and special-purpose vehicle pre-declaration (72 hours pre-arrival), reinforcing the importance of documentation accuracy and border-process readiness for cross-border operators and importers.
Value Chain Analysis
The ASEAN commercial-vehicle value chain is built around regional manufacturing hubs and cross-border parts movement supported by ASEAN Free Trade Area provisions. Thailand remains a key production and export base, while Indonesia, Malaysia, Vietnam, and the Philippines expand localized assembly and, increasingly, electrification-linked component activity as OEMs and suppliers shift from pure import models to regionalized sourcing and CKD circulation.
Type approval and standards alignment are becoming more operational across the chain. In November 2025, the ASEAN Automotive Committee endorsed guidance for implementing the ASEAN MRA on Type Approval of Automotive Products (APMRA) through the ASEAN Consultative Committee for Standards and Quality (ACCSQ), supporting shared test results and reducing redesign and re-testing across member states. Downstream, distribution and service networks face constraints from port congestion, limited specialized RoRo capacity, and uneven customs processes, while the move toward mixed powertrains (ICE, hybrid, BEV) adds complexity in inbound logistics (batteries, thermal management, power electronics) and increases aftermarket readiness requirements for advanced powertrains.
Competitive Landscape
The ASEAN commercial vehicles market remains moderately concentrated. Japanese incumbents Isuzu and Toyota have long dominated assembly networks, yet ballooning battery subsidies and tariff exemptions now erode their pricing power. Toyota reported a 26.2% sales drop for 2024 in Thailand[4], while Isuzu’s pickup deliveries fell 21% year-on-year in April 2024, underscoring pressure on legacy portfolios. To regain momentum, Toyota and Daimler are merging Hino and Fuso operations into a single holding company slated for listing in 2026, pooling R&D for zero-emission trucks.
Chinese challengers deploy cost-efficient batteries and localised plants to seize ground, with BYD investing USD 486 million in a Rayong facility and already securing over one-third of Thailand’s electric-truck segment. Foton marked its millionth overseas vehicle in Thailand during November 2024, signalling scale that underwrites aggressive warranty programmes and fleet-financing offers. These entrants exploit ASEAN Free Trade Area privileges to route kits across borders, shortening lead times and lifting localisation rates that dilute incumbent advantage. Their ascendancy drives price compression in the light commercial segment but simultaneously accelerates technology diffusion across the wider ASEAN commercial vehicles market.
European players Daimler Truck, Volvo, and Scania concentrate on high-margin heavy tractors and pilot hydrogen corridors linking Malaysia and Singapore. Daimler Truck’s tie-up with Toyota also aims to strengthen purchasing clout for autonomous-driving sensors and battery cells. Indian OEMs Ashok Leyland and Tata Motors pursue white-space niches by combining Thai contract manufacturing with emerging battery-swap partnerships, thereby easing range anxiety for SME fleets. At the distribution level, dealers expand mobile service units and predictive-maintenance platforms to defend aftermarket share as over-the-air software updates become standard. Fintech leasing start-ups bundle usage-based insurance and carbon-credit monetisation, heightening competitive churn while lowering entry barriers for small hauliers eager to join the ASEAN commercial vehicles market.
ASEAN Commercial Vehicles Industry Leaders
-
Isuzu Motor Ltd
-
Toyota Motor Corporation
-
UD Trucks
-
Ford Motor Company
-
AB Volvo
- *Disclaimer: Major Players sorted in no particular order
Market Opportunities and Future Outlook
Regulatory-driven technology upgrades create near-term opportunities in safety systems, compliance engineering, and fleet retrofit packages. A key catalyst is the ASEAN SCC implementation of a 2026 import technical specification requiring ADAS content (including AEB, LDW, and ESC) for imported light commercial vehicles across nine ASEAN markets with a transition window, which pushes importers and OEMs to standardize sensor suites, validation, and service tooling across the region.
Manufacturing localization and electrification incentives also open investable nodes across ASEAN for local body builders, component suppliers, and charging solutions. Singapore activated the Heavy Vehicle Zero Emissions Scheme in January 2026, pairing vehicle incentives (S$40,000) with charger co-funding (up to S$30,000) through 2028, supporting controlled deployment of electric heavy vehicles and depot infrastructure in a high-utilization environment. On the supply side, new and expanded regional capacity, including Daimler Commercial Vehicles Manufacturing Indonesia (DCVMI) in Cikarang (5,000 units per year, inaugurated June 2025) and KIM LONG MOTORs truck plant in Hue, Vietnam (20,000 units per year, inaugurated March 2026), strengthens the case for localized sourcing, fleet procurement programs, and intra-ASEAN distribution of commercial-vehicle platforms and variants.
Recent Industry Developments
- May 2026: PT Toyota Motor Manufacturing Indonesia (TMMIN) and CATL announced a collaboration including an approximately USD 80 million investment to expand local EV battery production capacity in Indonesia. The move supports local sourcing for electrified vehicles and reinforces Indonesias role in regional battery supply chains, which influences procurement economics for electric commercial fleets.
- July 2025: Isuzu announced a restructuring of its product supply for medium and heavy-duty trucks, including changes to production allocation within its broader strategic cooperation framework. The action focuses manufacturing efficiency and platform planning for Asian markets, with knock-on effects for model availability and parts support across Southeast Asia.
- July 2024: BYD opened its first Southeast Asian factory in Rayong, Thailand, backed by a USD 486 million investment. Local production strengthens price competitiveness versus imports and accelerates regional availability of electrified commercial-vehicle derivatives through ASEAN trade routes.
Research Methodology Framework and Report Scope
Market Definition and Coverage
This market covers the value of commercial vehicles sold across ASEAN, counted at the country level and then consolidated into one regional total. It includes light, medium, and heavy commercial vehicles, as well as buses, across common on-road applications like freight movement and passenger transport.
Scope exclusions: We exclude off-highway equipment and agricultural or construction machinery that is not registered and not sold as an on-road commercial vehicle.
Segmentation Overview
- By Vehicle Type
- Light Commercial Vehicles
- Medium-Duty Commercial Vehicles
- Heavy-Duty Commercial Vehicles
- By Propulsion
- Internal Combustion Engine
- Battery Electric Vehicle
- Plug-in Hybrid Electric Vehicle
- Fuel Cell Electric Vehicle
- By Application / End-Use
- Logistics and E-commerce Delivery
- Construction and Mining
- Agriculture and Forestry
- Public Transportation (Bus & Coach)
- Utilities and Municipal Services
- By Body Configuration (NEW)
- Rigid Truck and Van
- Tractor-Trailer
- Bus and Coach
- Tipper and Dump
- Refrigerated
- By Country
- Indonesia
- Thailand
- Vietnam
- Malaysia
- Philippines
- Singapore
- Rest of the ASEAN Countries
Data Sources, Market Sizing, and Validation
Desk Research
Desk work starts with mapping each ASEAN country using official vehicle registration and sales releases, along with transport and road statistics. Public sources used here include ASEAN Secretariat publications, national statistics offices, transport ministry portals, and customs trade datasets for vehicles and parts. These inputs help us understand import reliance and where prices are likely moving by market.
We also review company annual reports and investor presentations for shipment commentary, product mix, and capacity plans, then cross-check these notes with reputable press and association updates. For hard-to-find time series, we use selective paid subscriptions for company financials and news, vehicle sales and parc trackers, and shipment-level import and export records to reconcile volumes and the implied price bands. These examples are not exhaustive, and we rely on additional public and internal references to complete data collection, validation, and open-question resolution.
Primary Interviews and Surveys
Primary work focuses on validating how demand splits across key use cases such as last-mile delivery, construction-linked fleets, and intercity goods movement. We also confirm how pricing moves by weight class and powertrain. We speak with OEM and distributor-side executives, fleet operators, leasing and financing participants, and parts and service stakeholders across APAC hubs within ASEAN, so assumptions on replacement cycles, lead times, and order pipelines can be checked before the model is finalized.
Distribution of primary research fieldwork respondents
| Company type | Respondent position |
|---|---|
| Top tier: 26% | CXOs: 13% |
| Mid tier: 54% | Functional/Unit leaders: 36% |
| Smaller Players: 20% | Managers: 51% |
Market-Sizing & Forecasting
Market sizing is built using a top-down approach. We reconstruct country-level commercial vehicle demand from new sales and registration series, then translate demand into value using typical transaction price bands by class. Once the demand pool is shaped, we cross-check with selective bottom-up approximations, such as sampled model-wise ASP multiplied by estimated unit sales, dealer channel checks, and a sanity roll-up using a short list of large fleet purchase patterns.
Inputs used in the model include new vehicle sales and registration counts, gross vehicle weight class splits, diesel versus electrified mix, replacement and scrappage behavior, and macro indicators that link closely to fleet buying like construction output and freight activity. Because price drift can change totals quickly, we apply country currency timing consistently, and we treat incentive-led EV pricing separately where it is material. Forecasting is run using scenario analysis supported by a simple multivariate regression. Expert feedback is used to set realistic bounds for sales recovery, infrastructure-led demand, and powertrain adoption. Where country data gaps exist, we use proxy indicators and nearest-neighbor country patterns, then adjust back through interview-based validation.
Data Validation & Update Cycle
Validation is done in layers, starting with cross-checking the modeled value and unit totals against independent signals like import trends, announced capacity changes, and financing activity where available. When variances are large, we revisit the main drivers, which typically are unit assumptions, class mix, or the applied price bands, and then we correct the underlying inputs.
Before sign-off, the work is reviewed in multiple analyst steps, so the final numbers follow the logic trail and do not rely on one assumption. The report is refreshed annually, and interim updates are completed when material events occur, such as policy shifts, emissions-rule changes, or sharp currency movement. Right before delivery, we run a final pass so clients receive an updated view aligned with the latest available data.
Mordor Intelligence's Asean Commercial Vehicles Market Estimate Compared With Other Published Estimates
Published market sizes for ASEAN commercial vehicles often do not match because the counted vehicle set and the value basis are not identical. Differences also show up when one study uses shipment value and another uses retail value, or when forecasts are expressed from different base years and exchange-rate timing.
By tracking country-wise unit sales with class-level price bands and then having Mordor Intelligence refresh currency timing and electrified-vehicle incentives during validation, the model avoids mixing off-highway demand and keeps the total aligned to on-road commercial vehicle purchases.
Benchmark comparison
| Source | Market Size | Gaps in Research Methodology |
|---|---|---|
| Mordor Intelligence | USD 47.13 B (2025) | |
| Global Consultancy A | USD 42.30 B (2024) | Uses an earlier base year and appears to apply a broader segmentation with mixed application buckets, which can shift what is counted as commercial vehicle demand across countries. The exchange-rate point and price basis are not clearly stated, which can lower the converted USD value versus a consistent year-average approach. |
| Regional Consultancy B | USD 45.00 B (2024) | States a rounded current value and leans on scenario narratives through 2030, but the pricing build-up and unit anchors are not shown in detail. When unit-to-value conversion is not tied to weight-class mix and observed price drift, totals can cluster around a simplified midpoint. |
The table shows that most of the spread is explained by base-year selection and how unit volumes are translated into USD value across countries. Our approach keeps the steps traceable, so buyers can connect totals back to unit signals, class mix, and pricing logic, and then update the same structure as new registration and sales data comes in.
Key Questions Answered in the Report
What is the current value of the ASEAN commercial vehicles market?
The market is valued at USD 49.89 billion in 2026 and is projected to reach USD 66.33 billion by 2031.
Which segment holds the largest ASEAN commercial vehicles market share?
Light commercial vehicles lead with 55.70% share in 2025, driven by e-commerce and urban delivery demand.
How fast are electric commercial vehicles growing in ASEAN?
Battery-electric models are expected to post a 10.12% CAGR through 2031, making them the fastest-growing propulsion category.
How will stricter emission norms affect the market?
Euro VI-aligned regulations will raise compliance costs, potentially prompting consolidation as smaller assemblers struggle to fund clean-technology upgrades.
What are the main challenges to electrification of commercial fleets?
Limited charging infrastructure, higher upfront vehicle cost, and fragmented after-sales support slow adoption despite policy incentives.