
Asbestos Market Size and Share
Market Overview
| Study Period | 2020 - 2031 |
|---|---|
| Market Size (2026) | USD 1.16 Billion |
| Market Size (2031) | USD 1.35 Billion |
| Growth Rate (2026 - 2031) | 3.01 % |
| Fastest Growing Market | Middle East and Africa |
| Largest Market | Asia-Pacific |
| Market Concentration | Medium |
Major Players *Disclaimer: Major Players sorted in no particular order Image © Mordor Intelligence. Reuse requires attribution under CC BY 4.0. | |
Asbestos Market Analysis by Mordor Intelligence
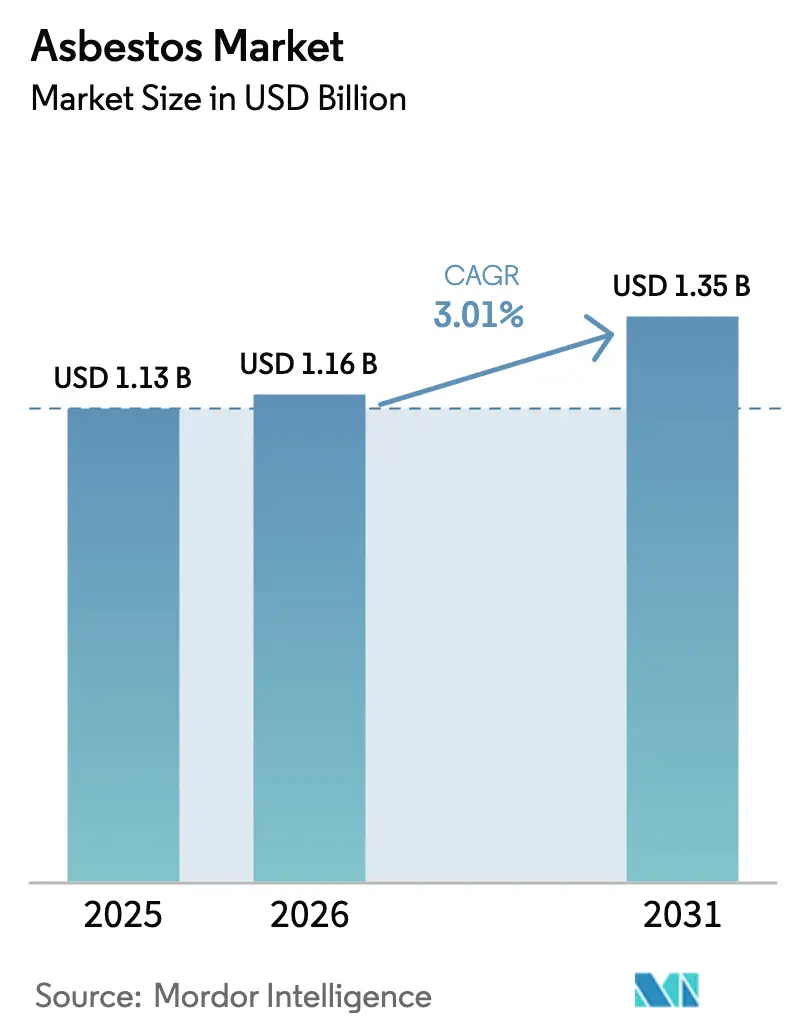
The asbestos market size is expected to grow from USD 1.13 billion in 2025 to USD 1.16 billion in 2026 and is forecast to reach USD 1.35 billion by 2031 at 3.01% CAGR over 2026-2031. Cost competitiveness in cement sheets and pipes, infrastructure booms in emerging economies, and weak regulatory enforcement continue to counterbalance escalating health concerns and outright bans. Asia-Pacific anchors demand through low-cost housing projects, while Russia, Kazakhstan, Brazil, and China keep global supply concentrated. Regulatory arbitrage shapes trade flows as producers target jurisdictions with permissive rules. Simultaneously, litigation expenses and the rapid commercialization of safer substitutes pressure margins and accelerate technology migrations.
Key Report Takeaways
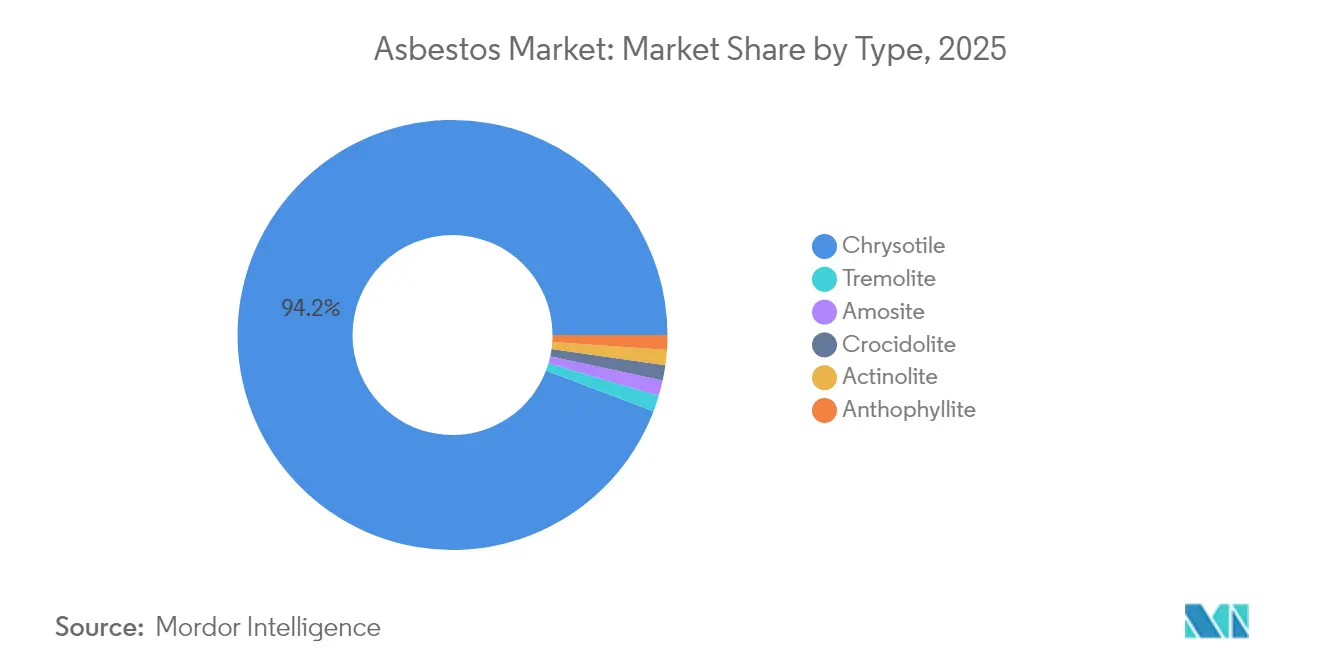
- By type, chrysotile held 94.23% of asbestos market share in 2025, yet tremolite recorded the highest forecast CAGR at 3.16% through 2031.
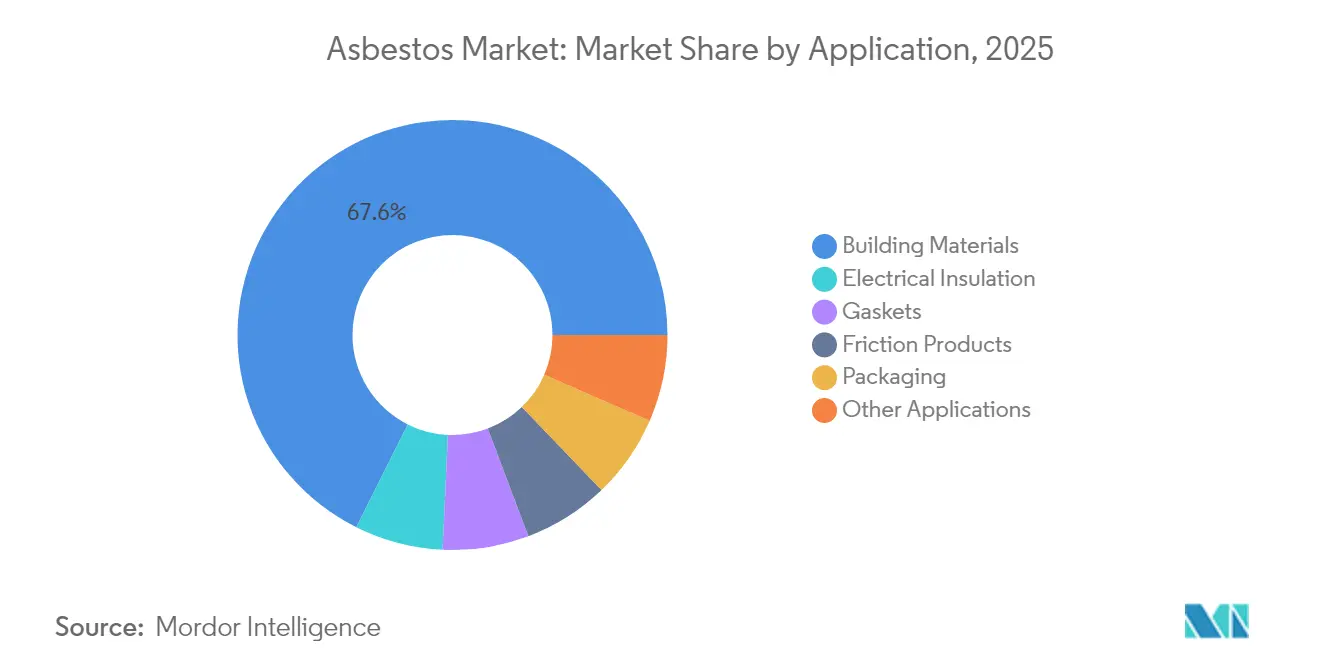
- By application, building materials accounted for 67.62% share of the asbestos market size in 2025, while electrical insulation is advancing at a 3.26% CAGR through 2031.
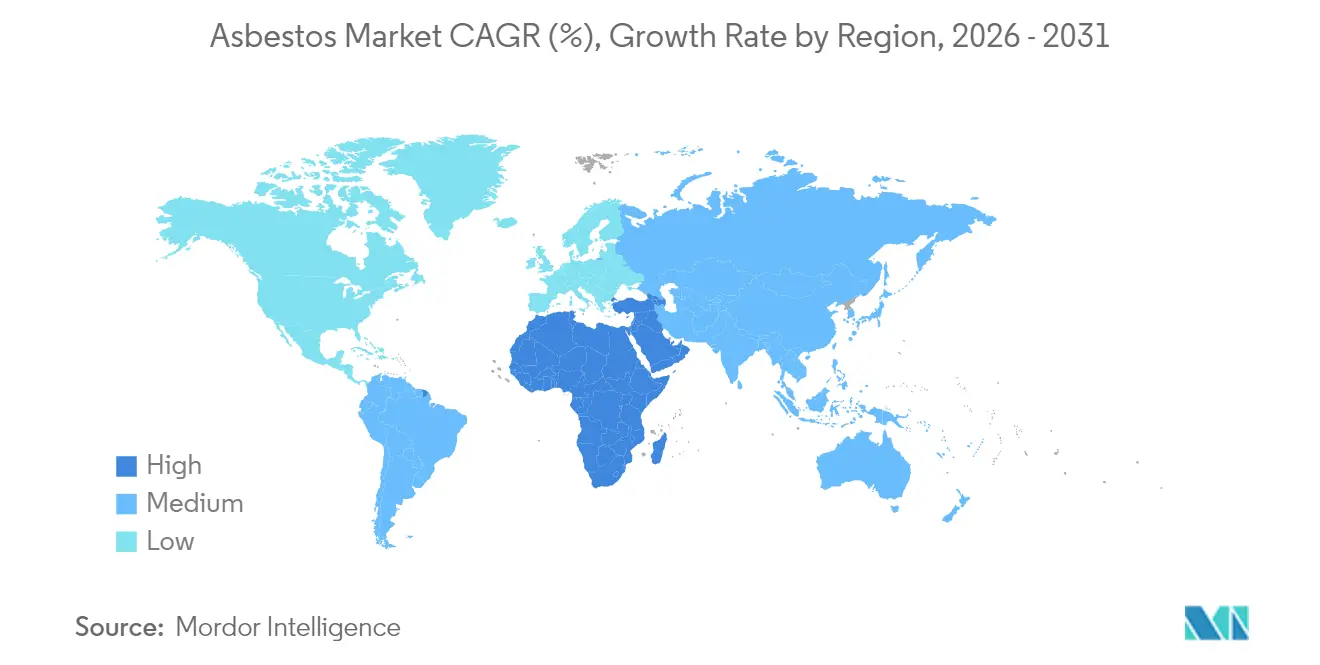
- By geography, Asia-Pacific commanded 70.62% revenue in 2025; the Middle East and Africa region is projected to expand at a 3.47% CAGR to 2031.
Note: Market size and forecast figures in this report are generated using Mordor Intelligence’s proprietary estimation framework, updated with the latest available data and insights as of 2026.
Global Asbestos Market Trends and Insights
Drivers Impact Analysis*
| Driver | (~) % Impact on CAGR Forecast | Geographic Relevance | Impact Timeline |
|---|---|---|---|
| Rapid Infrastructure Growth in APAC and Africa Sustaining Low-Cost Asbestos Cement Demand | +1.2% | APAC core, spill-over to Africa | Medium term (2-4 years) |
| Rising Retrofit and Repair Activity in Legacy Asbestos-Built Stock (Roofing, Pipes) | +0.8% | Global, concentrated in developed markets | Long term (≥ 4 years) |
| Cost Advantage of Chrysotile Over Synthetic Substitutes for Chlor-Alkali Diaphragms | +0.6% | Global industrial centers | Short term (≤ 2 years) |
| Weak Enforcement of Asbestos Bans in High-Growth Emerging Economies | +0.9% | APAC, MEA, Latin America | Medium term (2-4 years) |
| Niche Demand from Specialised Gaskets in Chemical and Oil Processing | +0.4% | Global industrial hubs | Long term (≥ 4 years) |
| Source: Mordor Intelligence | |||
Rapid infrastructure growth in APAC and Africa sustaining low-cost asbestos cement demand
Large-scale housing and transport programs across India, China, Nigeria, and Ethiopia continue to favor asbestos cement because of its price advantage and ready supply. India imported 361,164 tonnes in 2019-2020, mainly from Russia, to feed roof and pipe projects that dominate affordable housing. Chinese construction firms expanding into Ethiopia and Angola often specify asbestos cement sheets for rural schools and warehouses, reinforcing demand corridors that link Asian producers with African builders. Nigeria’s construction sector historically consumed more than 1 million tons across multiple projects, indicating an entrenched user base that still values the material’s durability. WHO warns that asbestos-related diseases cause 125,000 annual deaths worldwide, yet governments prioritizing cost control continue to approve imports. This infrastructure-led demand underpins the asbestos market even as global bans intensify.
Rising retrofit and repair activity in legacy asbestos-built stock
Millions of roofs, water mains, and wallboards installed before bans now require upkeep, prompting steady demand for encapsulation coatings, removal services, and replacement panels. Specialized contractors invest in negative-pressure enclosures, HEPA filtration, and certified disposal, which pushes startup costs to USD 150,000 and beyond according to industry surveys. The United States consumed 110 tons of chrysotile from stockpiles in 2024, entirely for maintenance in chlor-alkali plants that still rely on asbestos diaphragms. Latvia’s 2024 pilot removal scheme exhausted its budget months early, underscoring the latent workload in older housing stock. These retrofit activities extend the asbestos market life cycle while fostering the parallel growth of alternative materials that can slot into existing fittings without design changes.
Cost advantage of chrysotile over synthetic substitutes for chlor-alkali diaphragms
For decades, asbestos diaphragms delivered reliable performance at lower operating voltages in brine electrolysis units. European Commission reviews between 1975 and 2004 confirmed no technically equivalent replacement in legacy cells, keeping three plants in Germany and Poland reliant on roughly 300 tons of chrysotile[1]European Commission, “Review of Chrysotile Derogations,” europa.eu . That cost gap is narrowing as membrane suppliers such as De Nora commercialize polymer solutions that reduce energy use and cut hazardous waste. The United States EPA nonetheless issued a 2024 rule that phases out chrysotile, compelling gradual plant conversions by 2037 and signaling to emerging markets that the economics of status-quo technology are deteriorating. Until full compliance takes effect, price-sensitive operators in Asia, Africa, and Latin America continue to purchase chrysotile fiber, sustaining a niche but profitable flow for miners.
Weak enforcement of asbestos bans in high-growth emerging economies
India banned mining in 1993, yet it remains the world’s largest asbestos importer and hosts an industry valued at USD 2 billion that employs about 300,000 people across more than 100 factories. Nigeria reports no official asbestos mortality statistics, reflecting data gaps that impede policy enforcement. Public awareness is low; surveys in Indian industrial corridors show residents seldom recognize asbestos as carcinogenic despite widespread exposure. Such regulatory vacuums allow low-priced sheets and pipes to remain the default choice in rural construction, keeping the asbestos market entrenched even as global opinion shifts.
Restraints Impact Analysis*
| Restraint | (~) % Impact on CAGR Forecast | Geographic Relevance | Impact Timeline |
|---|---|---|---|
| Acceleration of National Bans (E.G., EPA 2024 US Chrysotile Phase-Out) | -1.8% | Global, led by developed markets | Short term (≤ 2 years) |
| Escalating Litigation and Insurance Costs for Producers and Downstream Users | -1.1% | North America and EU, spreading globally | Medium term (2-4 years) |
| Rapid Commercialisation of Non-Asbestos Fibre-Cement and Brake Friction Materials | -0.7% | Global, faster adoption in developed markets | Long term (≥ 4 years) |
| Source: Mordor Intelligence | |||
Acceleration of national bans (e.g., EPA 2024 US chrysotile phase-out)
The United States outlawed chrysotile imports in March 2024 and set phased conversion deadlines that extend through 2037 for specialty uses. Mexico’s Congress advanced a blanket prohibition in January 2024, widening the no-use zone across North America. More than 60 countries now enforce full bans, and multilateral bodies such as WHO continue to promote substitution initiatives. The chlor-alkali sector alone faces USD 2.8 billion to USD 3.4 billion in conversion costs under the updated rule set. As each major economy implements restrictions, suppliers lose market access, compressing global consumption and redirecting fiber toward fewer permissive destinations.
Escalating litigation and insurance costs for producers and downstream users
Insurance carriers paid out USD 1.8 billion in asbestos claims in 2022, a 9% jump that strains reserves and raises premiums for manufacturers and contractors. Global corporate liabilities reached USD 73 billion, prompting restructurings such as Berkshire Hathaway affiliates filing for Chapter 11 protection in early 2025. 3M booked USD 523 million to cover respirator-linked claims, illustrating how peripheral players also shoulder substantial exposure. Social inflation trends in the United States added 7 percentage points to liability growth during 2023, amplifying settlement values and jury awards. These financial burdens push firms to exit asbestos segments, accelerate substitution research, or off-load portfolios to specialist legacy-management vehicles.
*Our forecasts treat driver/restraint impacts as directional, not additive. The impact forecasts reflect baseline growth, mix effects, and variable interactions.
Segment Analysis
By Type: Chrysotile dominance faces regulatory pressure
Chrysotile captured 94.23% of asbestos market share in 2025 because builders, automakers, and chlor-alkali operators favor its flexible fibers and relative availability. Russia accounted for 48% of global mine output in 2025, followed by Kazakhstan, Brazil, and China, yet sanctions and logistics issues trimmed Russian exports from 65% to 48% since 2020. Tremolite exhibited a 3.16% CAGR through 2031, the fastest within the asbestos market, due to specialized metallurgical and heat-shield applications where substitutes remain costly. EPA’s 2024 ban removed chrysotile access to the lucrative United States, signaling that amphibole types could inherit a residual share only in jurisdictions without bans. As more countries align with WHO recommendations, type demand will splinter into narrow geographic niches, making supply more volatile.
Many producers already segment inventory by destination. Russian mines channel premium chrysotile grades to India and China, whereas mid-grade fiber moves to Africa and Latin America where construction standards are lower. In contrast, amphibole demand is now almost entirely research-driven, with universities and material science firms ordering micro quantities for controlled experiments in filtration and high-temperature ceramics. Such shifts illustrate a bifurcated asbestos market that simultaneously contracts in volume yet persists in high-precision pockets.


By Application: Building materials leadership under siege
Buiding materials represented 67.62% of 2025 consumption because of their affordability in low-income housing. India alone erected more than 100,000 rural dwellings with asbestos cement roofs during the last fiscal year, underpinning the building materials share. Electrical insulation posted a 3.26% CAGR to 2031, reflecting demand in heavy-duty transformers and furnace cables where thermal shock resistance and dielectric strength trump health concerns. Friction products such as brake pads declined in North America and Europe but stayed stable in Africa and parts of Asia where vehicle safety regulations are less stringent. Packaging, once a sizable niche, dwindled as food and pharma rules tightened.
Alternative fiber-cement boards now outprice asbestos panels by only USD 0.15 per square meter in some Southeast Asian markets, eroding the legacy cost advantage. The EPA-mandated shift to membrane cells in chlor-alkali facilities will also dent diaphragm fiber orders. Gasket makers increasingly adopt compressed non-asbestos sheets, citing better sealability and reduced fugitive emissions. Consequently, the asbestos market is losing its largest application pillars even as smaller industrial niches persist.
Geography Analysis
Asia-Pacific generated 70.62% of asbestos market revenue in 2025, led by India’s position as the world’s top importer at 44% of global volume. The region employed about 300,000 workers across more than 100 plants, creating economic inertia that resists health-based reforms. China remained both a major consumer and producer, and public health projections forecast 15,000 annual asbestos disease deaths by 2035, underscoring the social costs of continued use. Indonesia, Vietnam, and the Philippines also retain permissive rules, funneling fiber from Russian and Kazakhstan mines into roofing and piping lines. These factors cement Asia-Pacific’s dominance in the asbestos market even as international advocacy builds against it.
North America underwent structural change after the United States banned chrysotile in 2024. Domestic consumption fell to 110 tons sourced entirely from legacy stockpiles, and chlor-alkali plants must complete membrane conversions by 2037. Canada, once a significant producer, now exports almost all mined asbestos to Asia but faces external pressure to shutter operations. Mexico’s draft ban would seal off the final regional outlet, consolidating a continental moratorium that influences global trade lanes. Litigation remains the region’s defining legacy burden, with billions in outstanding claims that squeeze balance sheets across the construction, industrial gas, and consumer goods sectors.
Europe maintains a zero-tolerance policy on new asbestos use, having implemented bans across member states in the 1990s. Legacy remediation now dominates activity, including the removal of insulating boards from schools and public buildings. The European Commission still grants narrow derogations for low-voltage chlor-alkali cells where safe dismantling is technically complex, but those exceptions are shrinking. National programs such as Latvia’s 2024 pilot demonstrate that remediation demand often outstrips fiscal capacity, suggesting a long tail of asbestos service activity. These experiences feed innovation in alternative fiber-cement boards and membrane technologies that exporting firms now sell to Asia, Africa, and Latin America.

Value Chain Analysis
Upstream supply is concentrated in a small set of mining and beneficiation hubs in Russia, Kazakhstan, Brazil, and China, with chrysotile dominating trade flows. Large producers often run integrated chains that cover extraction, fiber grading and beneficiation, and export logistics. This structure helps them meet quality specifications for asbestos-cement and industrial users while routing volumes toward jurisdictions with permissive rules.
Downstream conversion is led by asbestos-cement sheet and pipe makers, along with smaller-volume industrial fabricators supplying gaskets, packing, and insulation components. In Russia, asbestos-cement combines and technical factories absorb graded fiber and convert it into construction and industrial products, while export-oriented miners supply major importing markets in Asia-Pacific and selected destinations in Africa and Latin America. Service chains for legacy asbestos (removal, encapsulation, and certified disposal) expand where bans are enforced, shifting value toward abatement contractors, monitoring labs, and hazardous-waste handling.
Competitive Landscape
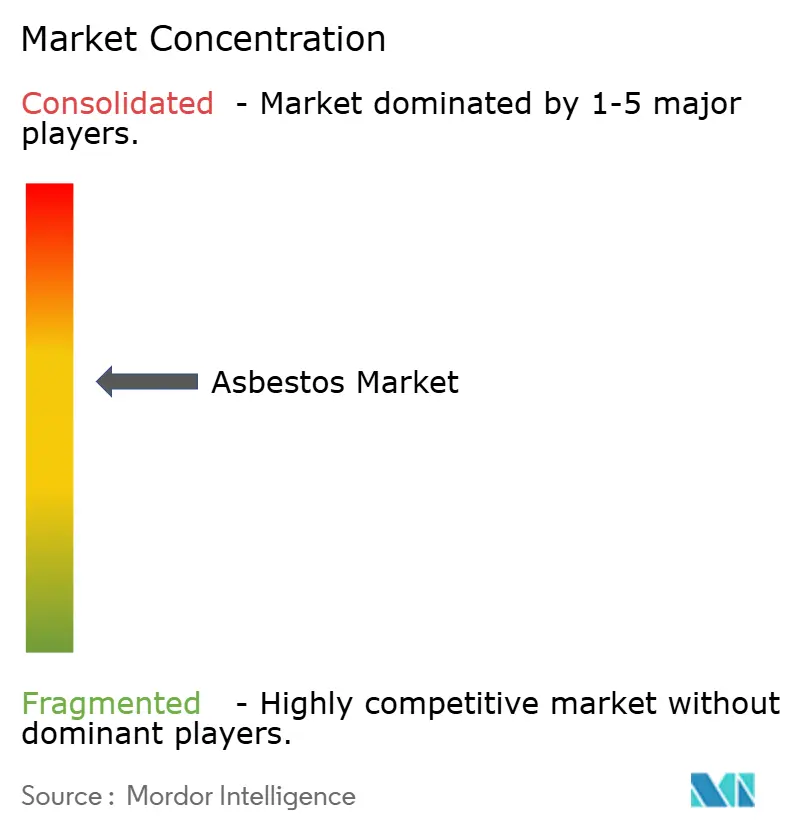
The asbestos market is moderately consolidated around a handful of miners. Russia’s PJSC Uralasbest produced 21% of global chrysotile and supplied 41% of Russian output in 2025, exporting roughly 80% of its grade 4-6 fiber[2]Uralasbest, “Company Fact Sheet,” uralasbest.ru . Kostanay Minerals JSC in Kazakhstan lifted its market presence to 26% of global exports after capital upgrades improved ore recovery. SAMA Mineração de Amianto Ltda. in Brazil owns the world’s largest active open-pit asbestos mine and accounted for 15% of world supply, with 90% shipped to Asia and MEA. Ningbo Xinyan Friction Materials Co., Ltd. illustrates downstream integration, balancing asbestos and non-asbestos product lines to hedge regulatory risk and exporting 80-90% of output to 30 countries.
Competitive strategy emphasizes cost leadership and market proximity. Russian and Kazakh firms market FOB prices 15-20% below Brazilian fiber because of shorter shipping routes to India, consolidating share despite sanctions. Producers invest in beneficiation to deliver higher tensile strength fibers for specialized gaskets, preserving margins in contracting volumes. At the same time, leading players are launching legacy management funds or purchasing liability insurance to reassure lenders and customers. Velan Inc., for example, retired its asbestos liabilities before accepting a takeover bid, signaling that clean balance sheets are a prerequisite for corporate transactions in this space. The competitive gap widens between miners that pivot toward substitute technology partnerships and those that remain locked in commodity extraction.
Asbestos Industry Leaders
PJSC Uralasbest
JSC Orenburg Minerals
Kostanay Minerals JSC
SAMA Mineração de Amianto Ltda.
BHARAT ASBESTOS & RUBBER CO.
- *Disclaimer: Major Players sorted in no particular order

Market Opportunities and Future Outlook
White-space increasingly concentrates in compliance-oriented offerings that let remaining asbestos supply chains operate under tighter scrutiny, including higher-consistency fiber grading, improved dust-control systems, and auditable EHS practices. Kostanay Minerals JSC ties its operating posture to international ESG alignment through participation in RES 2026, indicating how engagement with environmental forums is used to support permitting, customer qualification, and continuity of exports in a market shaped by regulatory arbitrage.
A second opportunity zone sits in industrial transition pathways where asbestos use persists for legacy reasons while conversions proceed, especially in chlor-alkali and select gasket and sealing applications. The US EPA chrysotile phase-out rule finalized in March 2024, with compliance milestones extending to 2037 for specialty uses, creates near-term work around plant conversion, qualification of non-asbestos substitutes, and retrofits that reduce exposure during interim operation. Producers that document investment programs and modernization efforts, along with downstream firms that maintain dual portfolios of asbestos and non-asbestos products, have clearer levers to retain customers across markets that impose tighter procurement and liability controls.
Recent Industry Developments
- May 2026: Kostanay Minerals JSC participated in the KIOSH 2026 exhibition. The participation highlights company-level exposure to safety and regulatory audiences. It also increases visibility with safety-focused buyers and regulators.
- May 2026: Kostanay Minerals JSC conducted a delegation visit to Kazpetrol Group facilities as part of the Kusto Group ecosystem. The visit supports intra-holding synergies and aligns industrial standards across the group pipeline. It also reinforces supply chain integration within the group.
- April 2026: Kostanay Minerals JSC participated in the Regional Environmental Summit RES 2026. The participation signals commitment to environment and sustainability at the regional level. It strengthens engagement for regulatory risk management, public perception, and future permitting and community-relations discussions.


Research Methodology Framework and Report Scope
Market Definition and Coverage
This market covers the commercial value of asbestos fiber sold into industrial uses, where it is processed into materials such as cement products, friction items, insulation, and sealing components across end users and geographies.
Scope exclusions: We exclude asbestos abatement, removal, disposal services, legal settlements, and broader substitute materials that are not asbestos-based.
Segmentation Overview
- By Type
- Chrysotile
- Amosite
- Crocidolite
- Tremolite
- Actinolite
- Anthophyllite
- By Application
- Building Materials
- Electrical Insulation
- Friction Products
- Packaging
- Gaskets
- Other Applications
- By Geography
- Asia-Pacific
- China
- India
- Japan
- South Korea
- Rest of Asia-Pacific
- North America
- United States
- Canada
- Mexico
- Europe
- Germany
- United Kingdom
- France
- Italy
- Russia
- Rest of Europe
- South America
- Brazil
- Argentina
- Rest of South America
- Middle East and Africa
- Saudi Arabia
- South Africa
- Rest of Middle East and Africa
- Asia-Pacific
Data Sources, Market Sizing, and Validation
Desk Research
Desk research starts by pinning down real-world supply and movement of asbestos so the demand pool does not get overstated. We rely on public production and mineral statistics such as the USGS Mineral Commodity Summaries, and trade flows from UN Comtrade style datasets accessed through portals such as the World Bank WITS and OEC.
To ground end-use demand, we also review public building and infrastructure indicators and safety context, using sources such as national statistics offices, the World Health Organization for health and policy context, and relevant standards and guidance pages from regulators. Company annual reports, investor presentations, and credible press coverage help validate where supply is going and how pricing moved. Where a data gap exists by country, we supplement with paid subscriptions used for company financials and intelligence, import-export shipment-level signals, and patent databases for substitution and product direction. These examples are not exhaustive, and many other public sources were also cross-checked for data collection, validation, and clarification.
Primary Interviews and Surveys
Primary work is used to validate where asbestos is still permitted and actively used, and to sense-check conversion into cement products, friction uses, and industrial sealing demand. We speak with participants across the value chain, including producers, distributors, processors, and buyers, and the discussion is balanced across major consuming and producing regions so assumptions from desk research can be corrected when needed.
Distribution of primary research fieldwork respondents
| Company type | Respondent position | Region |
|---|---|---|
| Top tier: 32% | CXOs: 12% | APAC: 52% |
| Mid tier: 52% | Functional/Unit leaders: 30% | EMEA: 29% |
| Smaller Players: 16% | Managers: 58% | Americas: 19% |
Market-Sizing & Forecasting
Sizing starts with a top-down reconstruction of the addressable market by combining country-level asbestos production and trade, and then applying use-share splits into major consuming applications where asbestos is still in circulation. At the point where demand is shaped by regulation and product switching, the market total is corroborated with selective bottom-up checks using sampled price per ton ranges and volume reasonableness for key consuming countries.
Inputs used in the model include asbestos fiber trade volumes (HS-coded trade where available), domestic production levels, building activity indicators tied to asbestos-cement usage, friction materials replacement cycles in industrial and automotive maintenance, and observed price movements in asbestos fiber. We also track policy signals (ban status, enforcement strength, and allowed-use exceptions) because they change the eligible demand pool, followed by a lagged adjustment in trade and usage.
Forecasting is done using scenario analysis supported by a light multivariate regression layer, where demand is linked to construction activity, industrial production, and policy tightening intensity. When bottom-up pricing or volume details are missing for a small country, we use proxy pricing from similar import-dependent markets and adjust using freight and currency timing, and then the totals are rechecked against regional trade balance behavior so outliers are corrected.
Data Validation & Update Cycle
Validation is done through repeated cross-checks between the modeled value, tonnage signals, and the implied average prices so the result stays realistic. We run variance checks by country and by application, and any sharp jumps are reviewed against trade disruptions, policy announcements, or supply changes before sign-off.
A second analyst reviews key assumptions and calculations, and call-backs are triggered when primary feedback conflicts with desk indicators by a material margin. Reports are refreshed annually, and interim updates are made when major events occur that can move trade flows or permitted-use status. Before delivery, a final pass is completed so clients receive the latest updated view.
Mordor Intelligence's Asbestos Market Size Versus Other Published Estimates
Published market sizes for asbestos often differ because the underlying scope is not consistent, and the same word can mean fibers only in one study and finished asbestos-containing products in another. Differences also come from how firms treat banned regions, and whether they model legal-use demand only or blend in remediation and litigation related spending.
The biggest gap drivers for asbestos are usually whether asbestos-cement products are valued as finished goods versus valuing the asbestos fiber input, how HS trade codes are used when reporting is incomplete, and how quickly policy changes are reflected in the forecast. Some estimates also apply broad price escalation without checking if it matches traded unit values and observed contract behavior, and currency conversion timing can widen the spread in years with FX volatility.
Benchmark comparison
| Source | Market Size | Gaps in Research Methodology |
|---|---|---|
| Mordor Intelligence | USD 1.16 B (2026) | |
| Trade Journal A | USD 2.39 B (2025) | Often values a wider basket of asbestos-containing finished products and uses a faster price progression, which can lift totals versus a fiber-led value model anchored to trade tonnage. |
| Industry Bulletin B | USD 1.18 B (2024) | Typically relies on limited country coverage and static application splits, and it can miss demand shifts when bans tighten or when trade reroutes to permissive markets. |
The table shows that the spread is mainly about what gets counted and how quickly assumptions are refreshed, rather than a simple math error. When the market is tied to production and trade tonnage checks and then adjusted using realistic price-per-ton ranges by consuming region, adjacent categories like abatement services do not inflate the total, which is the approach applied by Mordor Intelligence.


Key Questions Answered in the Report
What is the current size of the asbestos market?
The asbestos market size reached USD 1.16 billion in 2026 and is forecast to grow to USD 1.35 billion by 2031.
Which region dominates global demand?
Asia-Pacific controls 70.62% of demand, fueled by India’s position as the top importer and ongoing infrastructure expansion.
Which asbestos type is most prevalent?
Chrysotile accounts for 94.23% of global consumption, although its dominance is under regulatory pressure.
How will the U.S. EPA ban affect global trade?
The 2024 chrysotile ban removes a major market, forces chlor-alkali plants to convert by 2037, and redirects supply toward Asia, Africa, and Latin America.
What is driving demand growth despite health risks?
Cost advantages in cement products, weak enforcement in emerging markets, and limited substitutes in certain industrial applications sustain consumption.
Page last updated on:


 Your data is secure and never sold or shared.


